Processed Events
After an event listener’s rule has executed and the event is processed successfully, i.e., the associated target functions or circuits have executed successfully, you can view the detailed execution history from the Processed Events section of the rule. The event listener’s statistics will also display the processed event count.
You can access the processed events of any component or custom event listener rule in the following way:
- Open the event listener from the Event Listeners page.
- Open the specific rule from the list of rules of the event listener.
- Click the Processed Events tab next to the General Details tab.
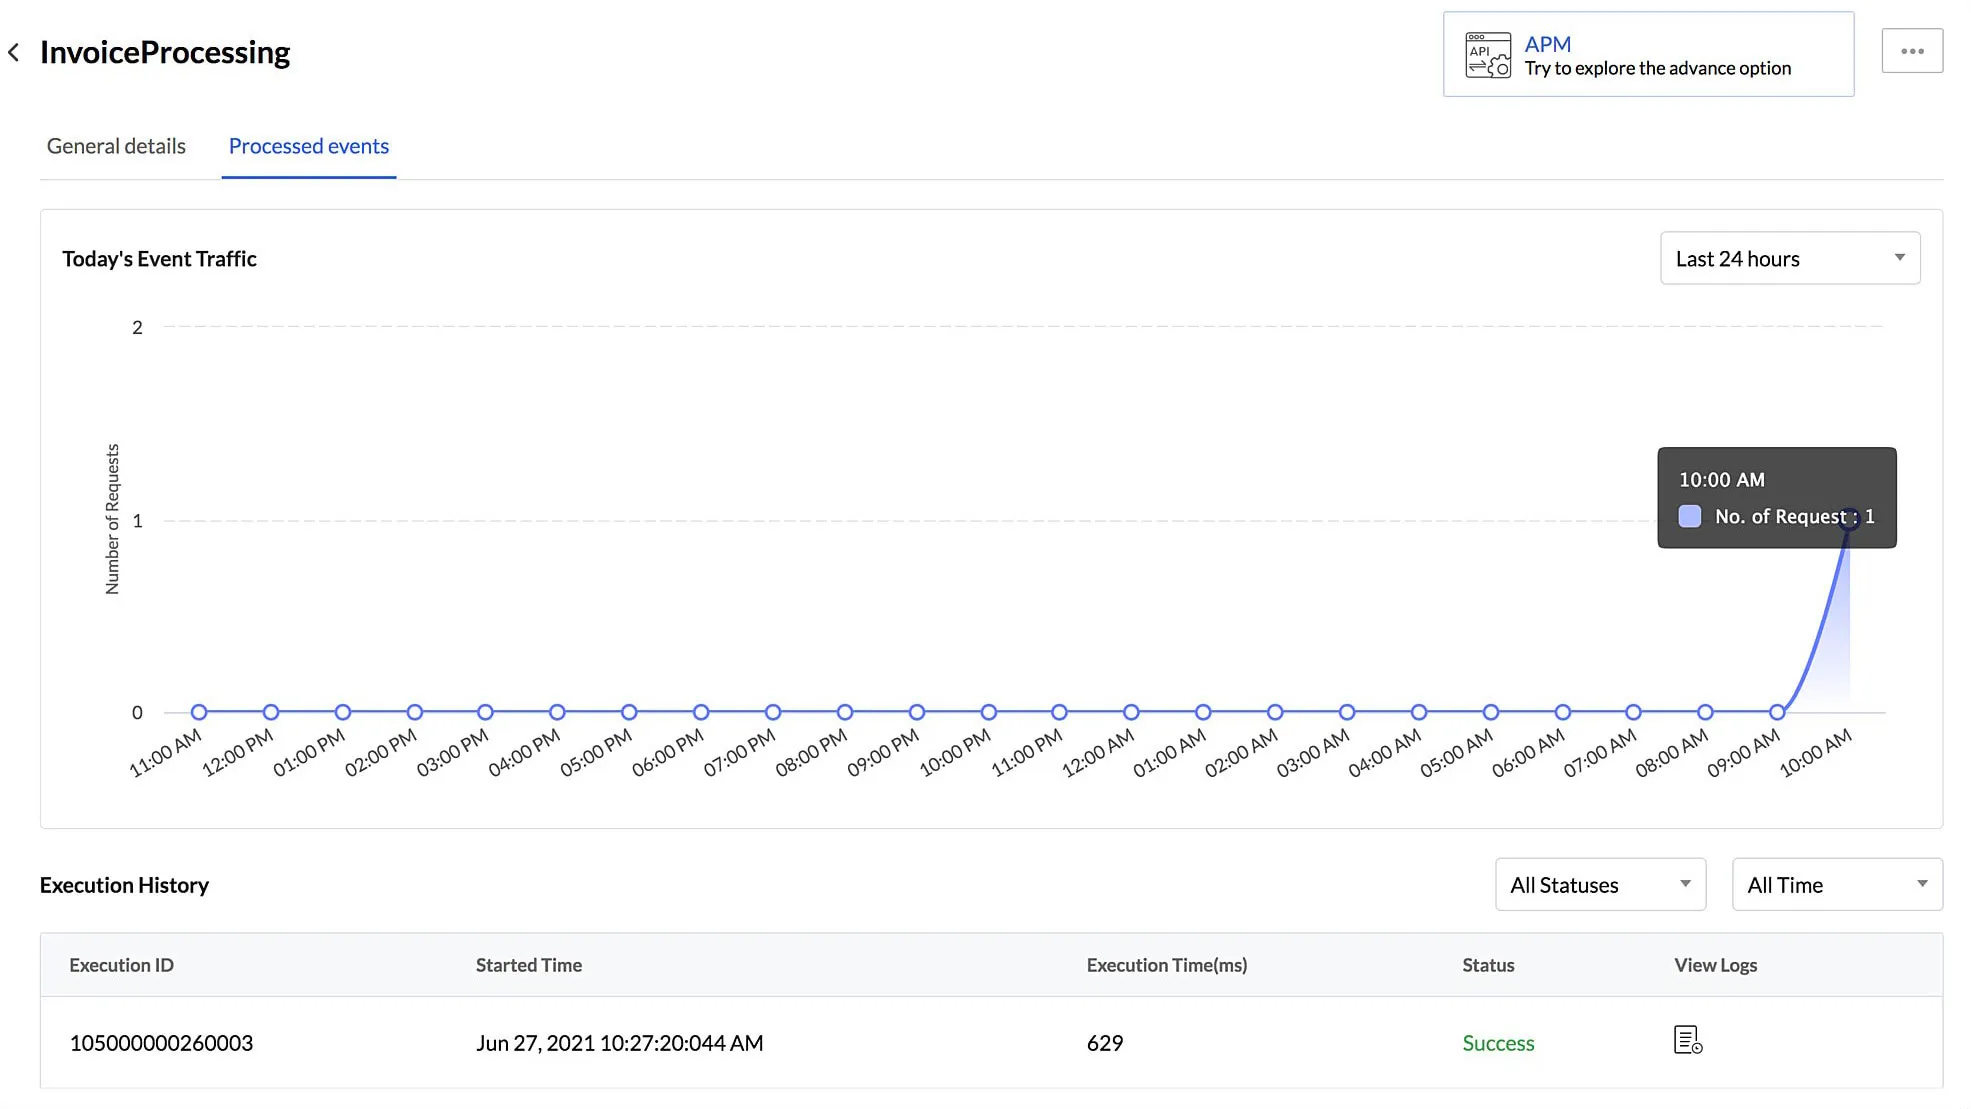
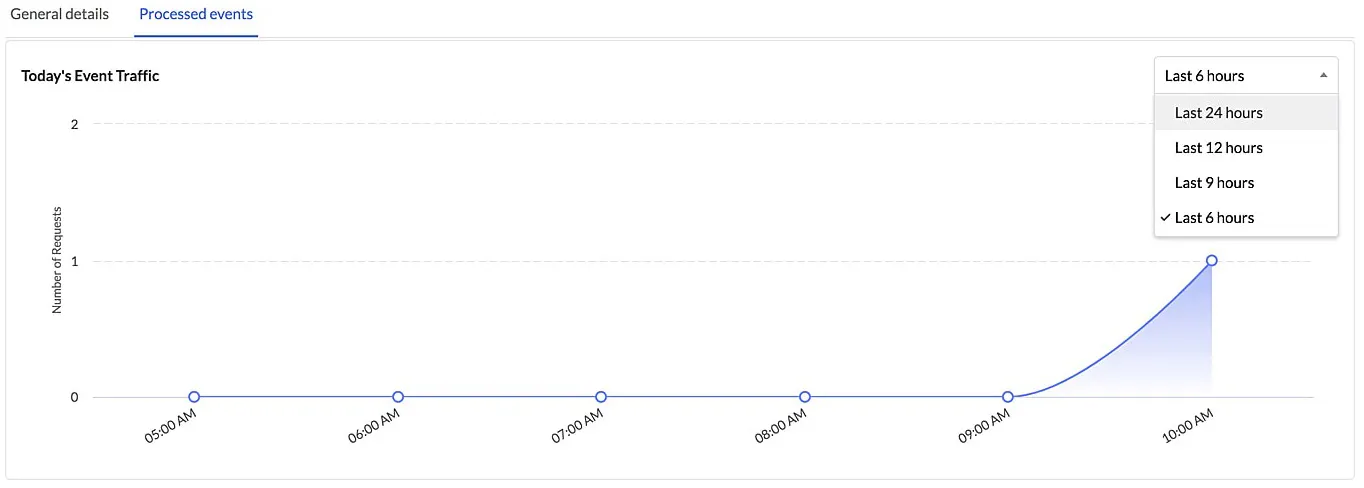
This section contains an event traffic graph of the day that displays the number of requests processed successfully in the last 24 hours. You can also select a specific time period from the drop-down filter, to view the graph of that time period alone.
The execution history displays several details of each execution including a unique Execution ID that refers to that execution, the start time, execution time, and the status of the execution.
You can also use the status filter to view executions of a particular status, such as the successful or timed out executions.
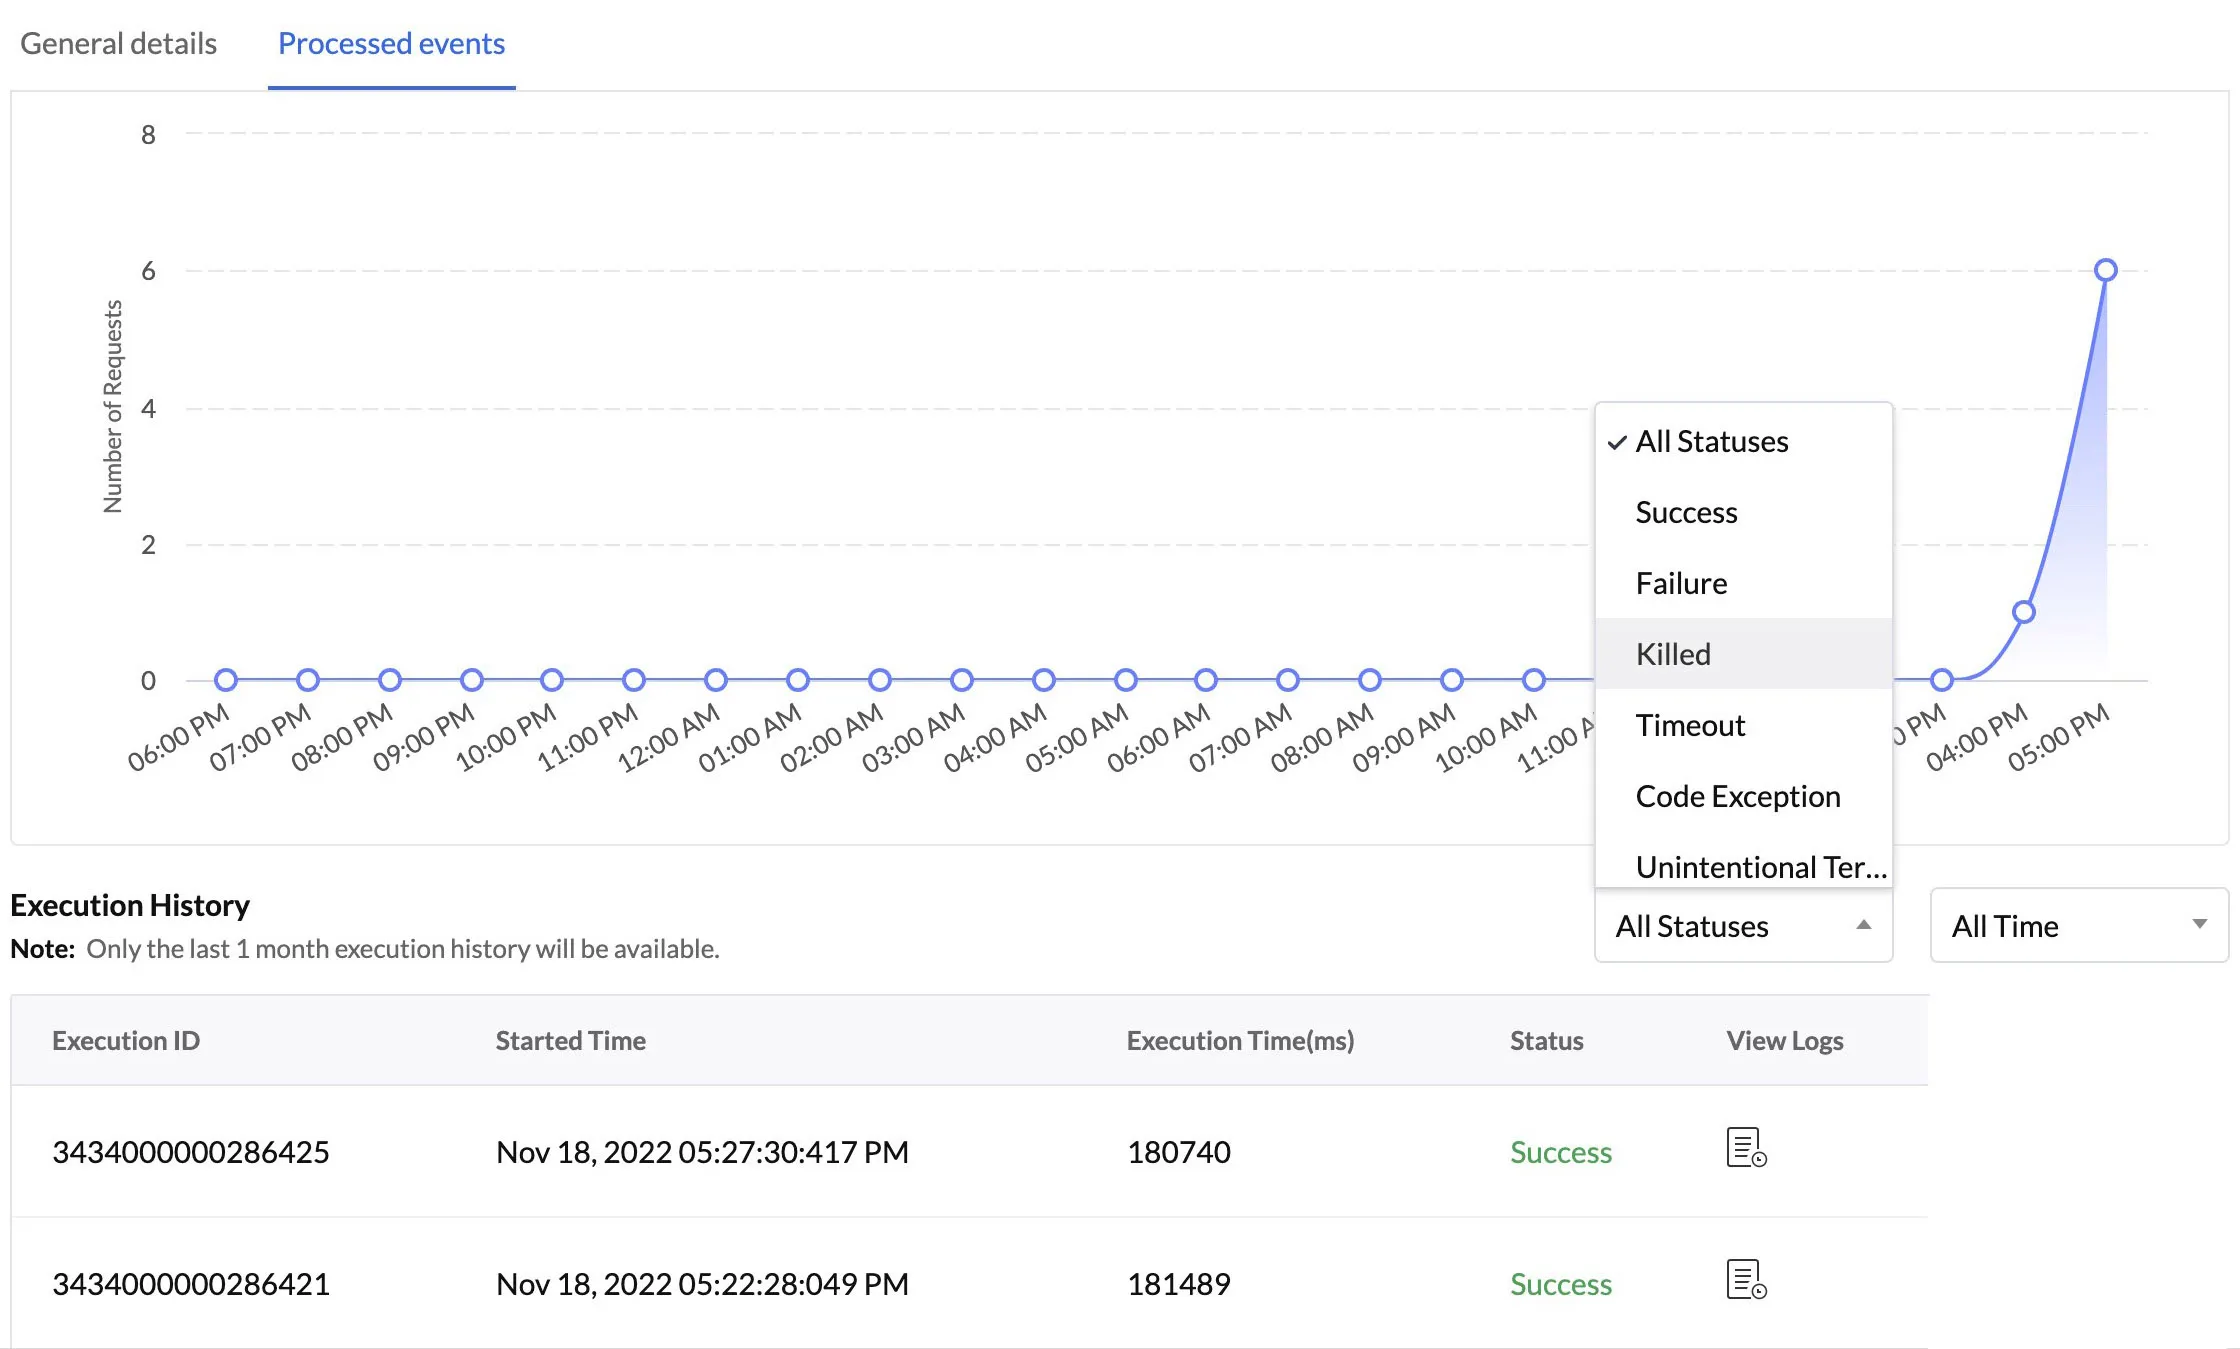
The Code Exception status displays events whose associated target functions or circuits that faced an exception in their code, and the Unintentional Termination status indicates all cases where the target point execution was terminated due to some errors.
You can also use the time filter to view the events executed in a particular time period, such as the last 1 hour or last 12 hours.
Catalyst retains the execution history of event listener rules for 3 months in the Production environment and 1 month in the Development environment. Refer to the Environments help page to learn about them.
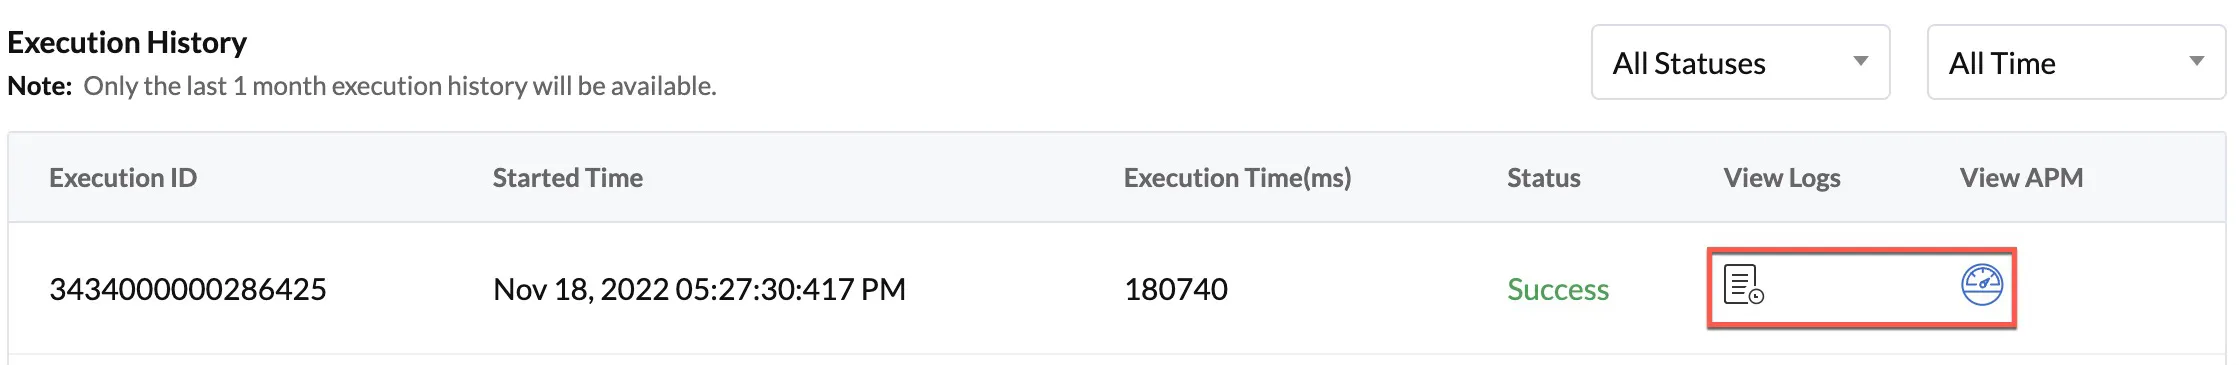
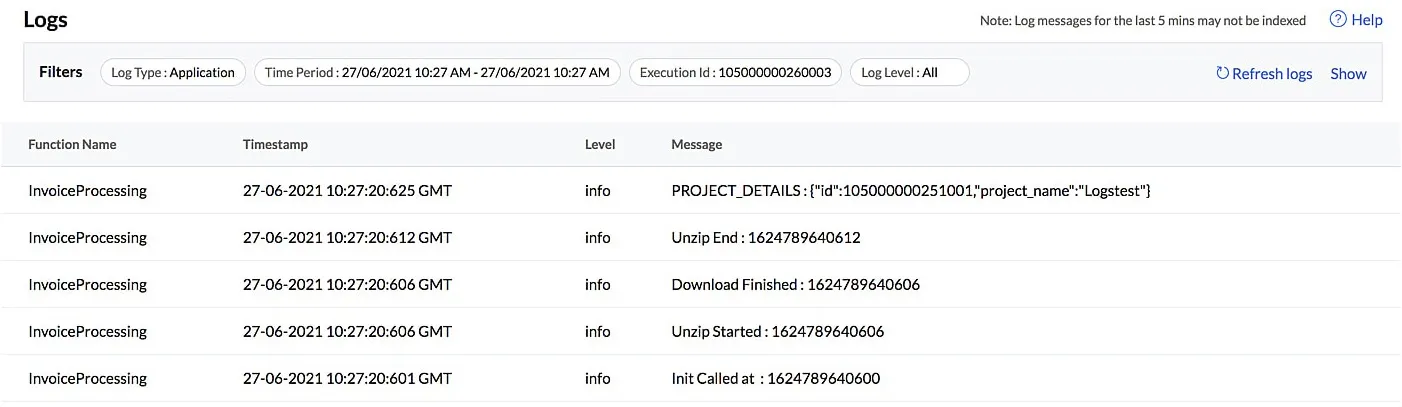
This section also contains a link to view the logs and APM of the target point executions associated with each rule. Click on the View Logs icon of any rule.
You will be navigated to the Catalyst Logs component that shows detailed information of the event function or circuit executions that were processed by that rule.
If you click on View APM, you will be navigated to the Application Performance Monitoring component, that contains detailed statistics about the target point calls, error occurrences, component usage, and more.
Last Updated 2025-06-10 14:25:30 +0530 IST
Yes
No
Send your feedback to us