Monitor Channel Activity
The Channel Dashboard provides real-time insights into your Data Streams channel’s activity, data flow, and performance metrics. Before you begin, ensure you have a channel created with data flowing through it (publishers and/or subscribers active).
Access the Dashboard
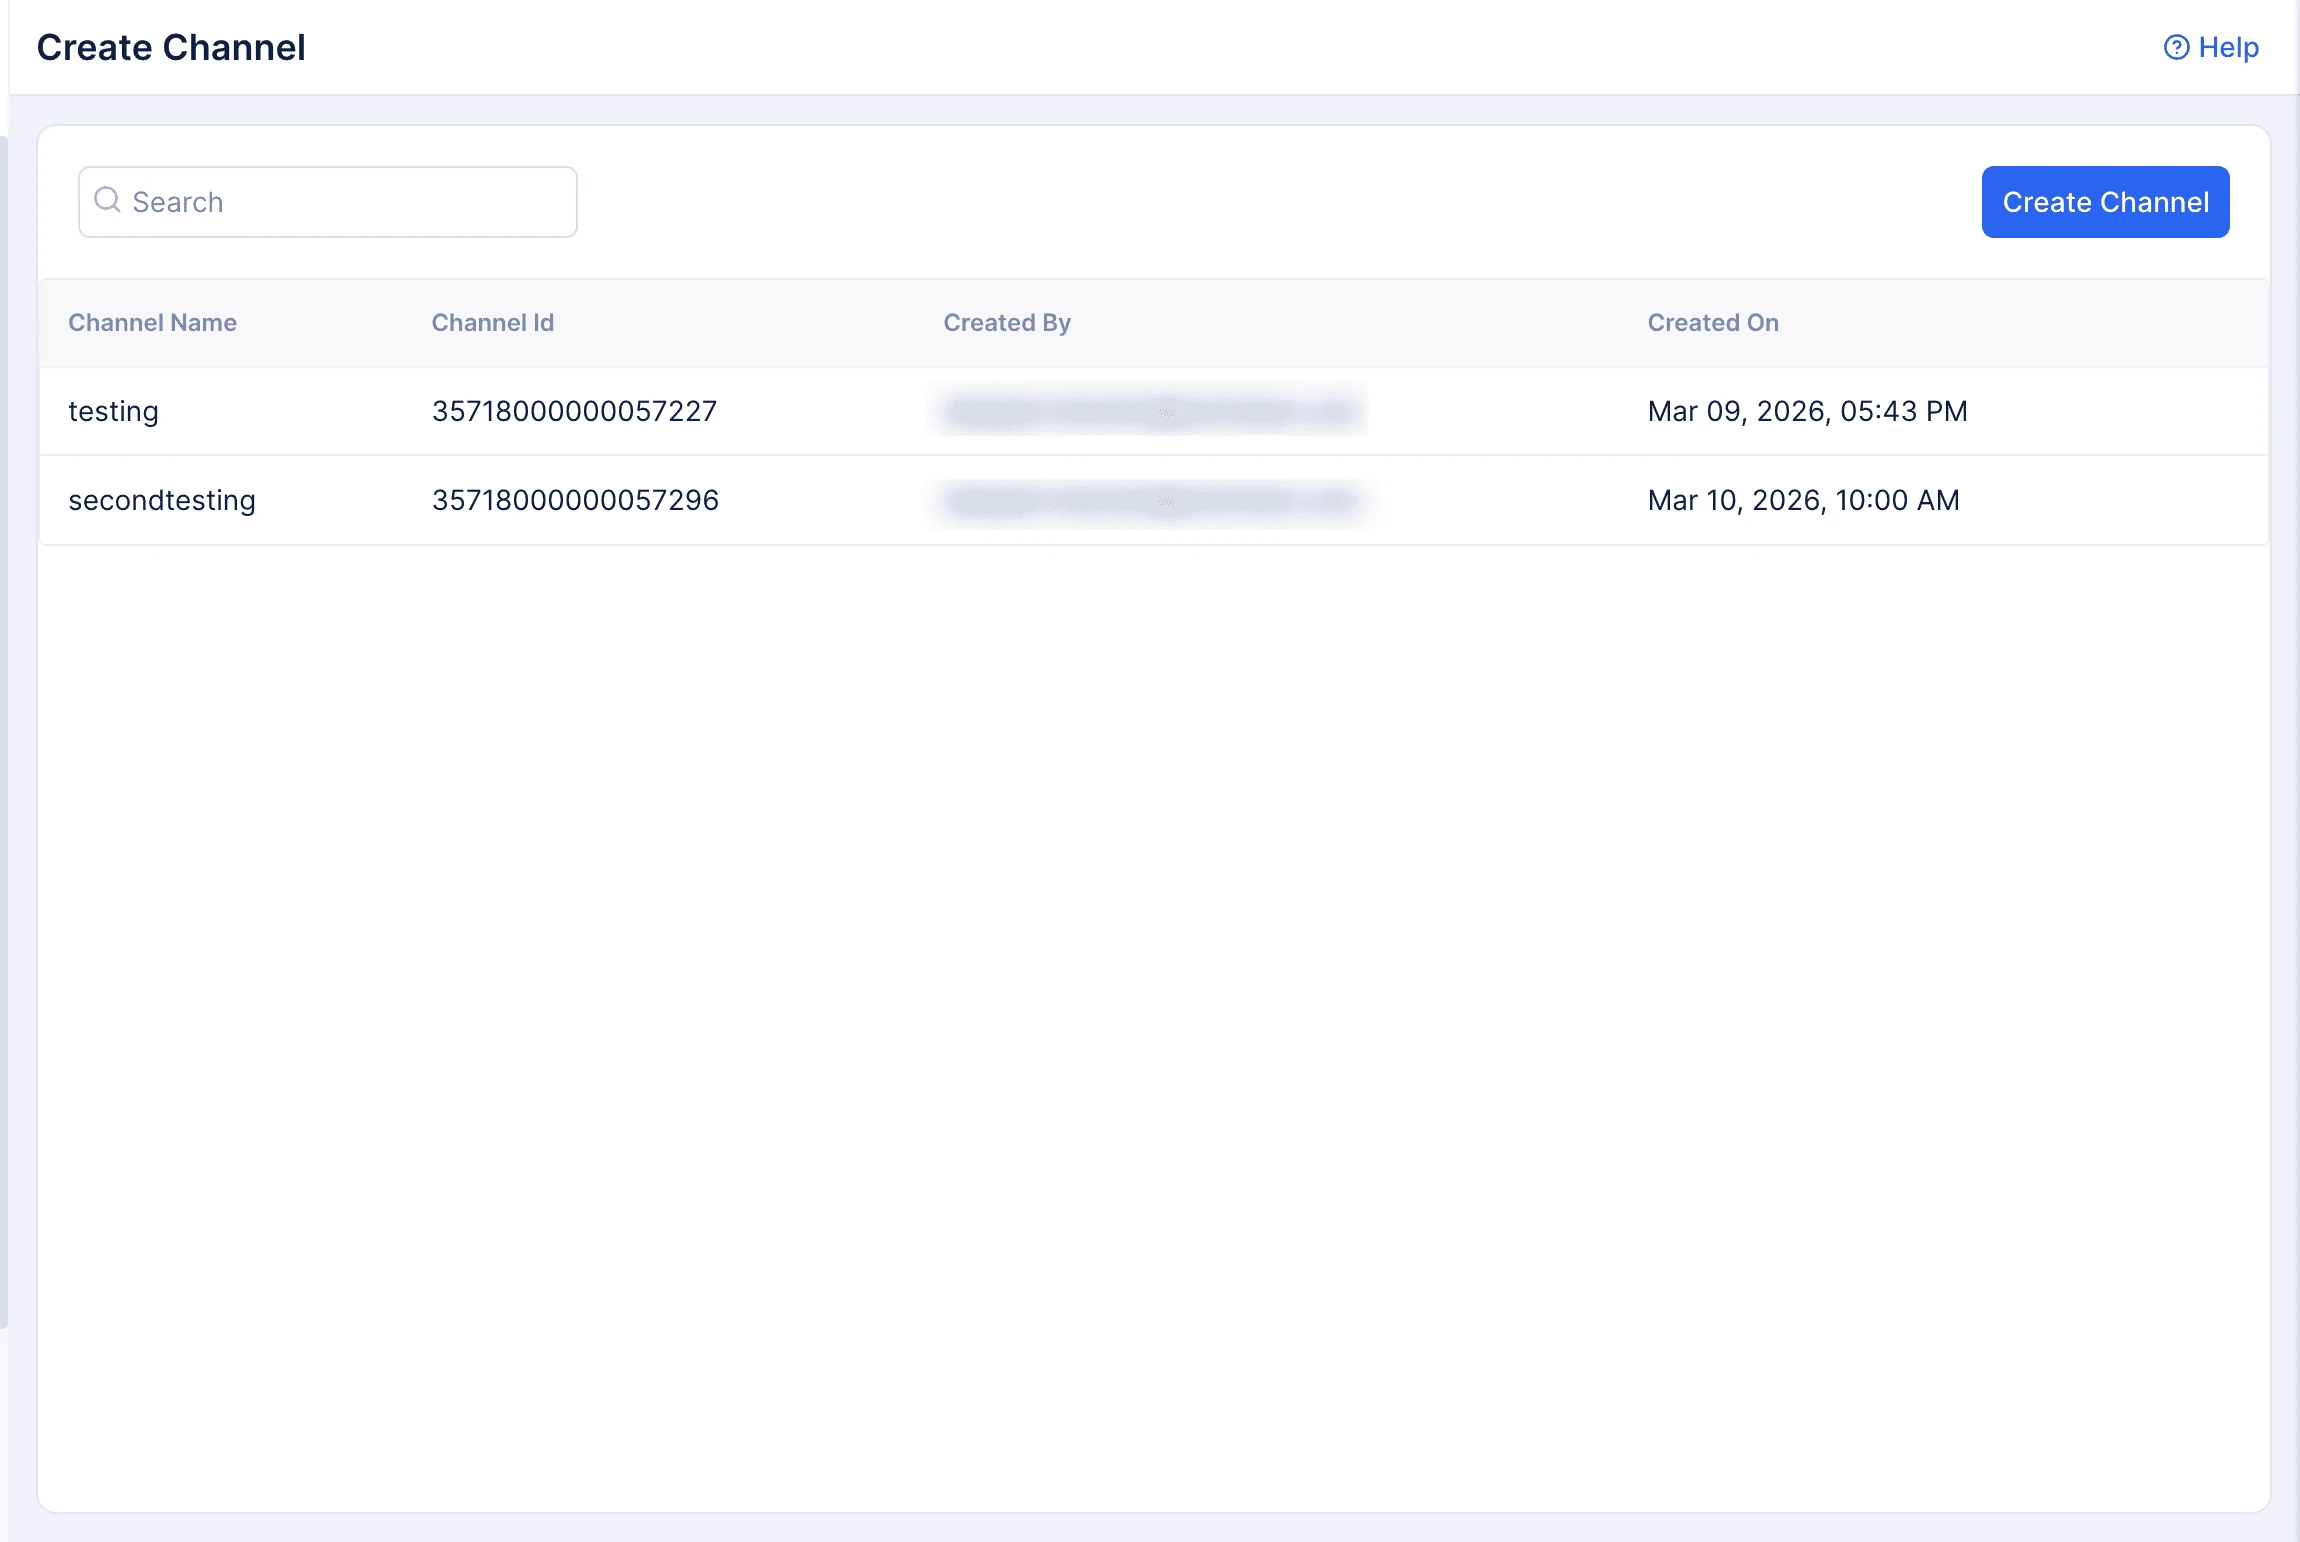
Navigate to your channel from the Channels list page. The dashboard is displayed by default when you open a channel.
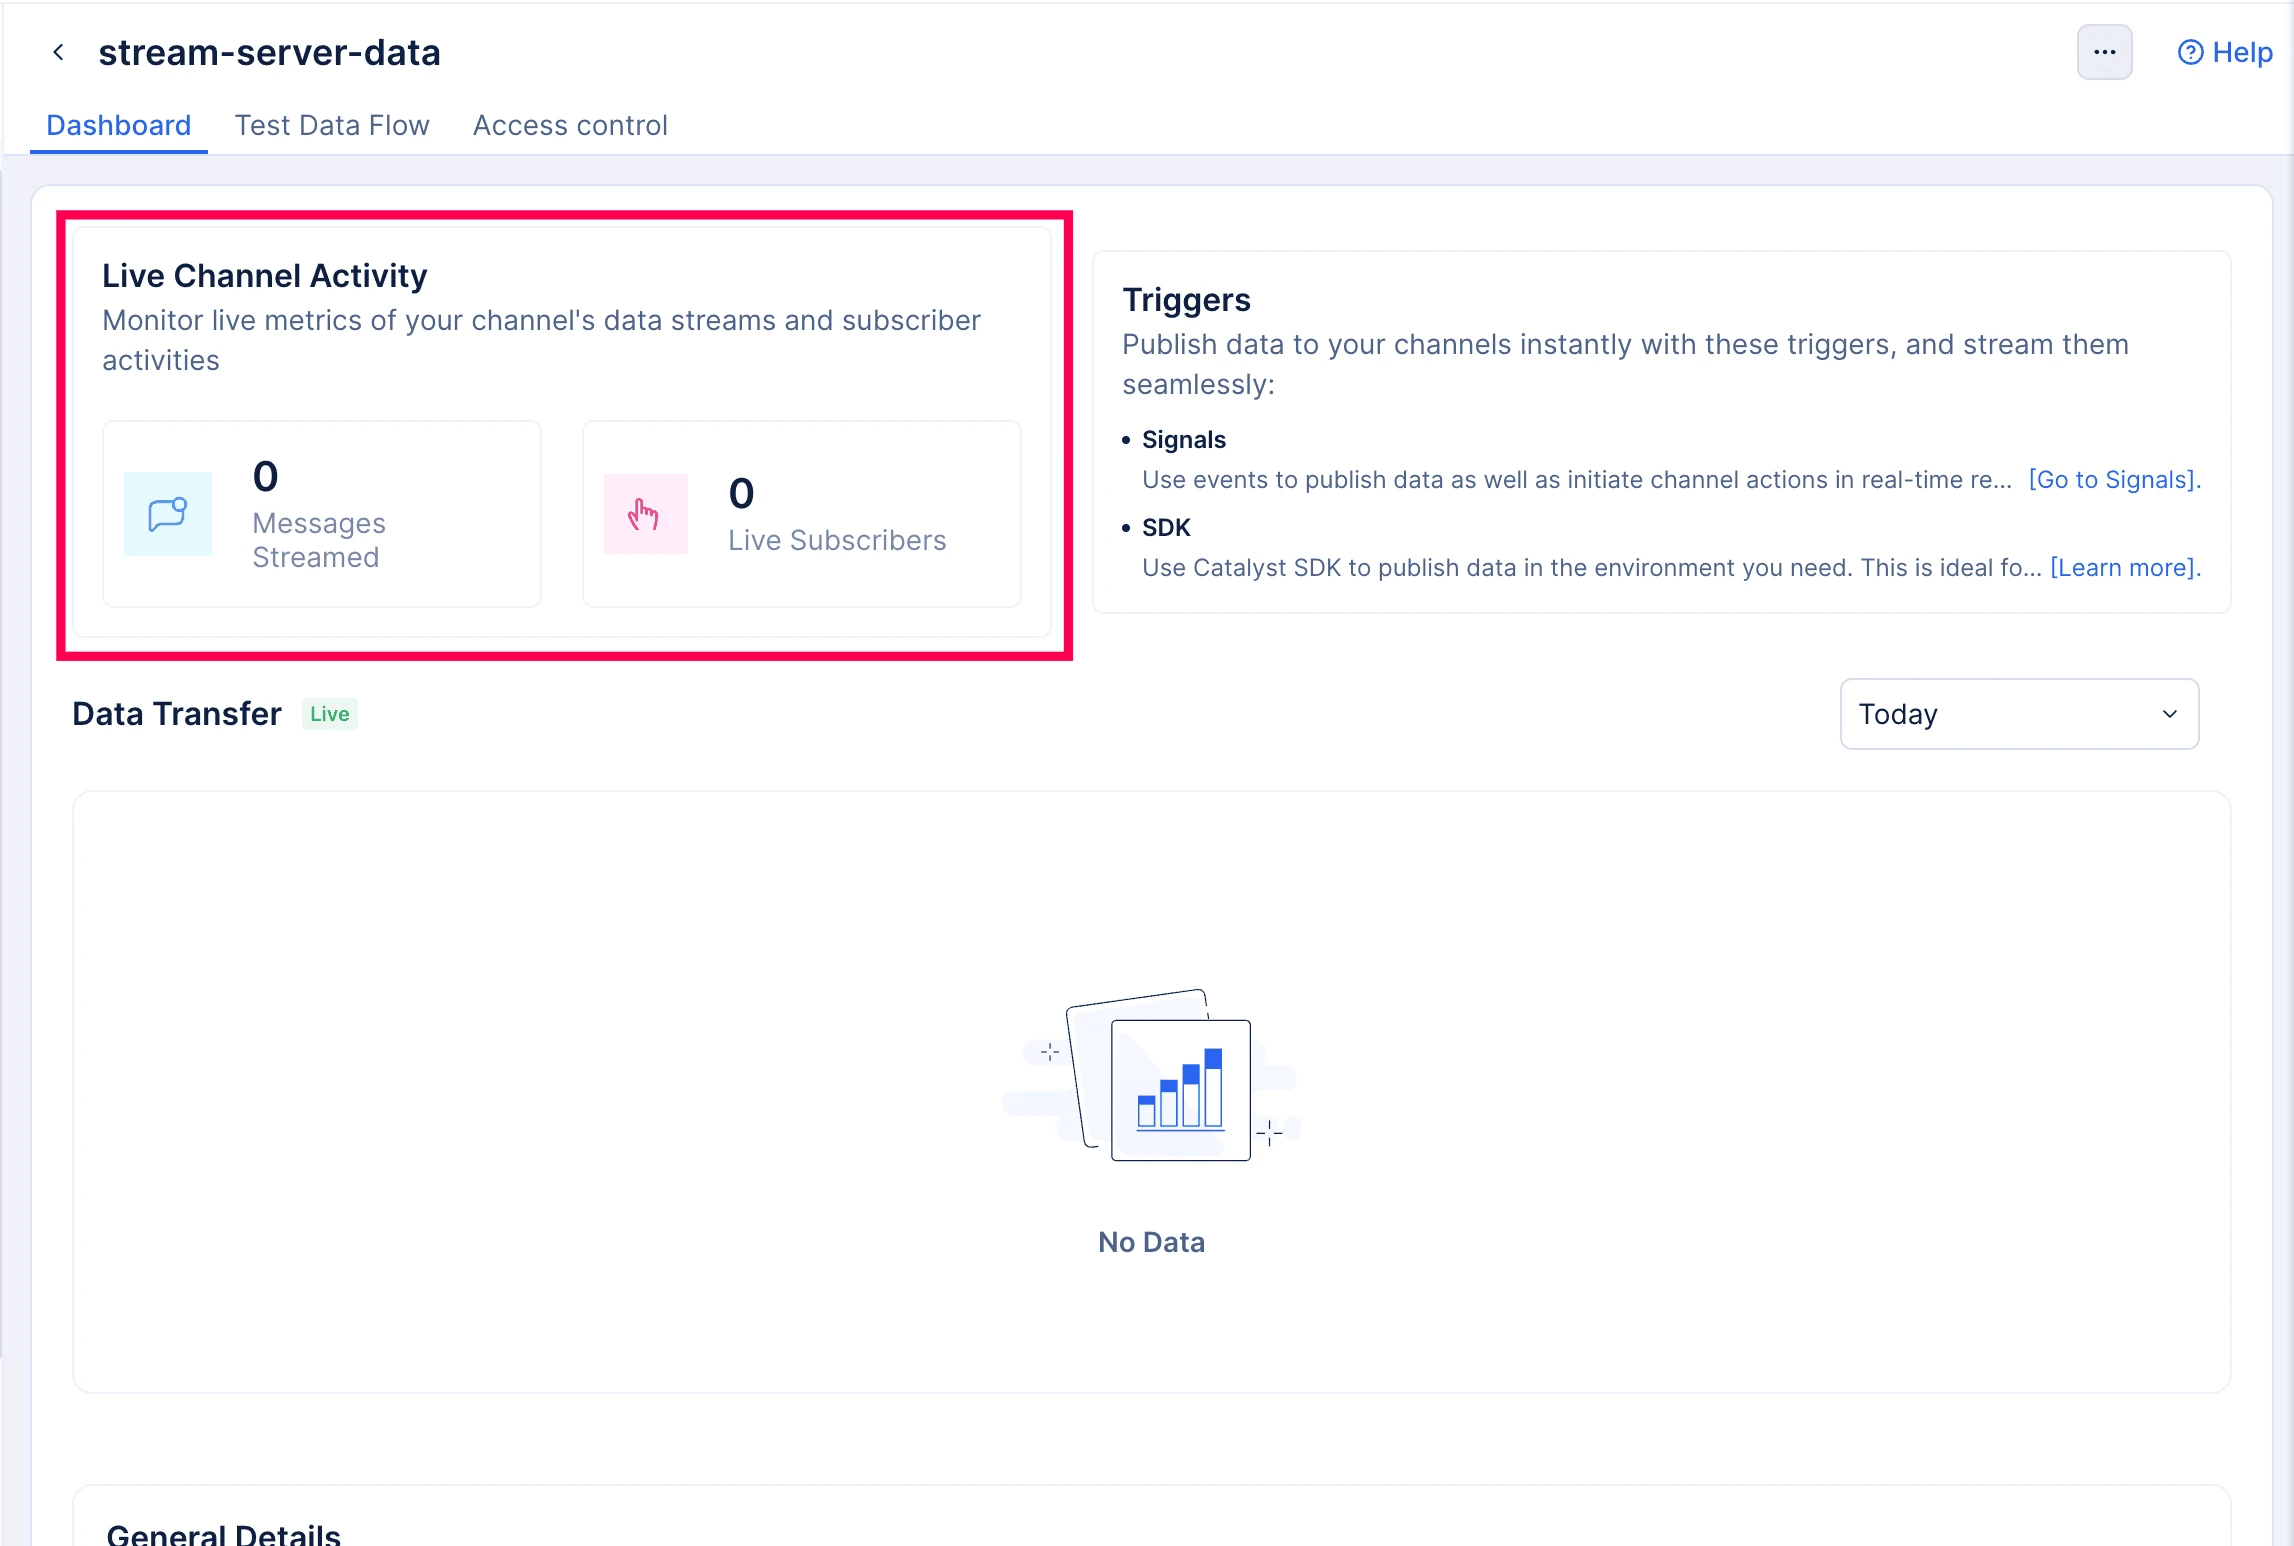
Live Channel Activity
Monitor real-time metrics to understand current channel performance.
Metrics Available
| Metric | Description |
|---|---|
| Messages Streamed | Total number of messages streamed through the channel for the day |
| Live Subscribers | Number of subscribers currently connected and actively receiving data (real-time count) |
Programmatic Access
You can retrieve the live subscriber count programmatically:
// JavaScript
const liveCount = await datastreams.getLiveCount('YOUR_CHANNEL_ID');
console.log('Live subscribers:', liveCount);
Configure Triggers
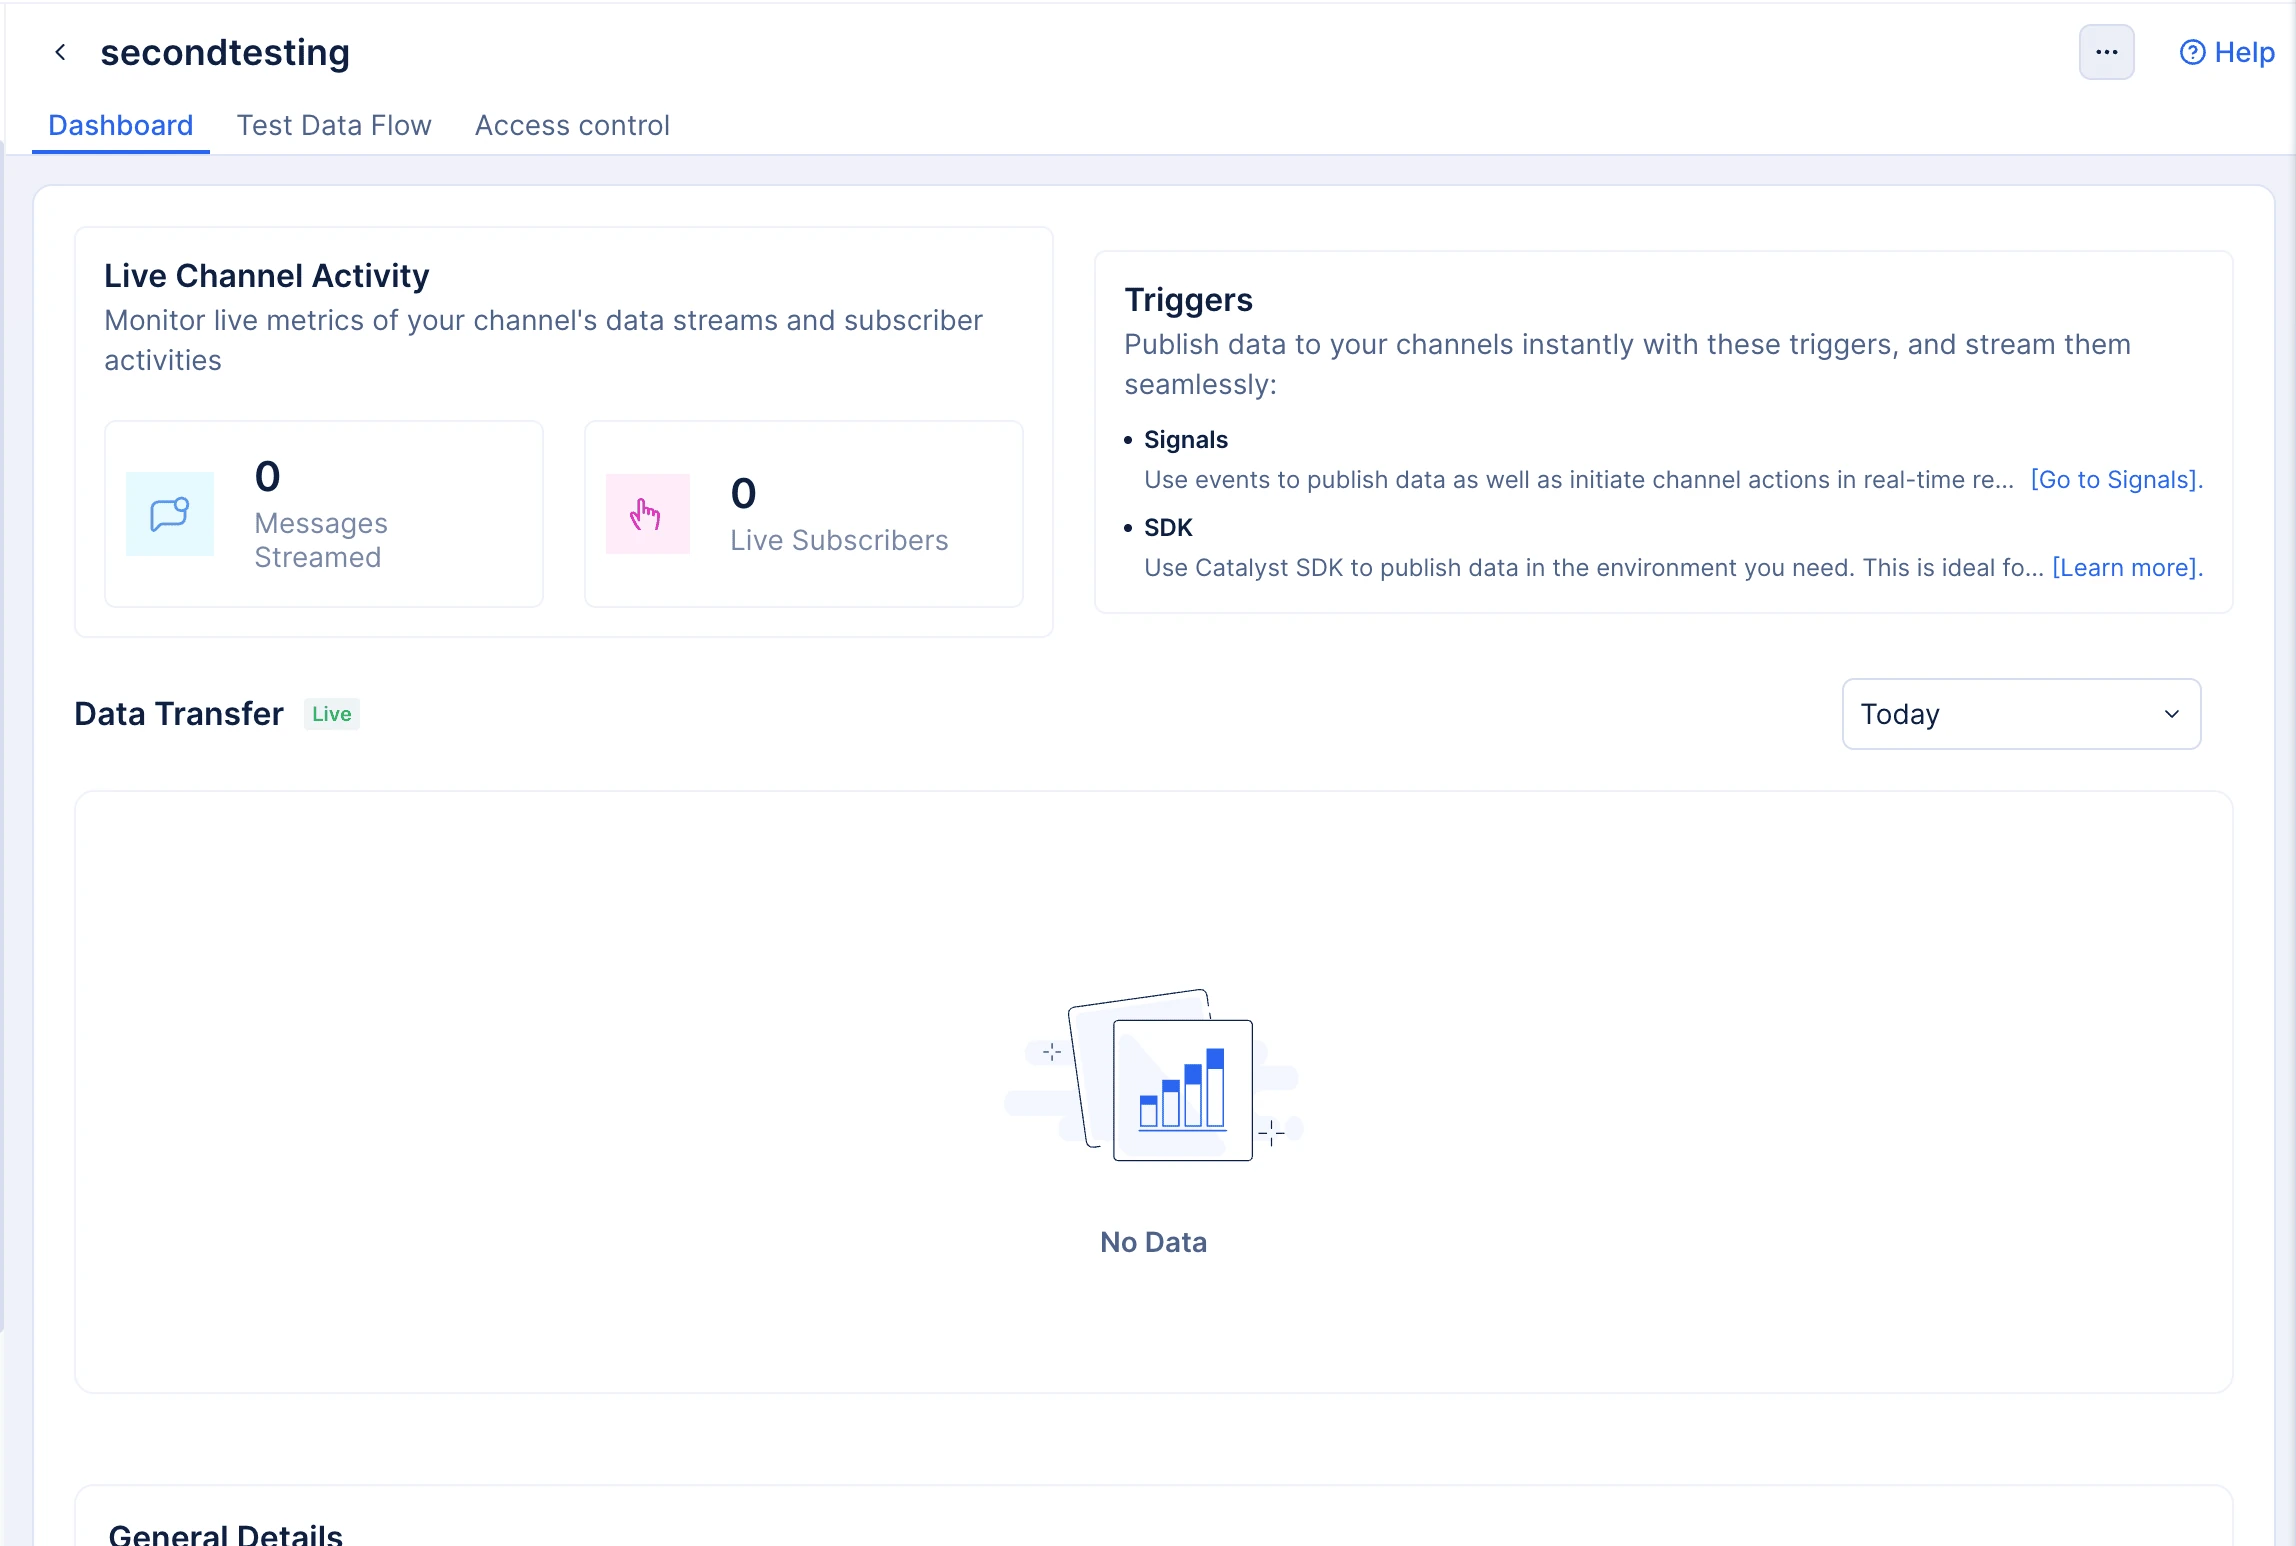
The Triggers section displays available methods for publishing data to your channel.
Available Triggers
Catalyst Signals (Event-Driven)
Use Catalyst Signals to automatically publish data when events occur in connected services:
- Zoho CRM record updates
- Data Store row insertions
- Authentication user signups
- Custom service events
To configure:
- Click Go to Signals
- Configure Signals Publishers, Rules, and Targets
- Route events to your Data Streams channel
Refer to the Publish Data with Signals guide for complete integration details.
Catalyst SDK (Manual Publishing)
Use the SDK to publish data from your application code:
- Backend services and functions
- Custom business logic
- Data processing workflows
To configure:
- Click Learn more to view publishing guide
- Implement publishing in your Advanced I/O function
Refer to the Publish Data with SDK guide for complete implementation details.
Analyze Data Transfer
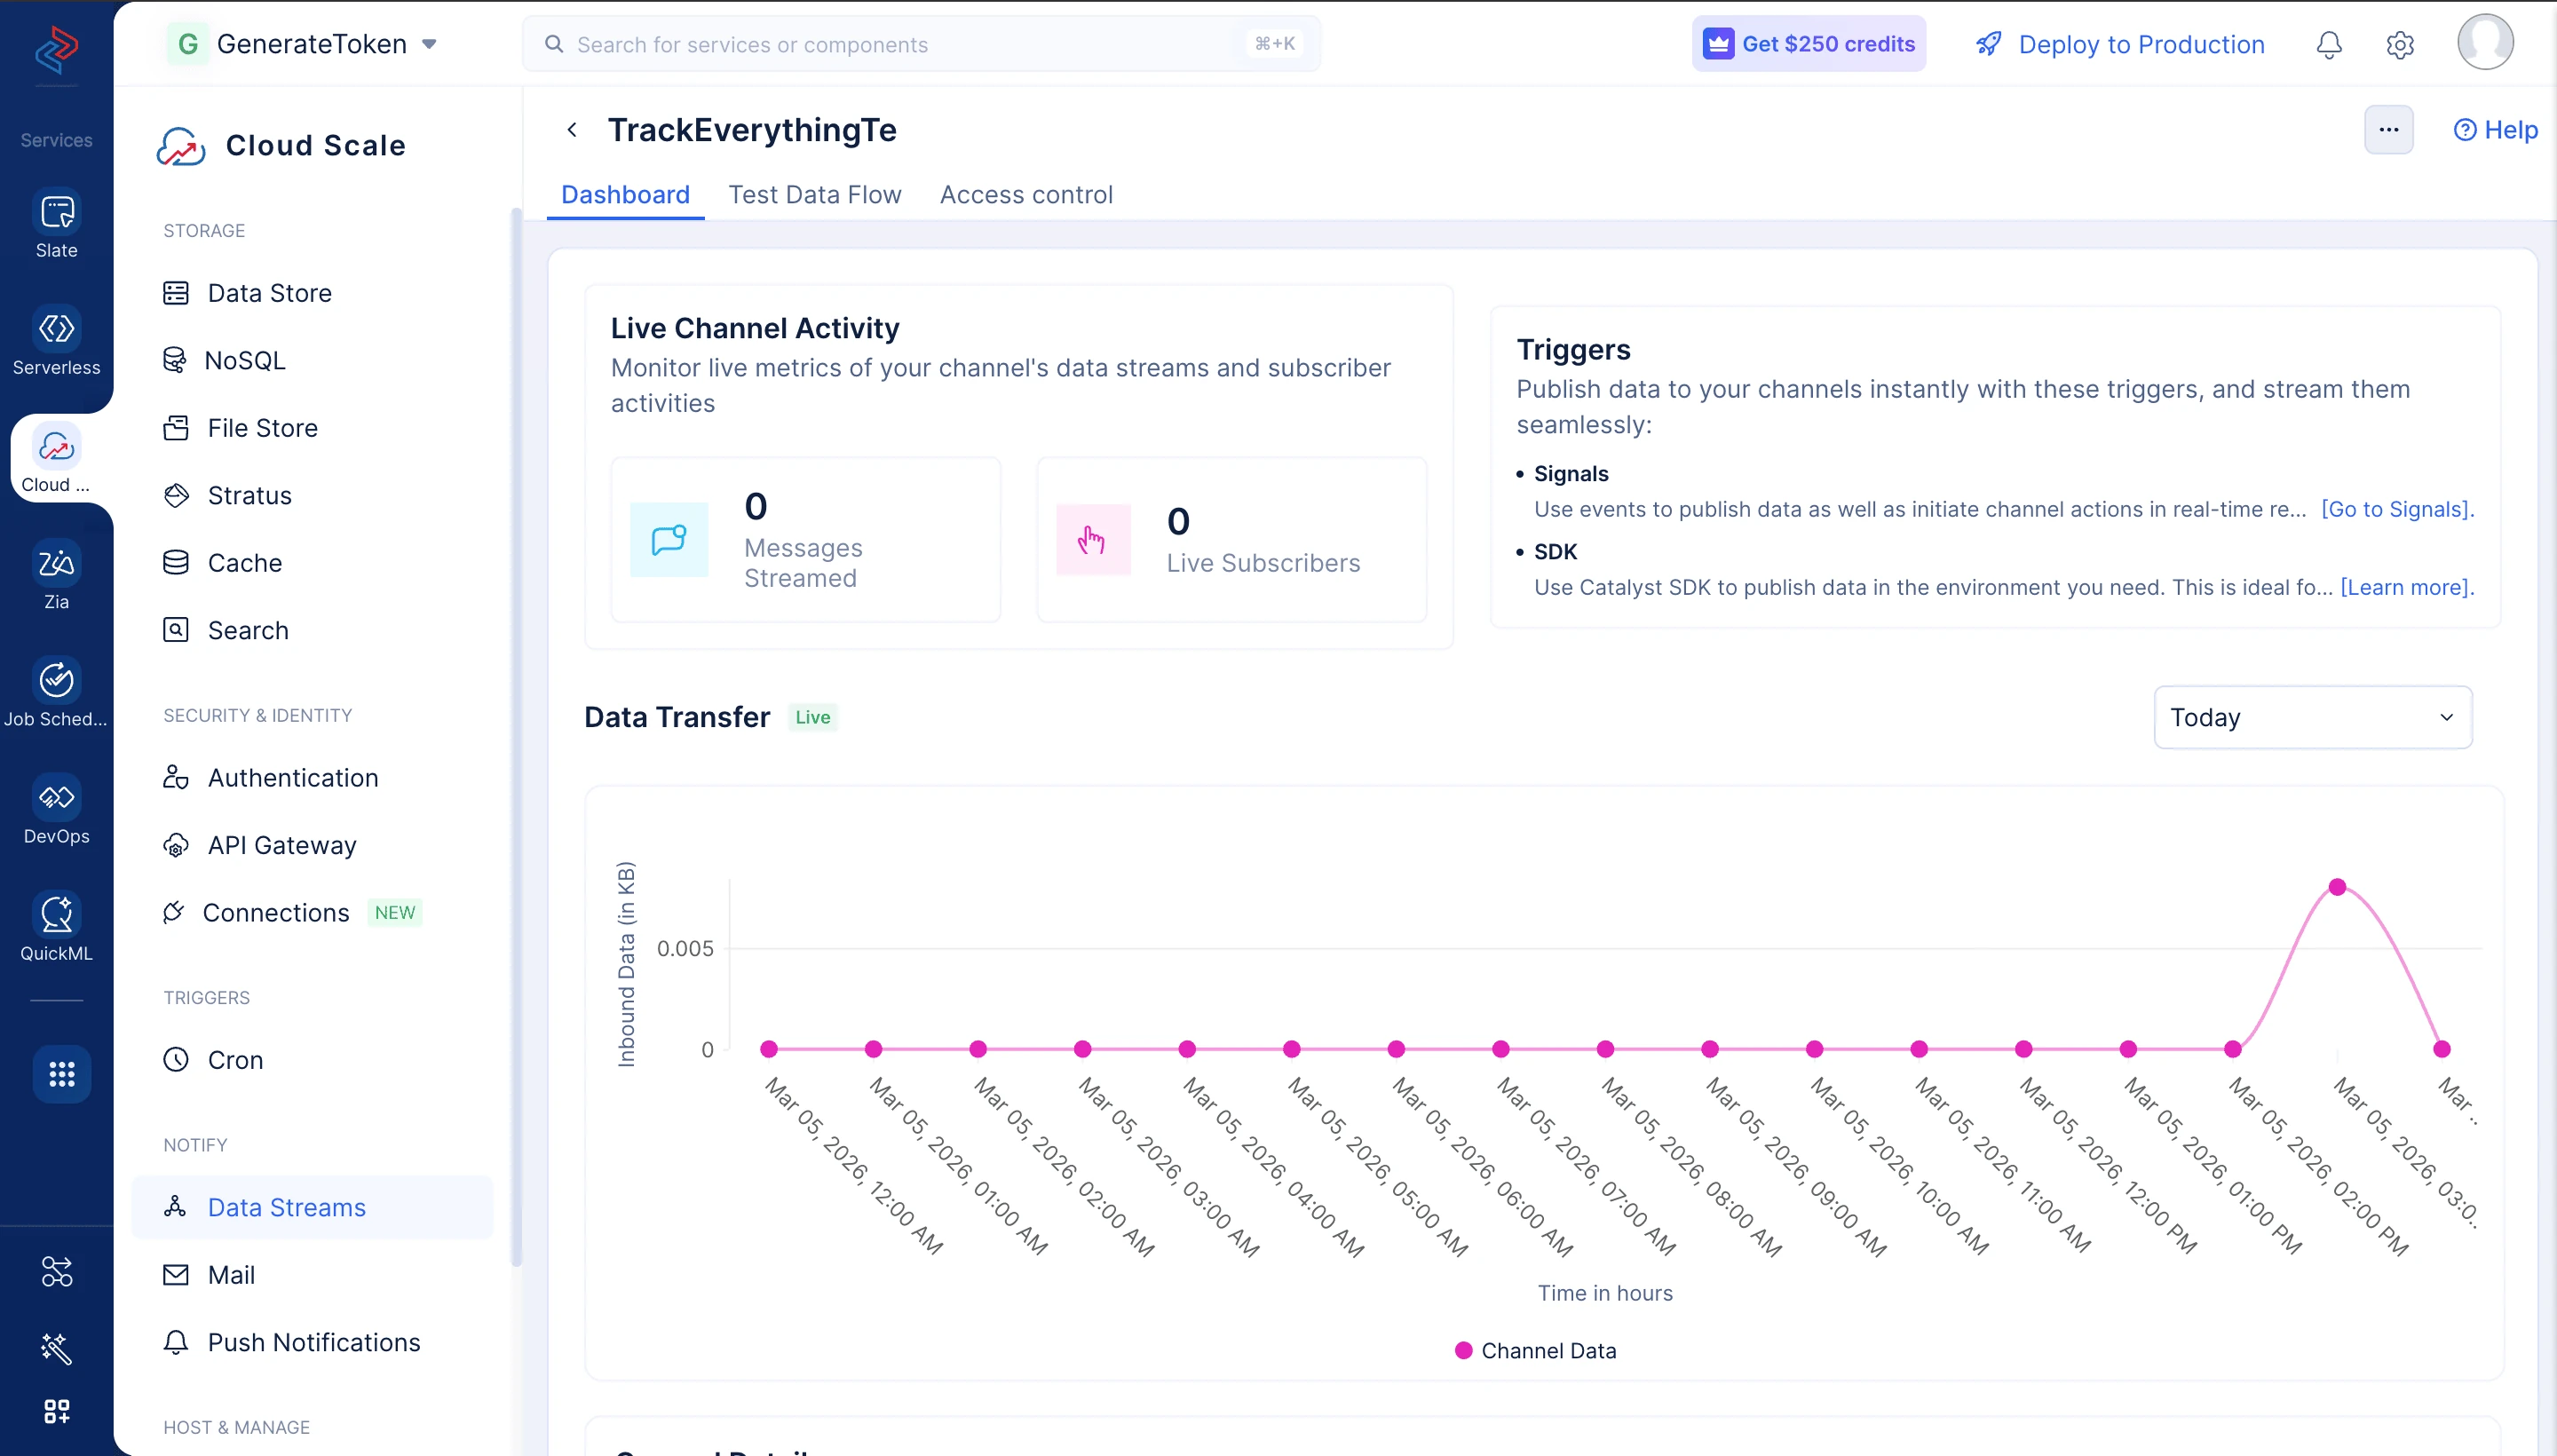
The Data Transfer section visualizes data volume over time, helping you identify usage patterns and activity spikes.
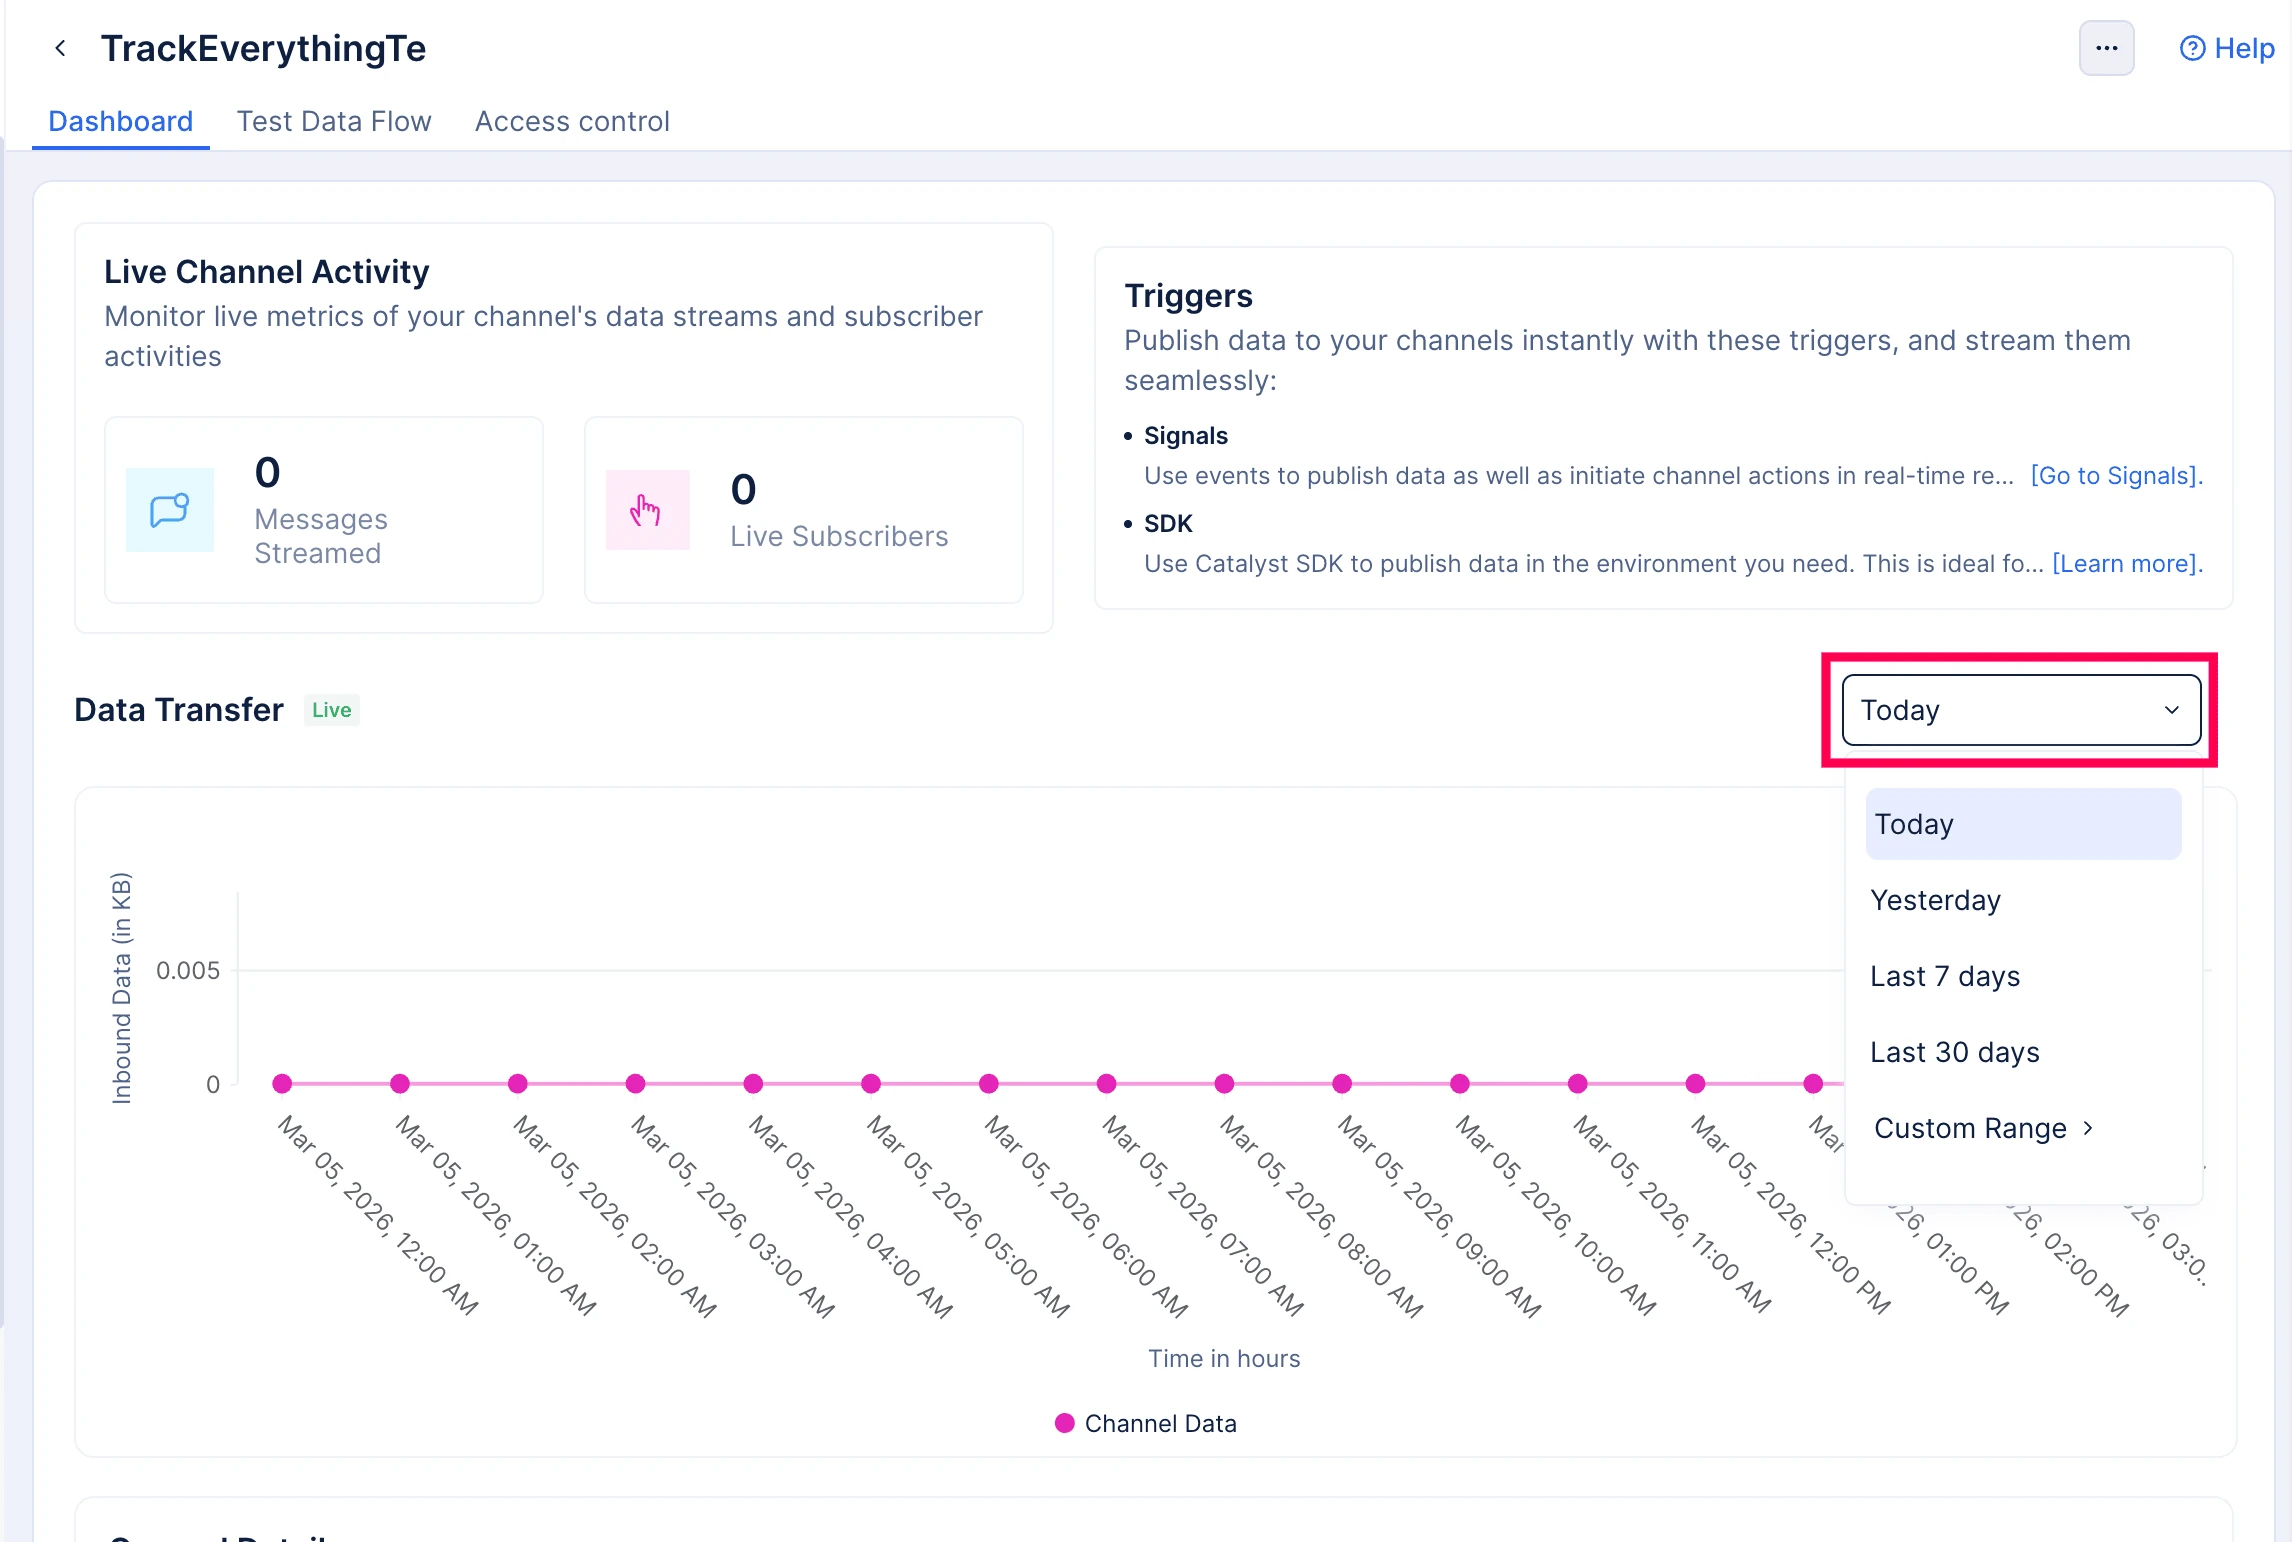
Select Time Period
Choose from preset ranges or define a custom period:
| Time Period | Range | Use Case |
|---|---|---|
| Today | 12:00:00 AM → Current time | Monitor today's activity |
| Yesterday | Previous day (12:00:00 AM → 11:59:59 PM) | Compare with today |
| Last 7 days | Rolling 7-day window | Identify weekly trends |
| Last 30 days | Rolling 30-day window | Monitor monthly patterns |
| Custom Range | Up to 2 months | Specific date analysis |
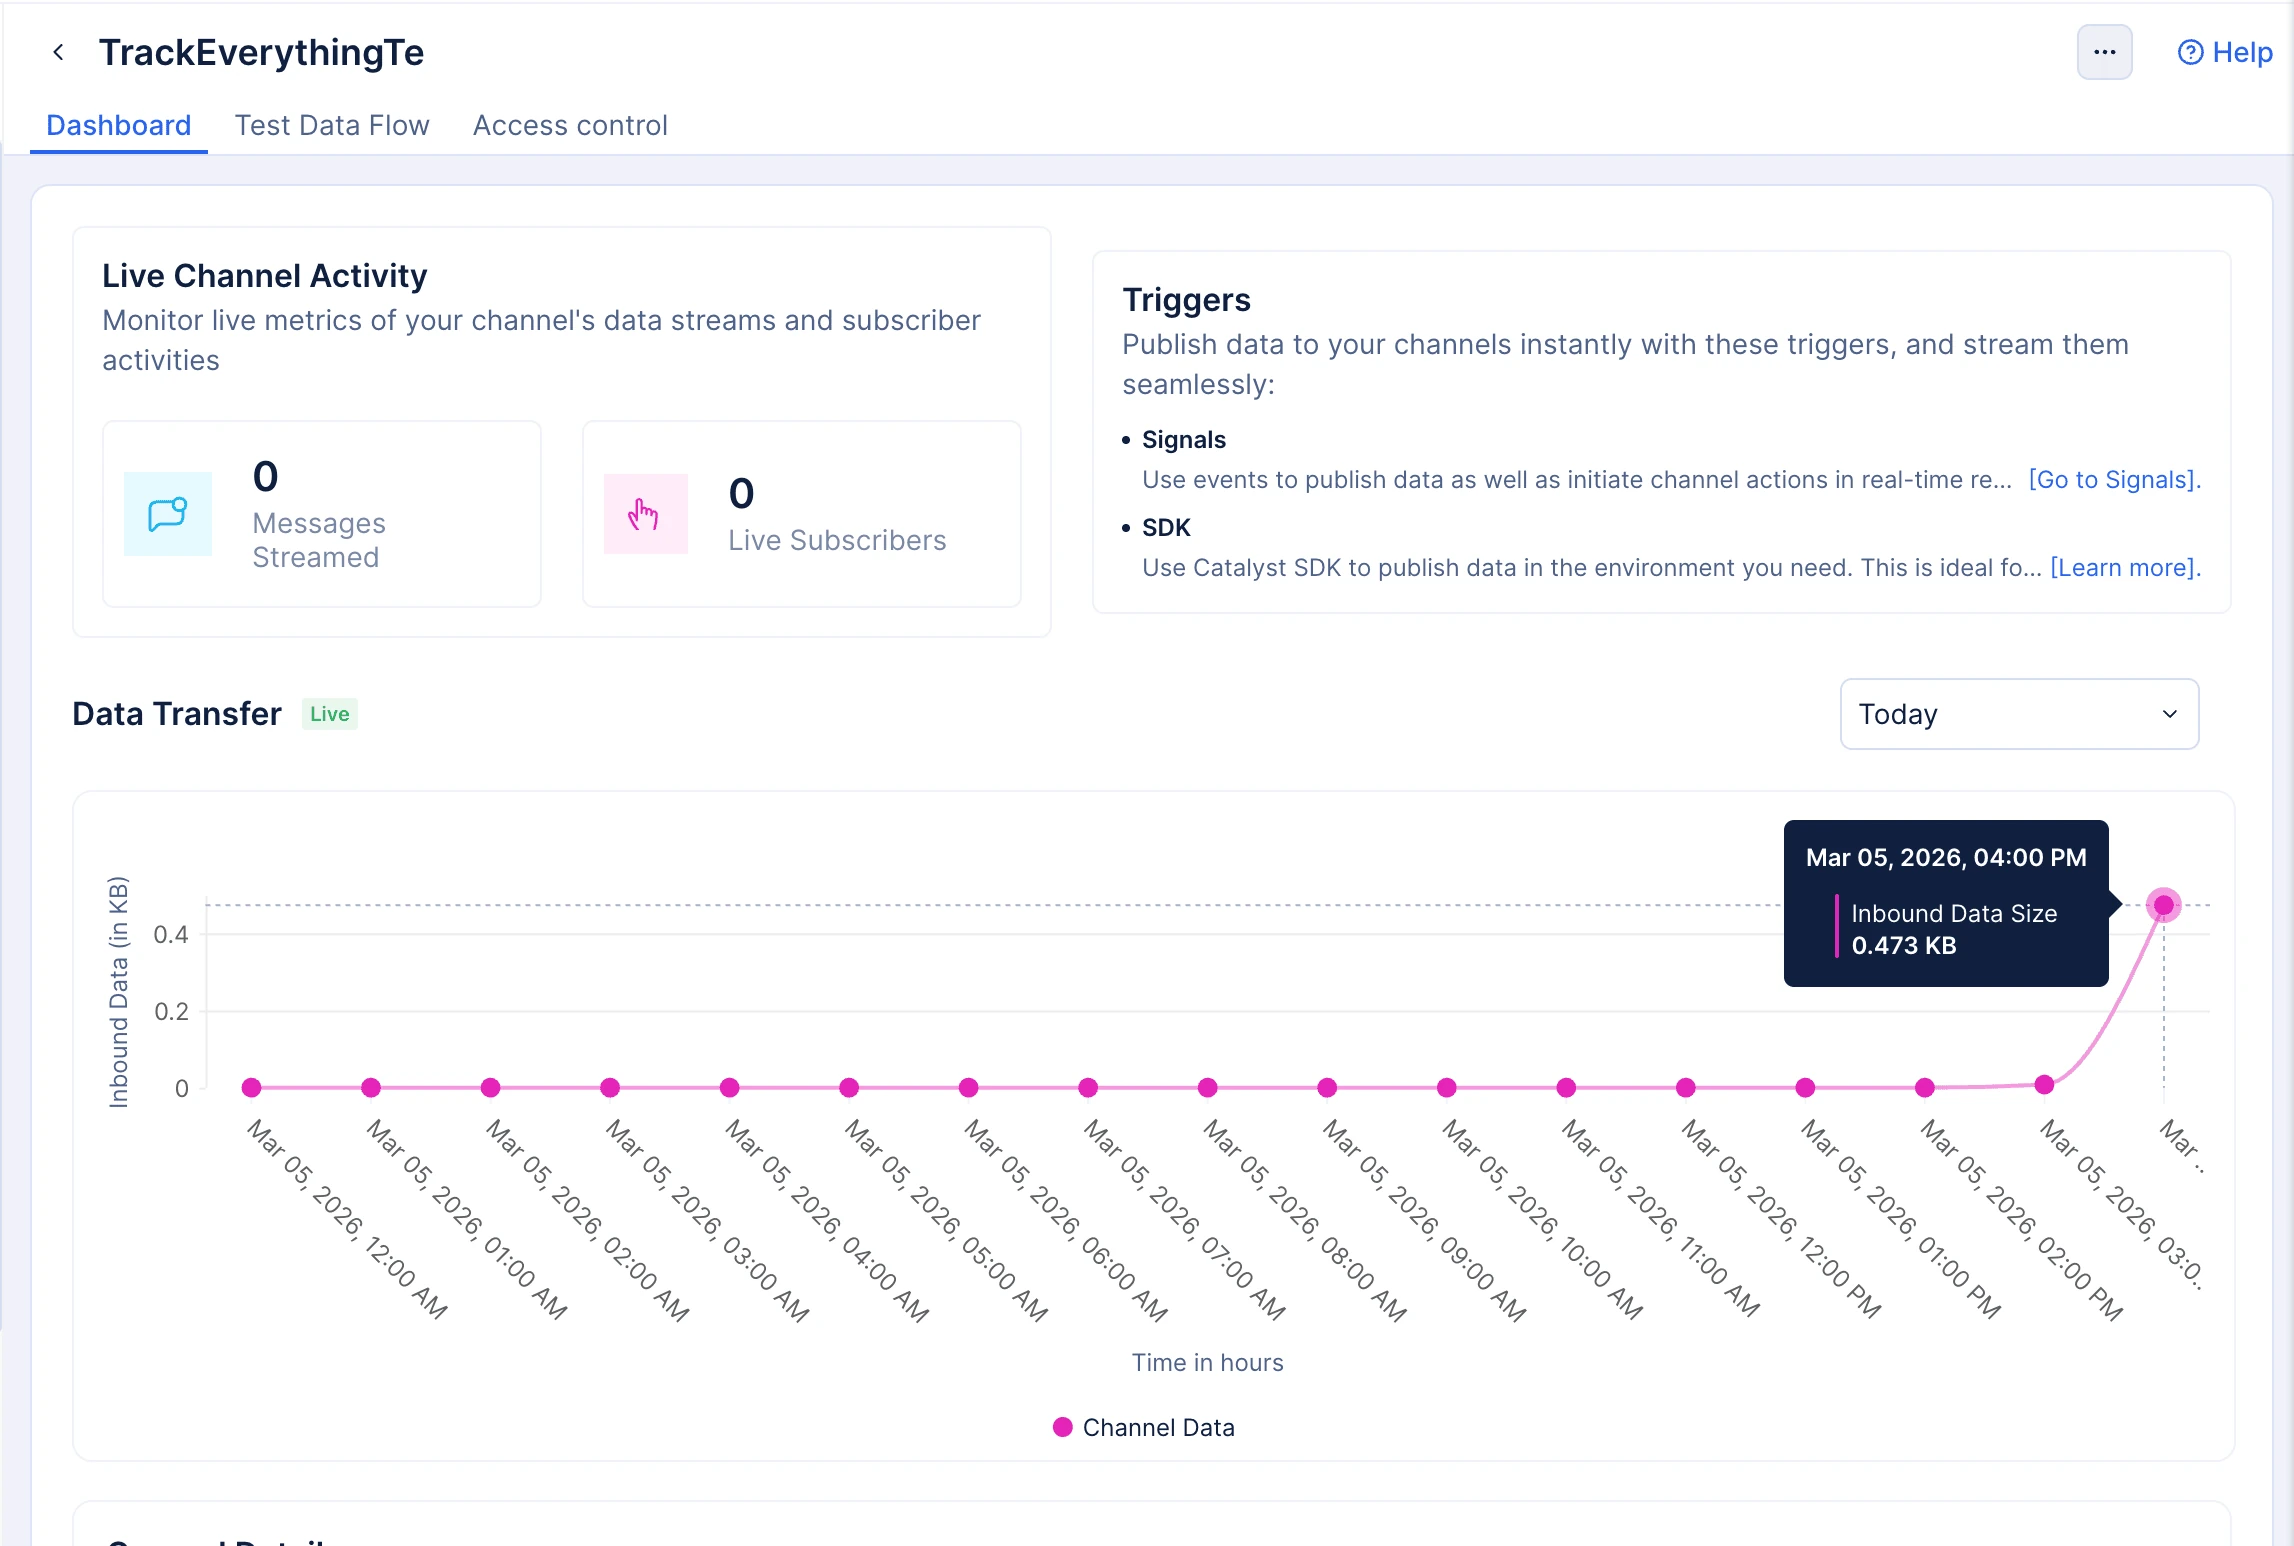
The chart displays Inbound Data Size (KB) over your selected time period. The X-axis shows time intervals, the Y-axis shows data volume in kilobytes, and you can hover over data points to view exact timestamps and data sizes.
View General Details
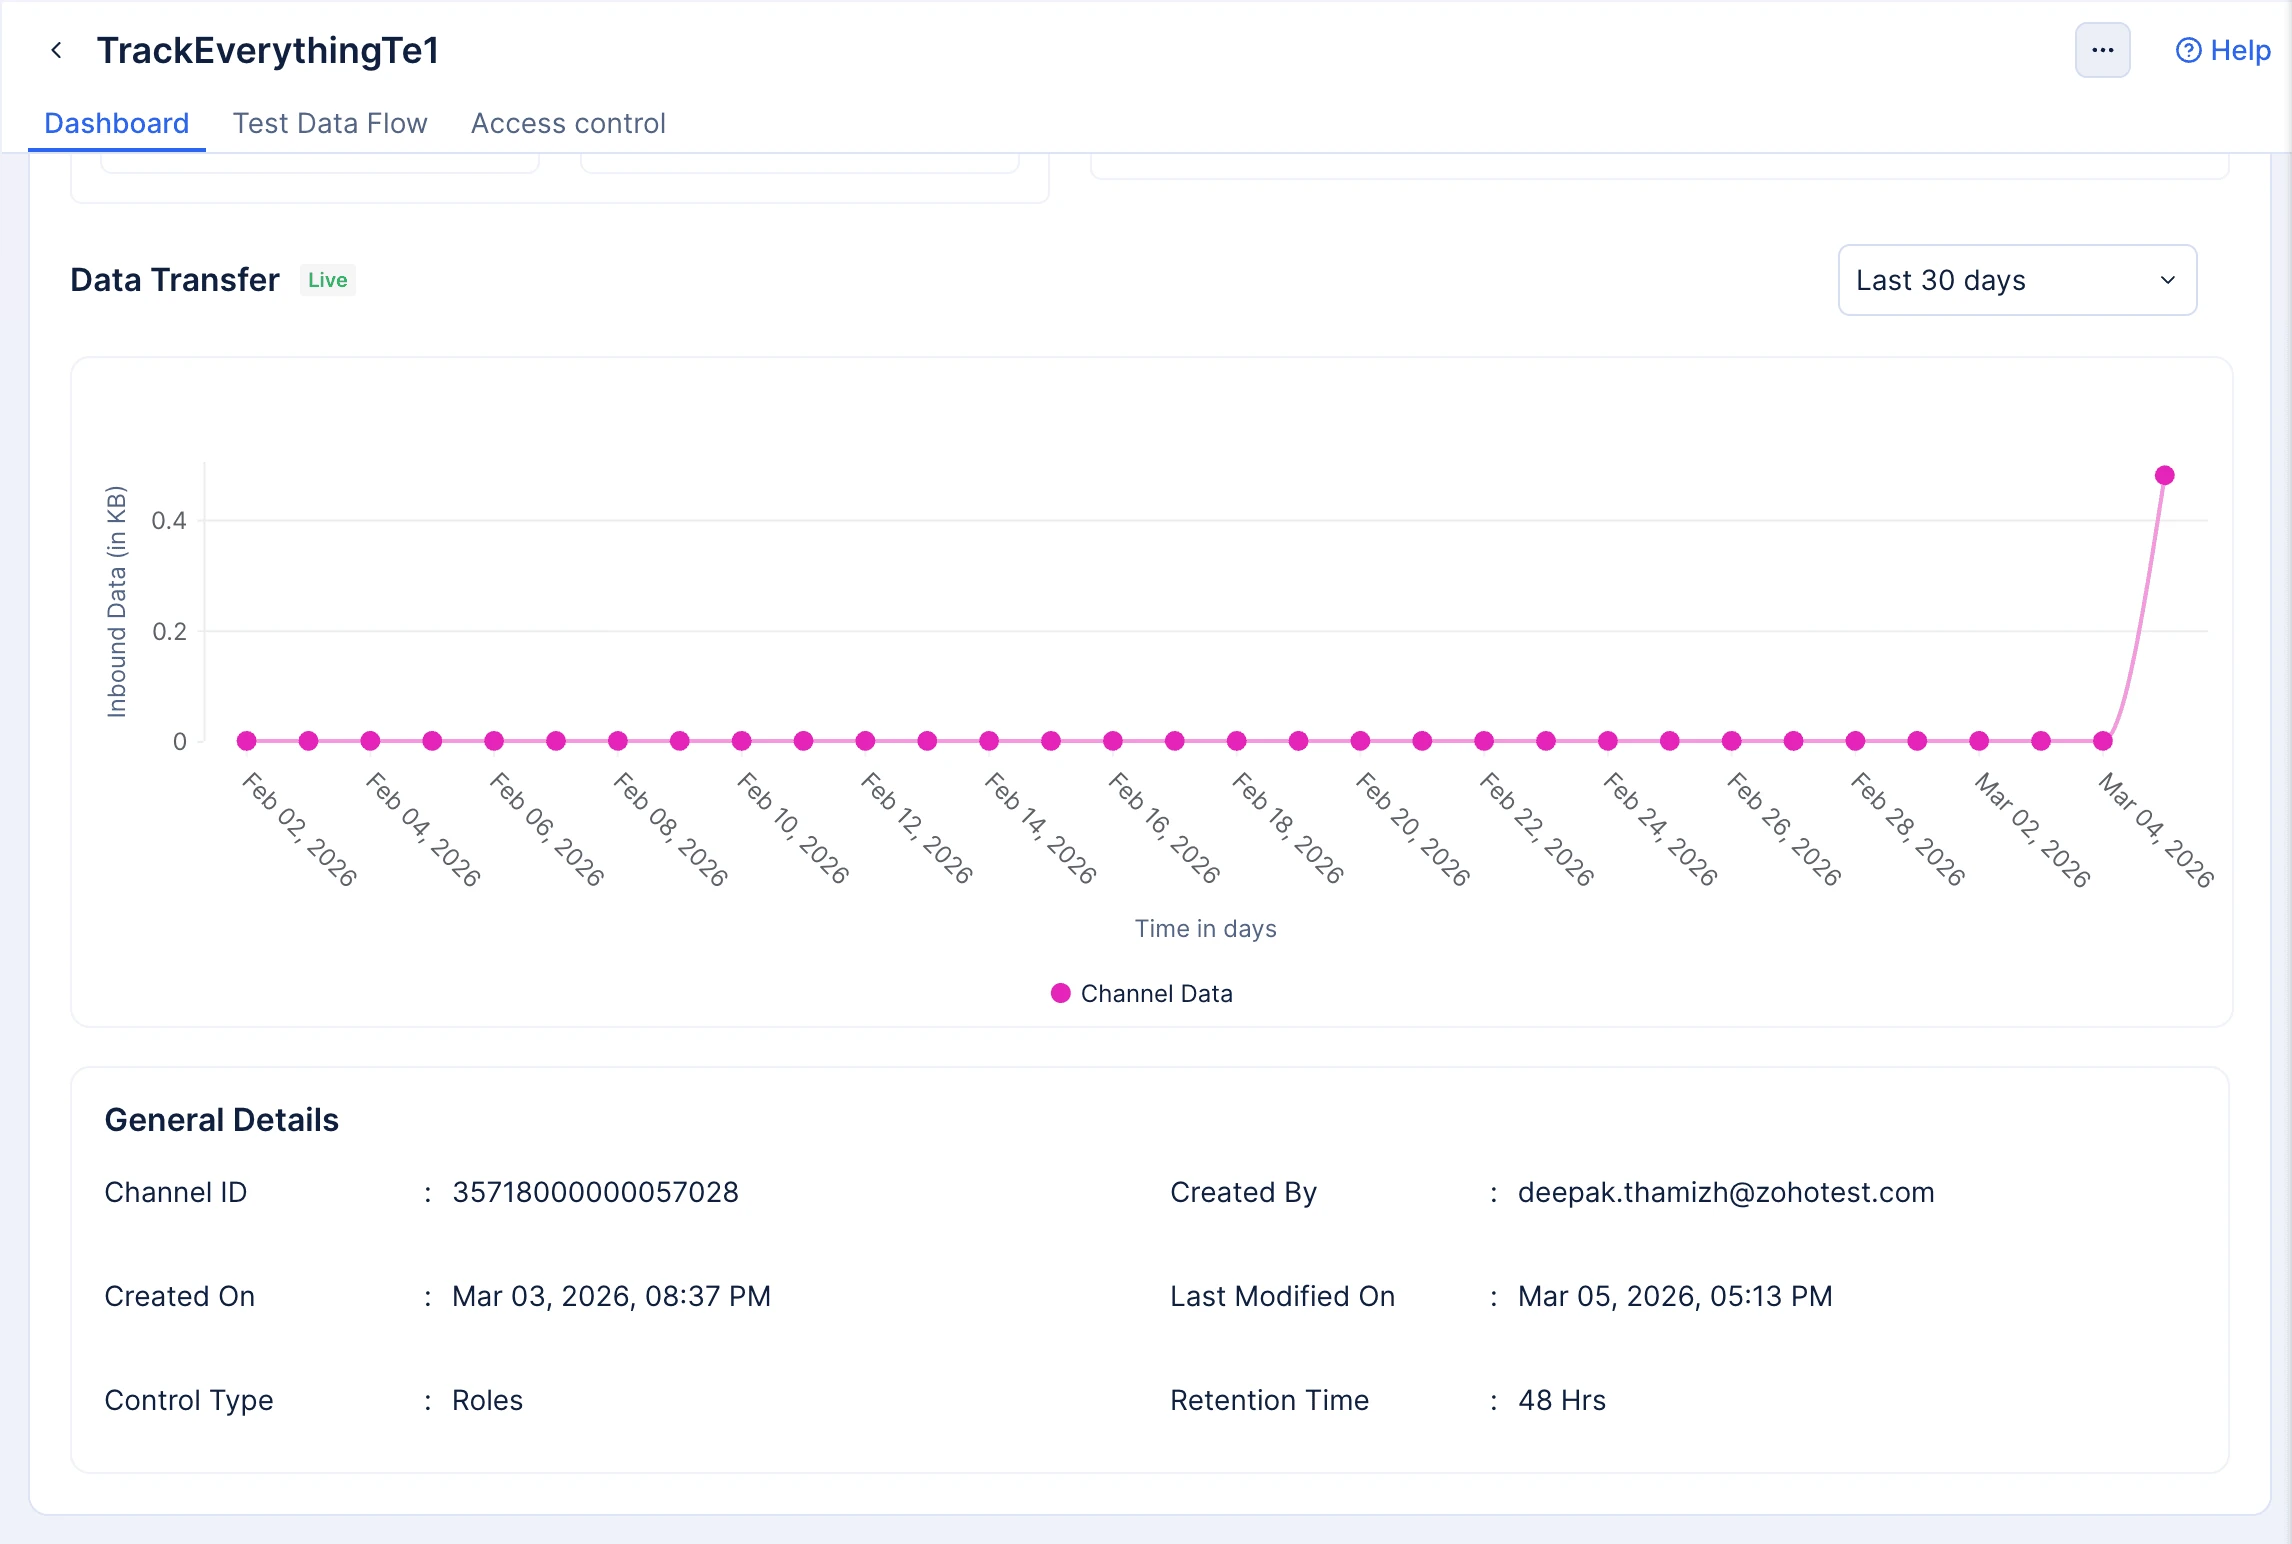
The General Details section displays channel configuration and metadata.
Available Information
| Field | Description |
|---|---|
| Channel ID | Unique identifier (required for SDK/API operations) |
| Created By | User who created the channel |
| Created On | Timestamp when the channel was created |
| Last Modified On | Timestamp of most recent configuration change |
| Control Type | Access control method (User Roles or Custom Logic) |
| Retention Time | Data retention period (48 hours) |
Data Retention Details
- Retention Period: 48 hours from publication
- Subscriber Access: Can receive events within retention period using subscriber types:
'-1'(earliest available)'-2'(resume)'<streaming-id>'(from specific point)
- After 48 Hours: Events are no longer available
Dashboard Actions
From the three-dot menu in the top-right corner:
- Edit Channel → Change channel name
- Delete Channel → Permanently remove channel
Last Updated 2026-10-08 12:04:32 +0530 IST
Yes
No
Send your feedback to us
 Ask ChatGPT
 Ask Claude
 Ask Perplexity