Launch a Shell for Functions
Introduction
The functions shell offers you the capabilities of a Node shell console combined with the efficiency of Catalyst CLI, to test and debug your functions.
Using the Catalyst CLI functions shell, you can test and debug the following types of functions of the Java, Node.js, or Python platforms in your project: Basic I/O, Cron, Event, and Integration functions.
The output of a function’s execution is fetched and displayed in the CLI in the JSON format. For a Basic I/O function, the String output is generated in the CLI, and for the other function types, the appropriate responses are fetched.
While testing a Basic I/O function of Java or Node.js stacks, you can also attach a debugger to the function’s endpoint and test its code through a local server, or enable the HTTP mode for it in the shell. This is not supported for Python functions, but you can debug a Python function independently.
Catalyst CLI also provides several other options for the functions shell that we will discuss later in this section.
Functions Shell Command Execution
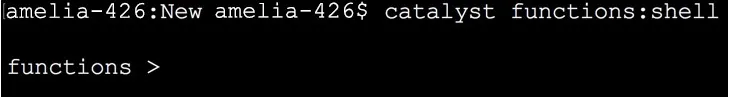
To launch a shell for testing a function, navigate to the project directory of the function and execute the following command:
This opens the shell in the CLI. You can test any function in your project other than Advanced I/O functions, pass inputs and execute it in case of a Basic I/O function, and perform other node shell operations on it.
You can pass inputs to a Basic I/O function in the shell in two ways:
- Pass values to the function variables and run the function.
- Declare a variable in the CLI, assign it to a function variable, and pass the input values through the declared variable. You can then bind the declared variable to that function and execute it.
Example for Passing Direct Input
Let’s test a simple function called EMI , which allows you to pass an input value for a variable called principal . This function then calculates the EMI amount for a shipment service, based on some pre-defined constant values.
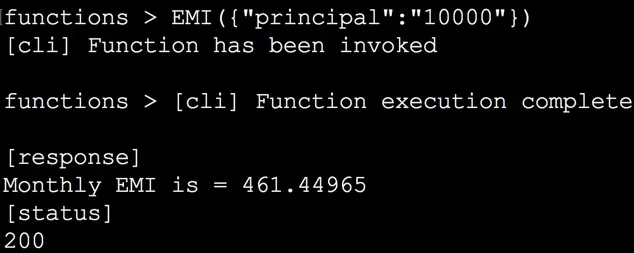
We pass a value for the input variable and execute the EMI function in the shell by entering the following statement:
This invokes the function EMI and passes the input to its variable. Once the function execution is complete, the output is obtained from the server as a JSON response. The CLI displays the function’s output along with the HTTP status code as sent by the server.
Example for Declaring a Variable and Binding it
You can also declare a variable in the CLI and assign it to the variable in the function. This will allow you to use the declared variable in the place of the function’s variable and pass input values to it easily.
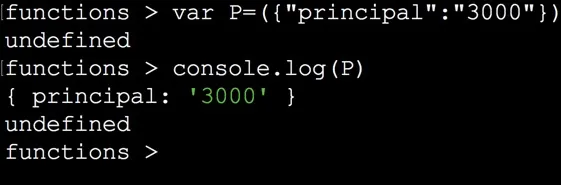
Let’s declare a variable ‘P’, assign it to the principal variable in the EMI function, and pass an input value. This can be done by executing the following command in the shell:
This assigns P to principal and passes the input value of 3000 to P. You can verify if the variable is assigned by printing the value of P in the console.
This can be done using the Node.js function console.log() in the following manner:
If the variable was assigned and the value was passed successfully, the shell will print the value of principal that was passed.
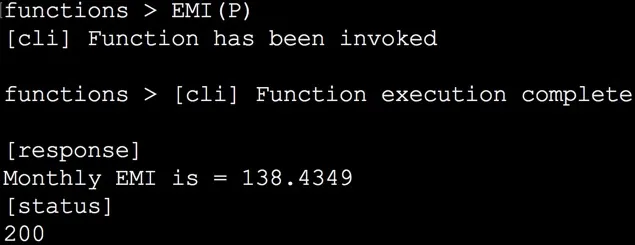
You can now bind the declared variable to the function and execute it as follows:
This invokes the function and passes the input to its variable through P . Once the function execution is complete, the CLI will display the output along with the HTTP status code as sent by the server.
The CLI will return the appropriate HTTP response codes from the server if runtime errors occur.
Exit Shell
You can exit the functions shell by killing the terminal command based on your local environment or by executing the following command:
Once your function is tested thoroughly, you can deploy the function from the local environment to the remote console.
Functions Shell Options
There are four options that you can use with the functions shell launch command.
--http [port]
The --http option invokes your Basic I/O function in the HTTP mode. The CLI serves your function through a local host, and provides you the access to its local endpoint. The server will be listening to the port where the function is hosted locally, and the CLI will display a live log of the activities at the port. The CLI will then open the functions shell where you can test your function.
This option is similar to the functionality of the catalyst serve command that serves Basic I/O functions, Advanced I/O functions, and the client components locally.
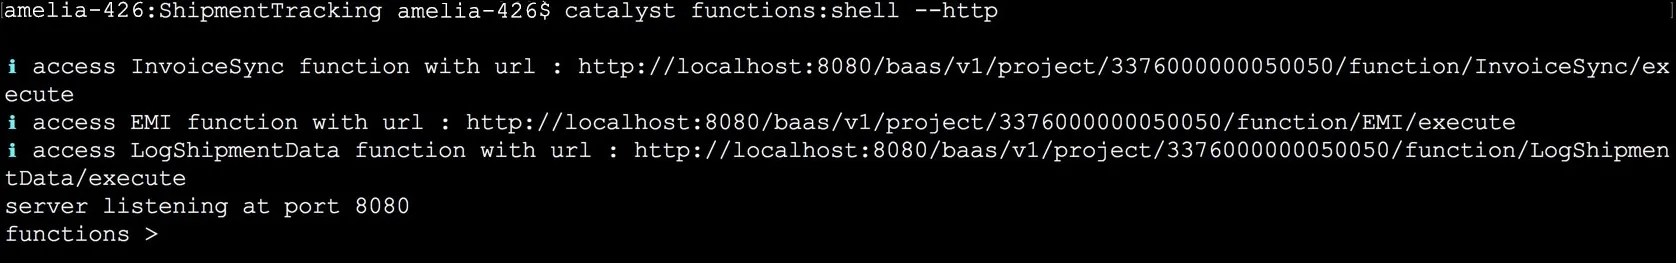
You can start a function shell in the HTTP mode and test all the Basic I/O functions in a project, by executing the following command from the project directory:
This will host all the Basic I/O functions in the functions directory of the project locally, in the default port 8080 . The CLI will display the endpoint URLs of all the functions. You can access these functions by opening the URLs in your browser at any time while performing the shell operations.
You can now test and run your functions as discussed in the previous section using the shell, and view them in HTTP mode by accessing their URLs.
You can also start the server in a different port, if you require, while executing this command and override the default port 8080. This can be done by specifying the port number with the --http option.
For example, if you prefer to use the port 7000, execute this command from the project directory:
--debug [port]
Catalyst allows you to test your Java and Node.js functions locally with a remote debugger attached to the live localhost server.
When you use the --debug option and start the functions shell, Catalyst will listen for the transport dt_socket at the default or custom port and will wait for the connection from the debugger to be established after invoking the function. Once the connection is established, the attached debugger will debug the execution of your function and identify any errors and issues in its code.
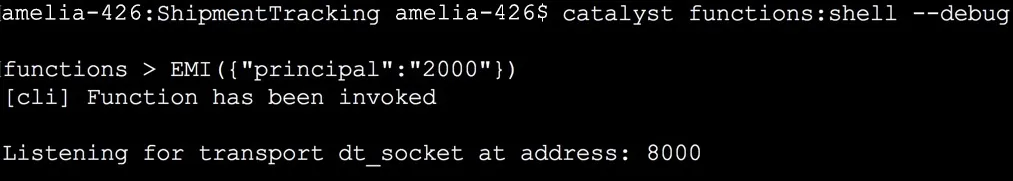
You can start your functions shell and initiate the connection to the debugger by executing the following command from the project directory:
This will open the functions shell in the same way as before. When you invoke the function in the shell, Catalyst will establish the connection to the debugger. Catalyst CLI will allocate port 8000 for the debugger by default.
Once the debugger is attached, the CLI will display a message to indicate this fact. Catalyst will then execute your function in the debugging mode and display the server response.
You can override the default port 8000 and start the debugger in a different port, if required. This can be done by specifying the port number with the --debug option.
For example, if you prefer to use the port 7000, execute the following command from the project directory:
--ignore-scripts
This option allows you to inform Catalyst to ignore the pre- and post-lifecycle scripts written in the catalyst.json file for a particular function.
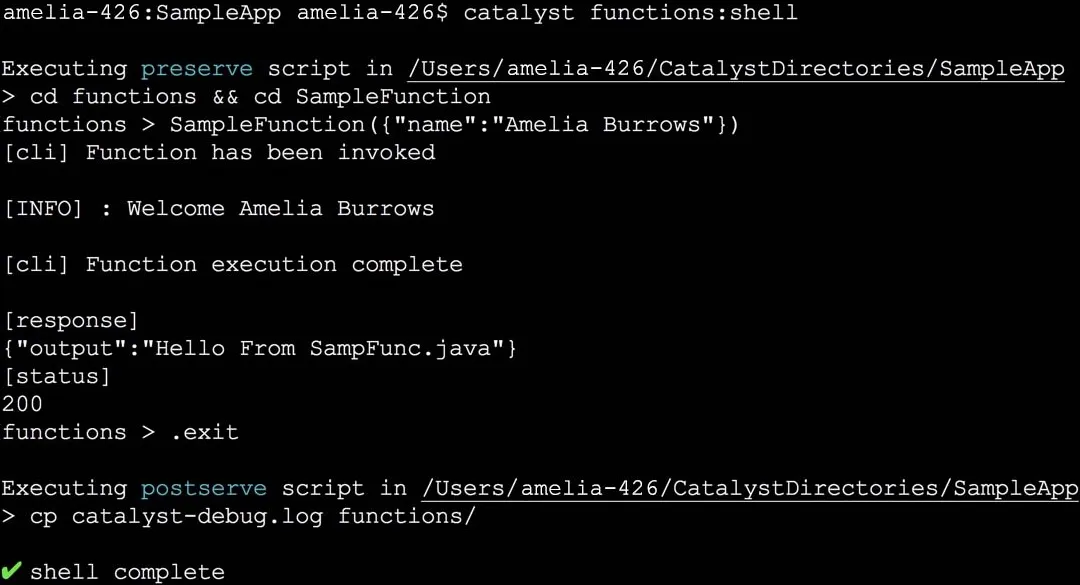
Since you can host and access Basic I/O function endpoints using the --http option in the functions shell, the preserve and postserve scripts are executed automatically when they are hosted. The preserve script executes before the function is served, and the postserve script executes after you exit the local serve, if available.
You can inform Catalyst to ignore these pre- and post-lifecycle scripts when the functions are served using the --ignore-scripts option.
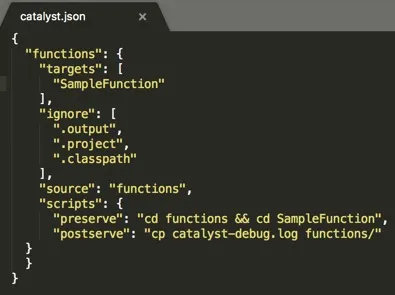
For example, let’s configure the catalyst.json file of a project to include the following preserve and postserve scripts for a function.
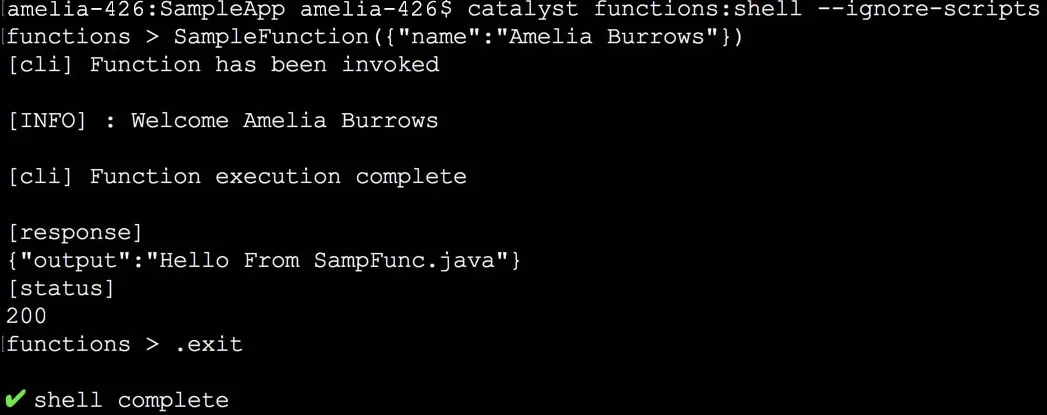
If you launch the functions shell without using the –ignore-scripts option, the scripts will be executed before the shell opens and after you exit the shell respectively as shown below.
To ignore the preserve and postserve scripts, launch the functions shell by executing the following command from your project directory:
This will ignore the scripts and run the shell in the standard manner.
--no-watch
Catalyst CLI enables a live watch mode in the functions shell by default. This mode actively watches for changes made in the function file or the function directory after the shell is opened. When it detects changes committed in the function file or the function directory, it enables a hot reload of the functions shell to reflect the updates live. You will therefore be able to access the updated version of the function in the live shell immediately after the changes are saved, without having to re-compile or re-serve the code.
You can disable this default watch mode by launching the functions shell using the --no-watch option, as shown below:
Now if you make any changes to the function file after you have launched it in the shell, the updates will not be reflected in the compiled function open in the shell. You can work with the updated version of the function either by re-invoking the function after the changes are made, or by exiting the shell and re-opening it.
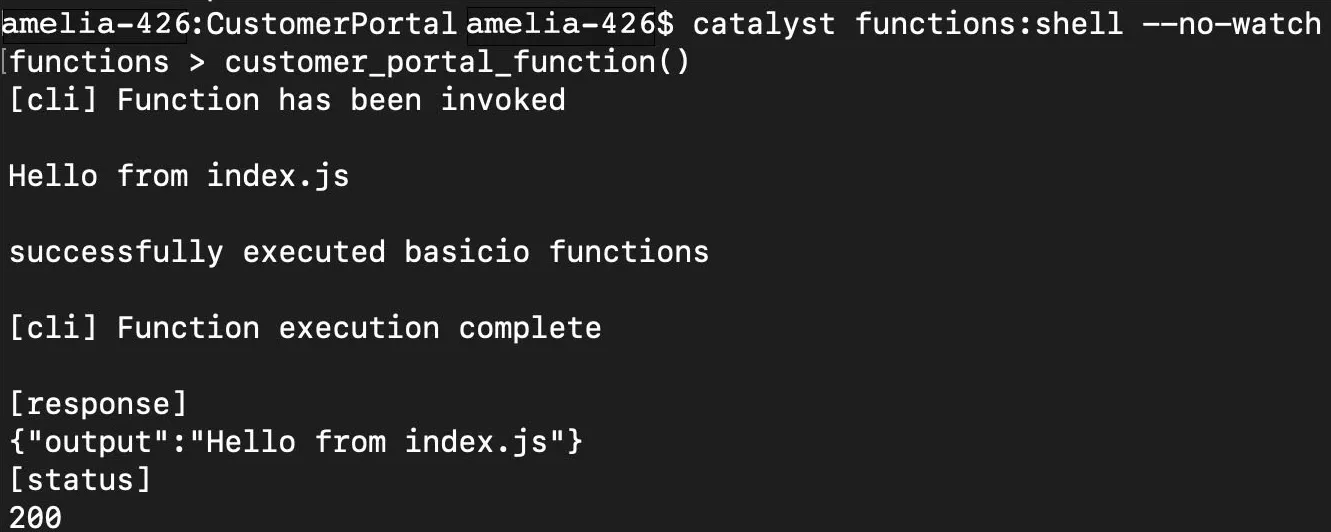
For example, let’s consider a function that contains the default sample code of a Node.js Basic I/O function. It prints the message “Hello from index.js” when it is invoked in the functions shell.
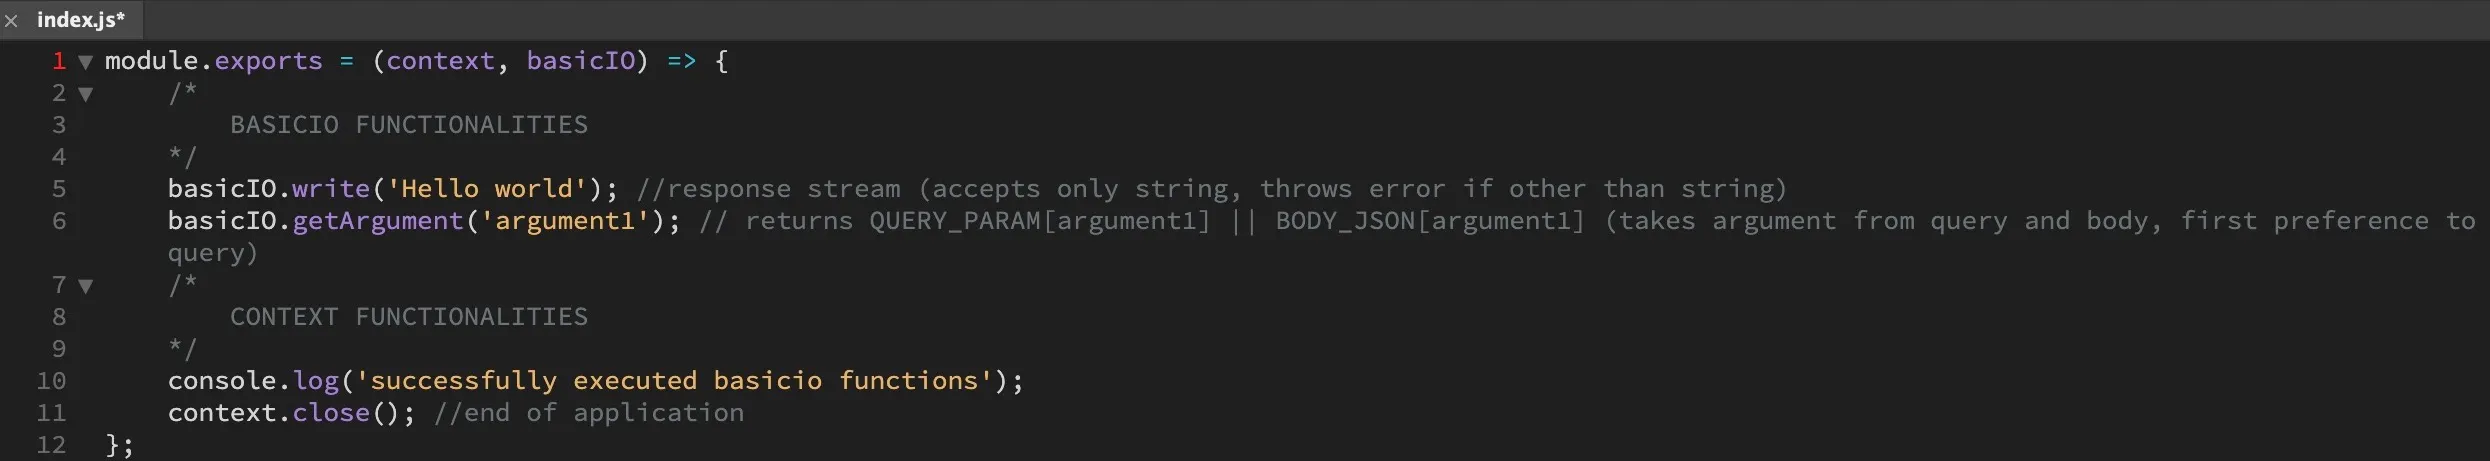
If you make changes to the function’s code as shown below, these updates are not reflected live in the CLI while the function is still open in the shell.
You will need to invoke the function again to get the output for the updated code.
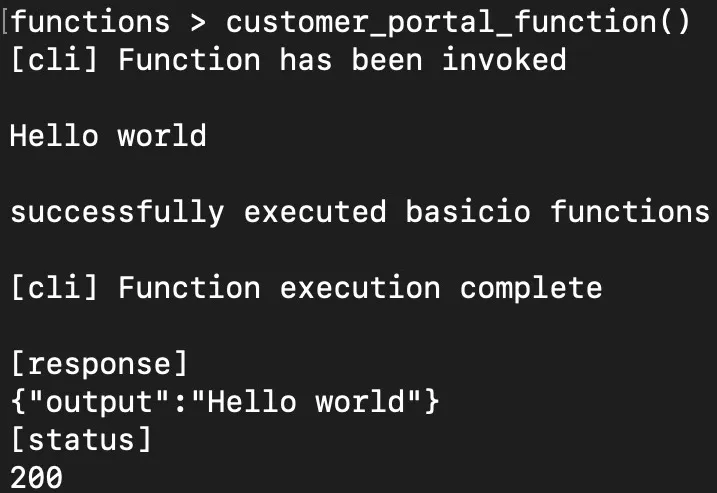
However, if you don’t use the --no-watch option and launch the functions shell with the default watch mode enabled, the shell will detect the changes made in the code live and perform a hot reload of the function automatically, as shown below.

Debugging Python Functions
To debug a Python function, you will need to use a Python IDE independently, as Catalyst currently does not offer CLI support to debug them. You can attach a local debugger with an IDE of your choice, such as Visual Studio Code or PyCharm. The debugger will listen to the port where the function is hosted locally and the IDE will display a live log of the activities at the port.
The steps to debug a Python function using VS Code are given below:
- To debug a particular Python function hosted in a local server from an IDE directly, you will need a debugger package to establish the connection between the local server and the IDE. In this case, we will be using the debugpy Python package.
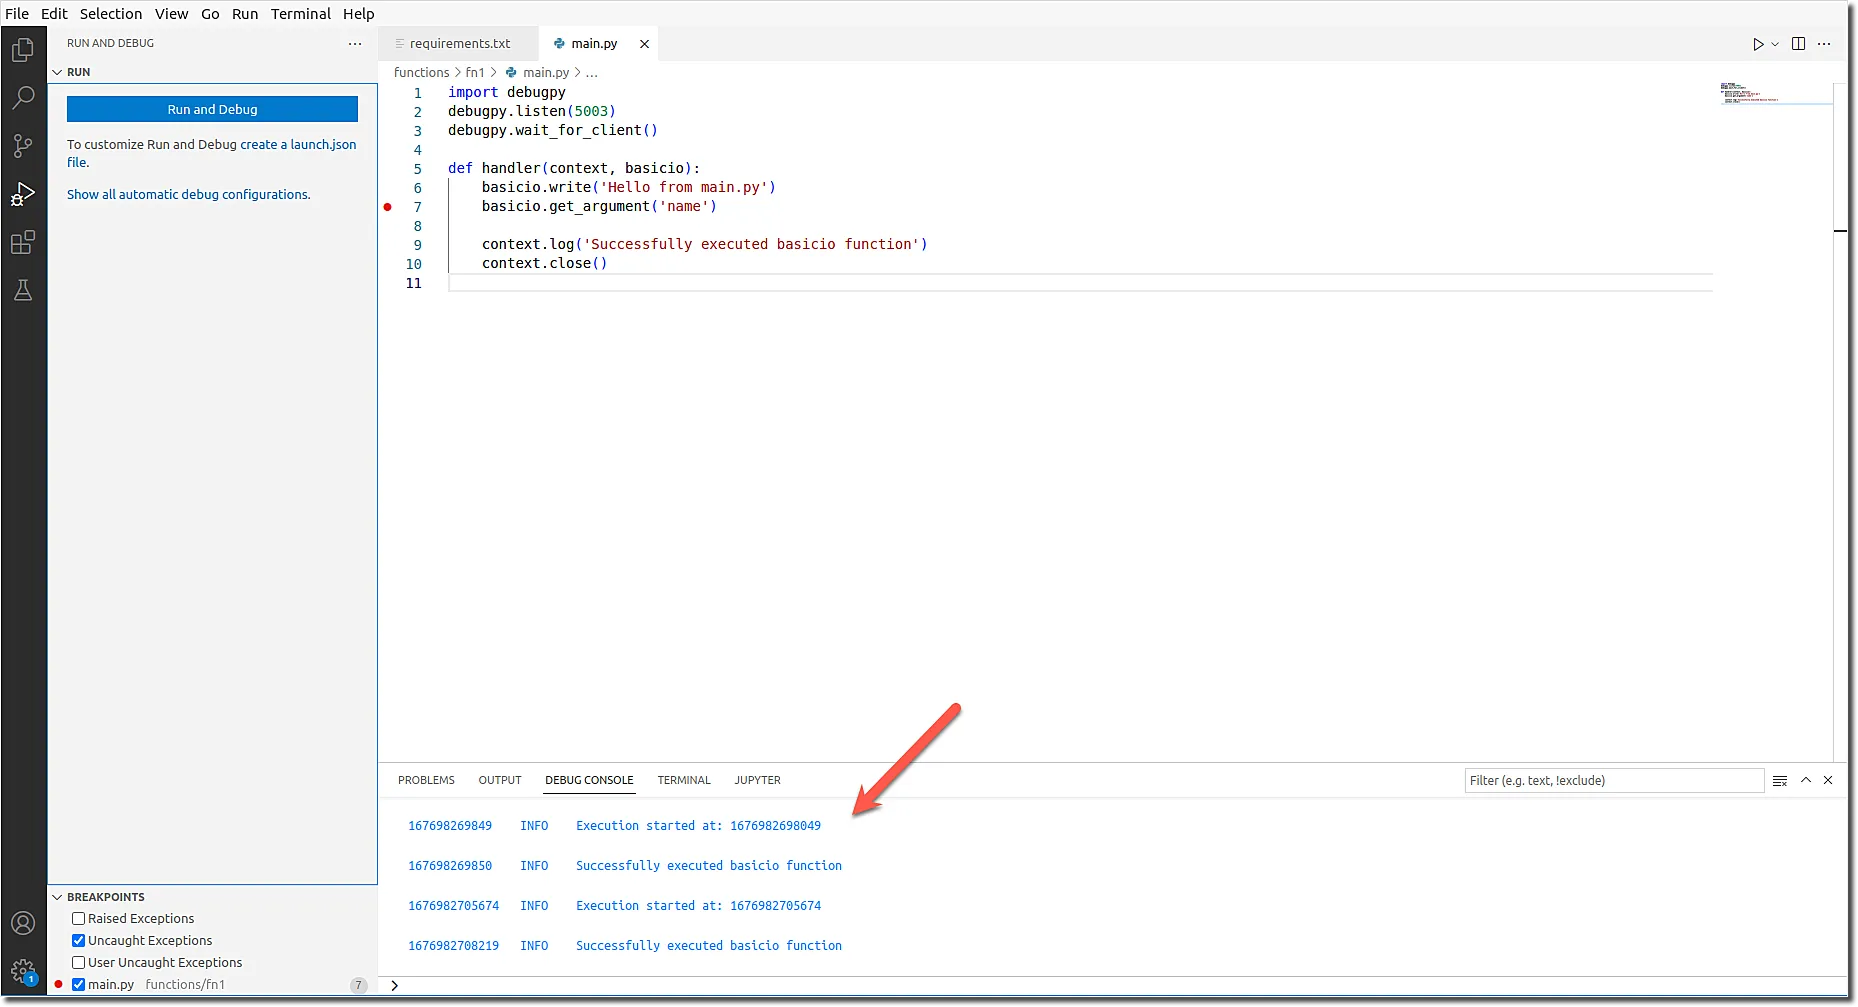
Open your Catalyst project directory in VS Code. In the main.py file, include the lines of code given below.
import debugpy
debugpy.listen(<<"Enter port number here">>)
debugpy.wait_for_client()
- Navigate to your functions directory and, to install the debugpy package, execute this command in your IDE terminal:
- Create a launch.json file in the root directory of your Catalyst project, if one doesn’t exist already. You can refer to this help page for the steps to create a launch.json file. Add the following code in the file and save it.
{
    "version": "0.2.0",
    "configurations": [
        {
            "name": "Python: Remote Attach",
            "type": "python",
            "request": "attach",
            "connect": {
                "host": "localhost",
                "port": <>
            },
            "pathMappings": [
                {
                    "localRoot": "${workspaceFolder}",
                    "remoteRoot": "${workspaceFolder}/.build/"
                }
            ],
            "justMyCode": true
        }
    ]
}
- Now, switch to Run and Debug view in VS Code and start the debugger. You can now execute the CLI serve command to view the function’s execution details in your IDE terminal.
You can take a look at this help page for more detailed steps on local script debugging of Python functions in VS code.
Last Updated 2025-11-19 20:37:41 +0530 IST
Yes
No
Send your feedback to us