Function Details
The function details page provides extensive information on the component usage of a particular function’s specific execution. The specific execution is chosen from the Functions section or from the Top 100 Slowest Calls list in the Dashboard section, as mentioned previously.
The component usage here indicates the Catalyst components that were called or used using the Catalyst SDKs in the function. For example, if a function was coded to insert a key-value pair into a cache segment using the Java SDK for cache, that would account for a call to the cache component in the project.
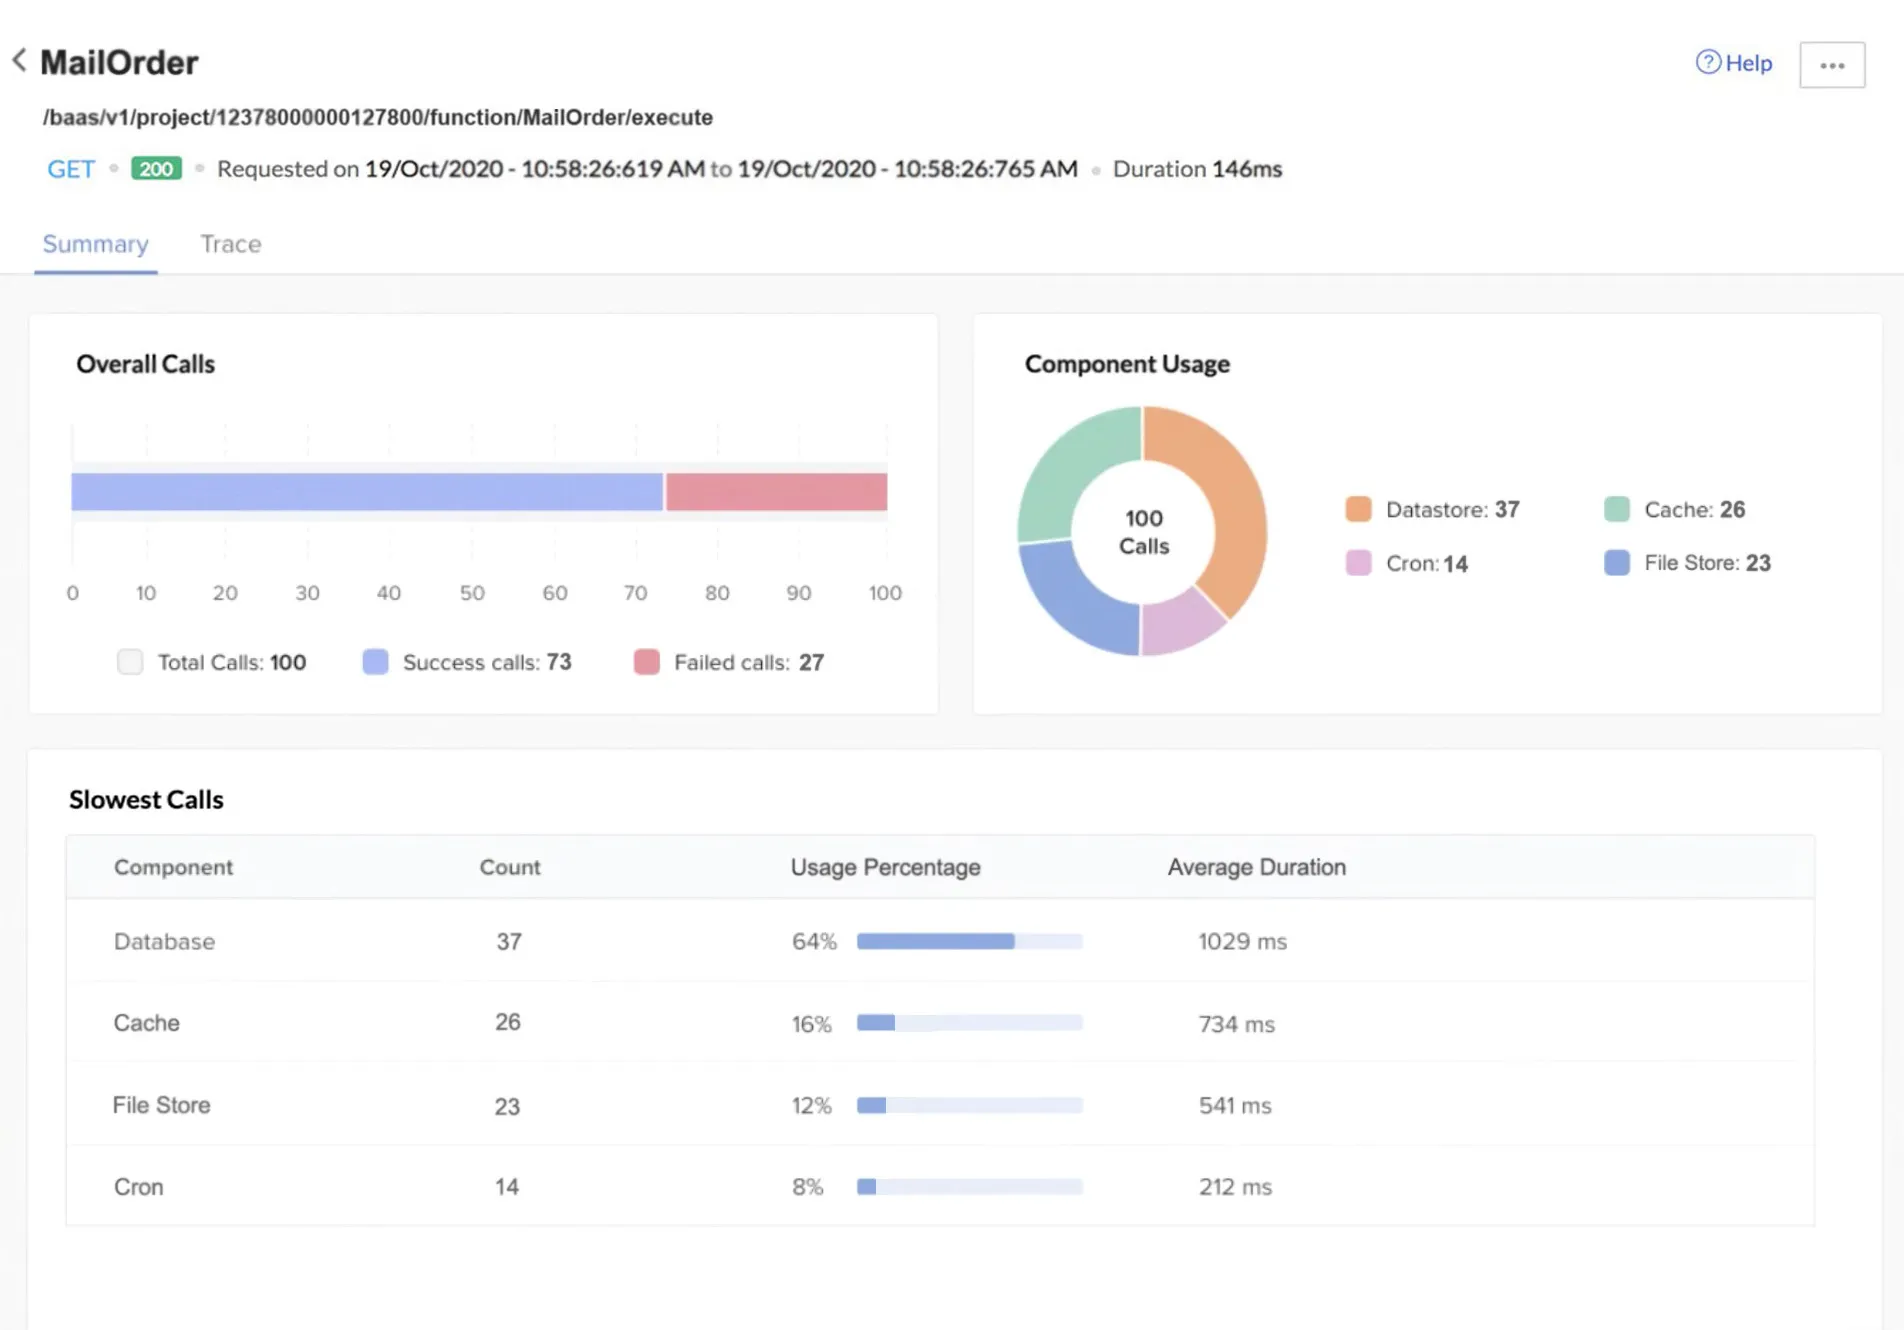
This page provides necessary details about all the components that were called in the function execution. Other functions called by the executing function are also included in the components. The top of the page contains specifics such as the data and time interval of the execution, the execution duration, and more.
-
The calls made to Catalyst components using Catalyst APIs in the function execution will not be accounted for in this report.
-
The function URL, the HTTP method, and the response code displayed apply only to the Basic I/O, Advanced I/O, and Browser Logic functions. For a Cron, or Event function, the top of the page will only contain the function’s execution status as “Success” or “Failure”.
Summary
The Summary section displays the following graphs:
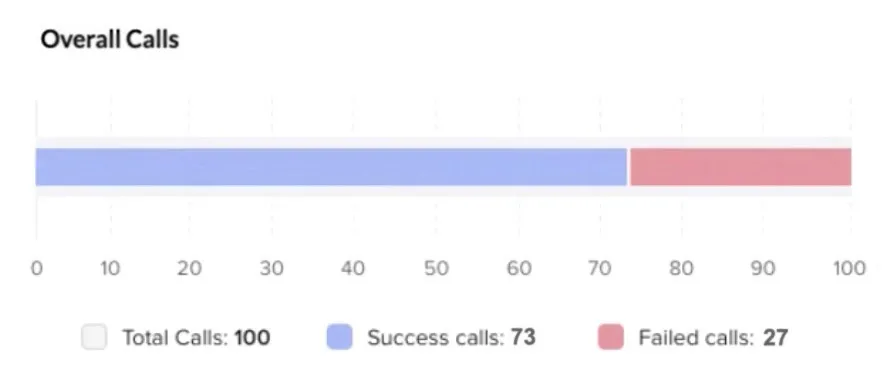
- Overall Calls: This graph provides details of the total number of component calls made, broken down into the number of successful calls and failed calls in that execution, in the time interval displayed on top of the page.
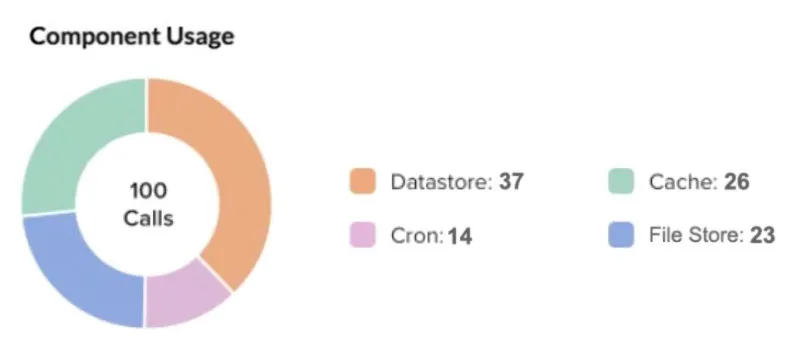
- Component Usage: This graph displays the component usage in that execution, in the time interval displayed on top of the page. All Catalyst components that can be called using the SDKs are accounted for.
The Summary section also displays a list of the slowest component calls, sorted in a descending order of average duration. The average duration is the average invocation time of a particular component, based on the total number of calls made to it.
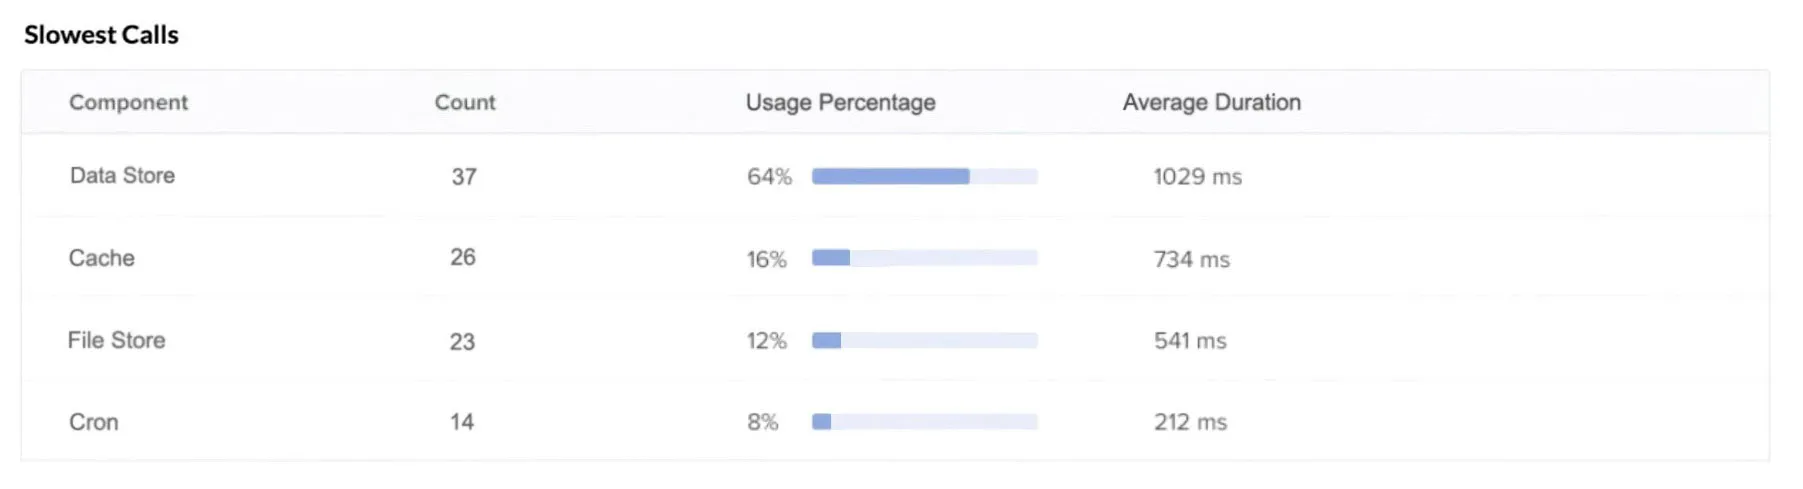
The usage percentage is the percentage of each component used in the execution, relative to one another. This is calculated based on the count or the total number of calls made to each particular component.
Trace
The Trace section provides a comprehensive and detailed graph of the component usage trace in that function execution.
The graph displays the details of each component usage individually, along with some informative metadata. As mentioned earlier, only the components that were called using the Catalyst SDKs will be included here.
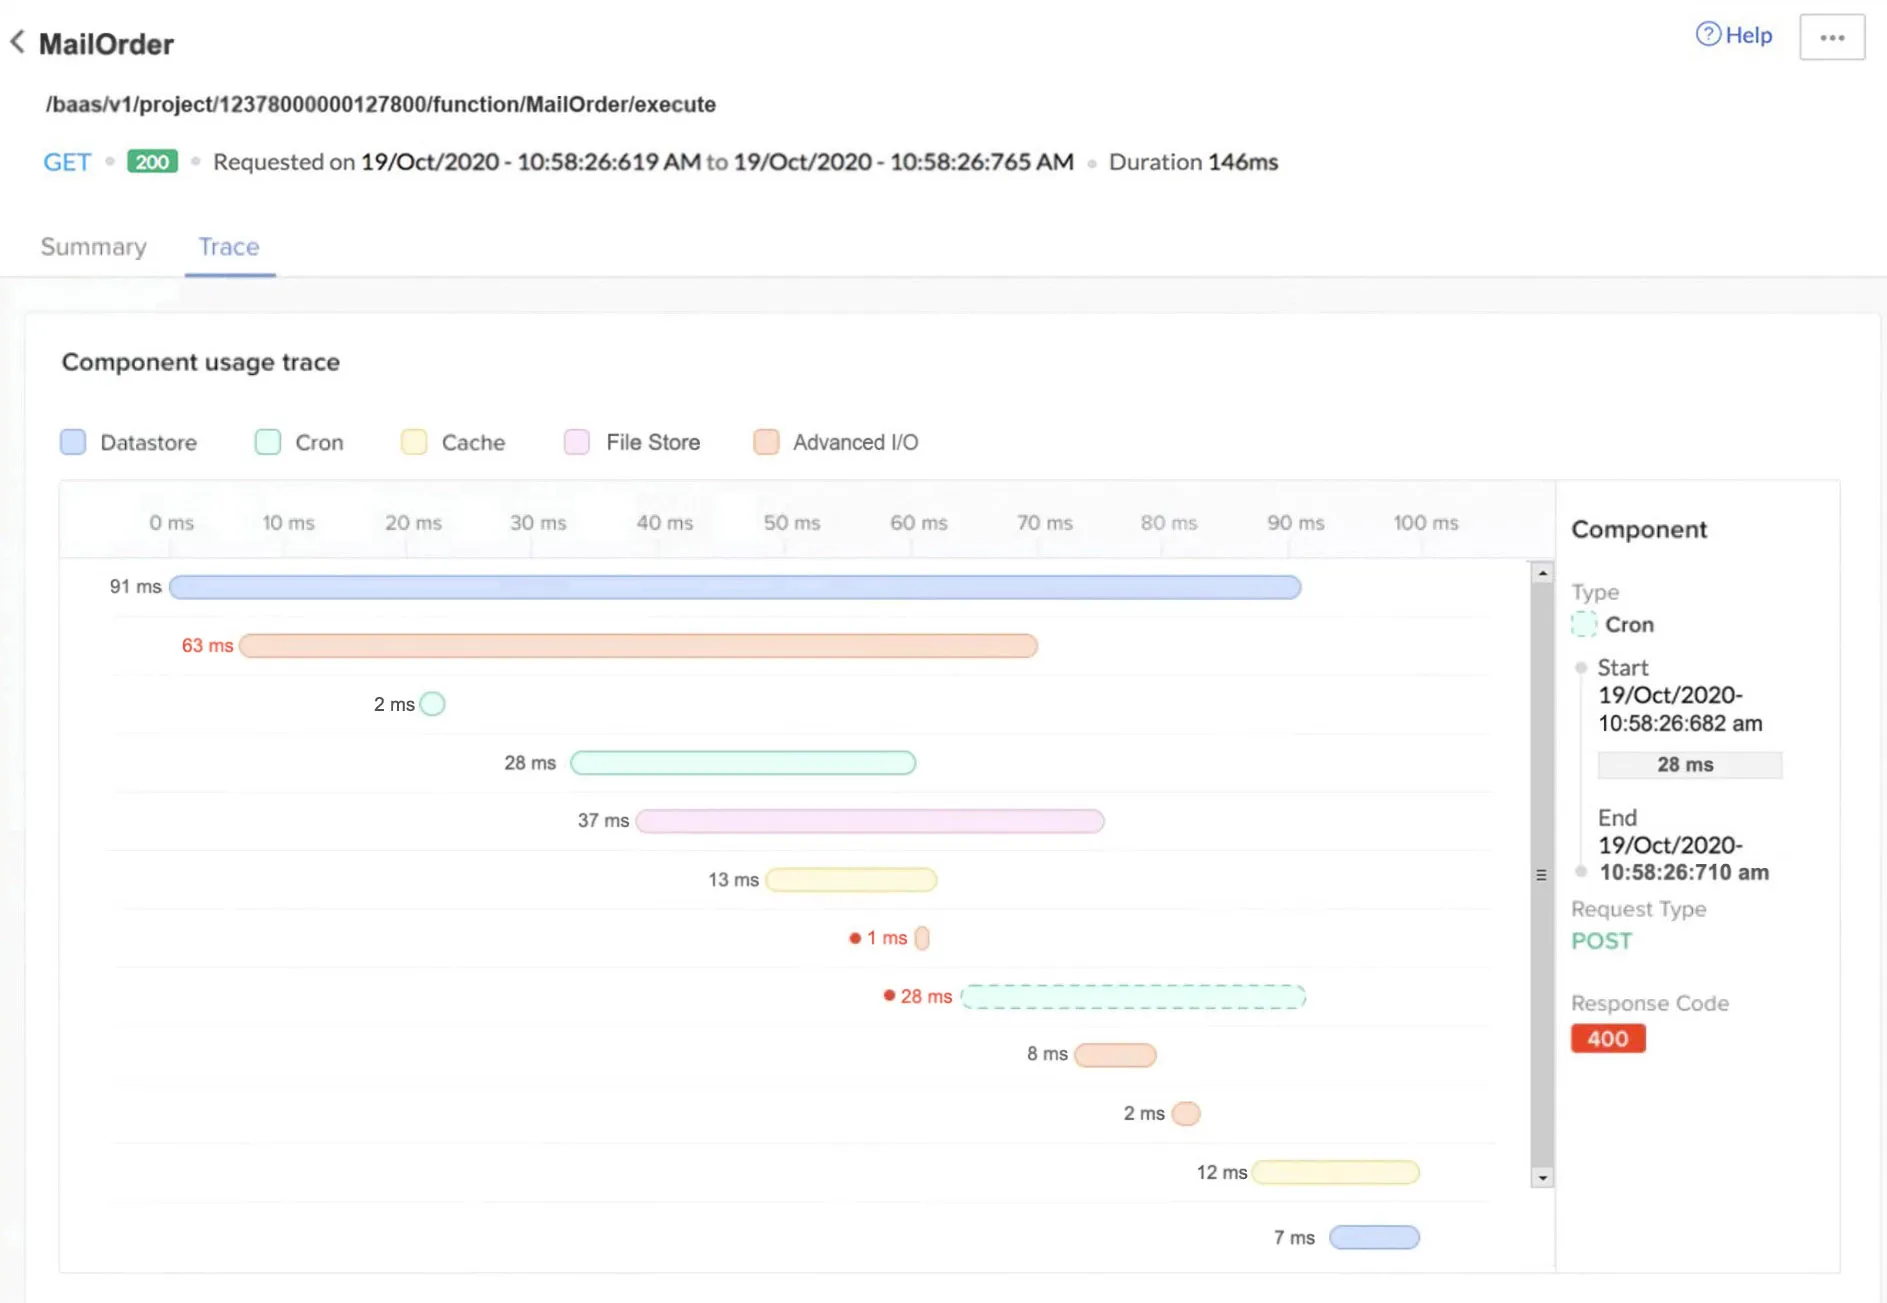
The graph presents a timeline of the components that were called during the duration of the function execution. For example, in the picture shown above, the function executed for a total of 146 ms. The Data Store component was invoked from 0 ms to 91 ms time interval, an Advanced I/O function was invoked next from 7 ms to 70 ms time interval, followed by Cron from 21 ms to 22 ms, and so on.
You can click on a particular component invocation to view its details in an aggregate manner on the right panel. The panel will show the start time and end time of that particular component invocation, along with the duration, request type, and response code of that invocation.
Last Updated 2025-02-19 15:51:40 +0530 IST
Yes
No
Send your feedback to us