Results
The Results section displays a detailed and comprehensive report of all the test plans that were executed.
This shows the results of the automated test plan executions that were scheduled, and the instant runs performed from the Test Plans section. This will not show the results of the live previews executed in the Test Cases section. You can check those results from the respective sections.
Click the Results tab in Automation Testing to access the results.
The Results section displays results in three levels:
All Test Runs
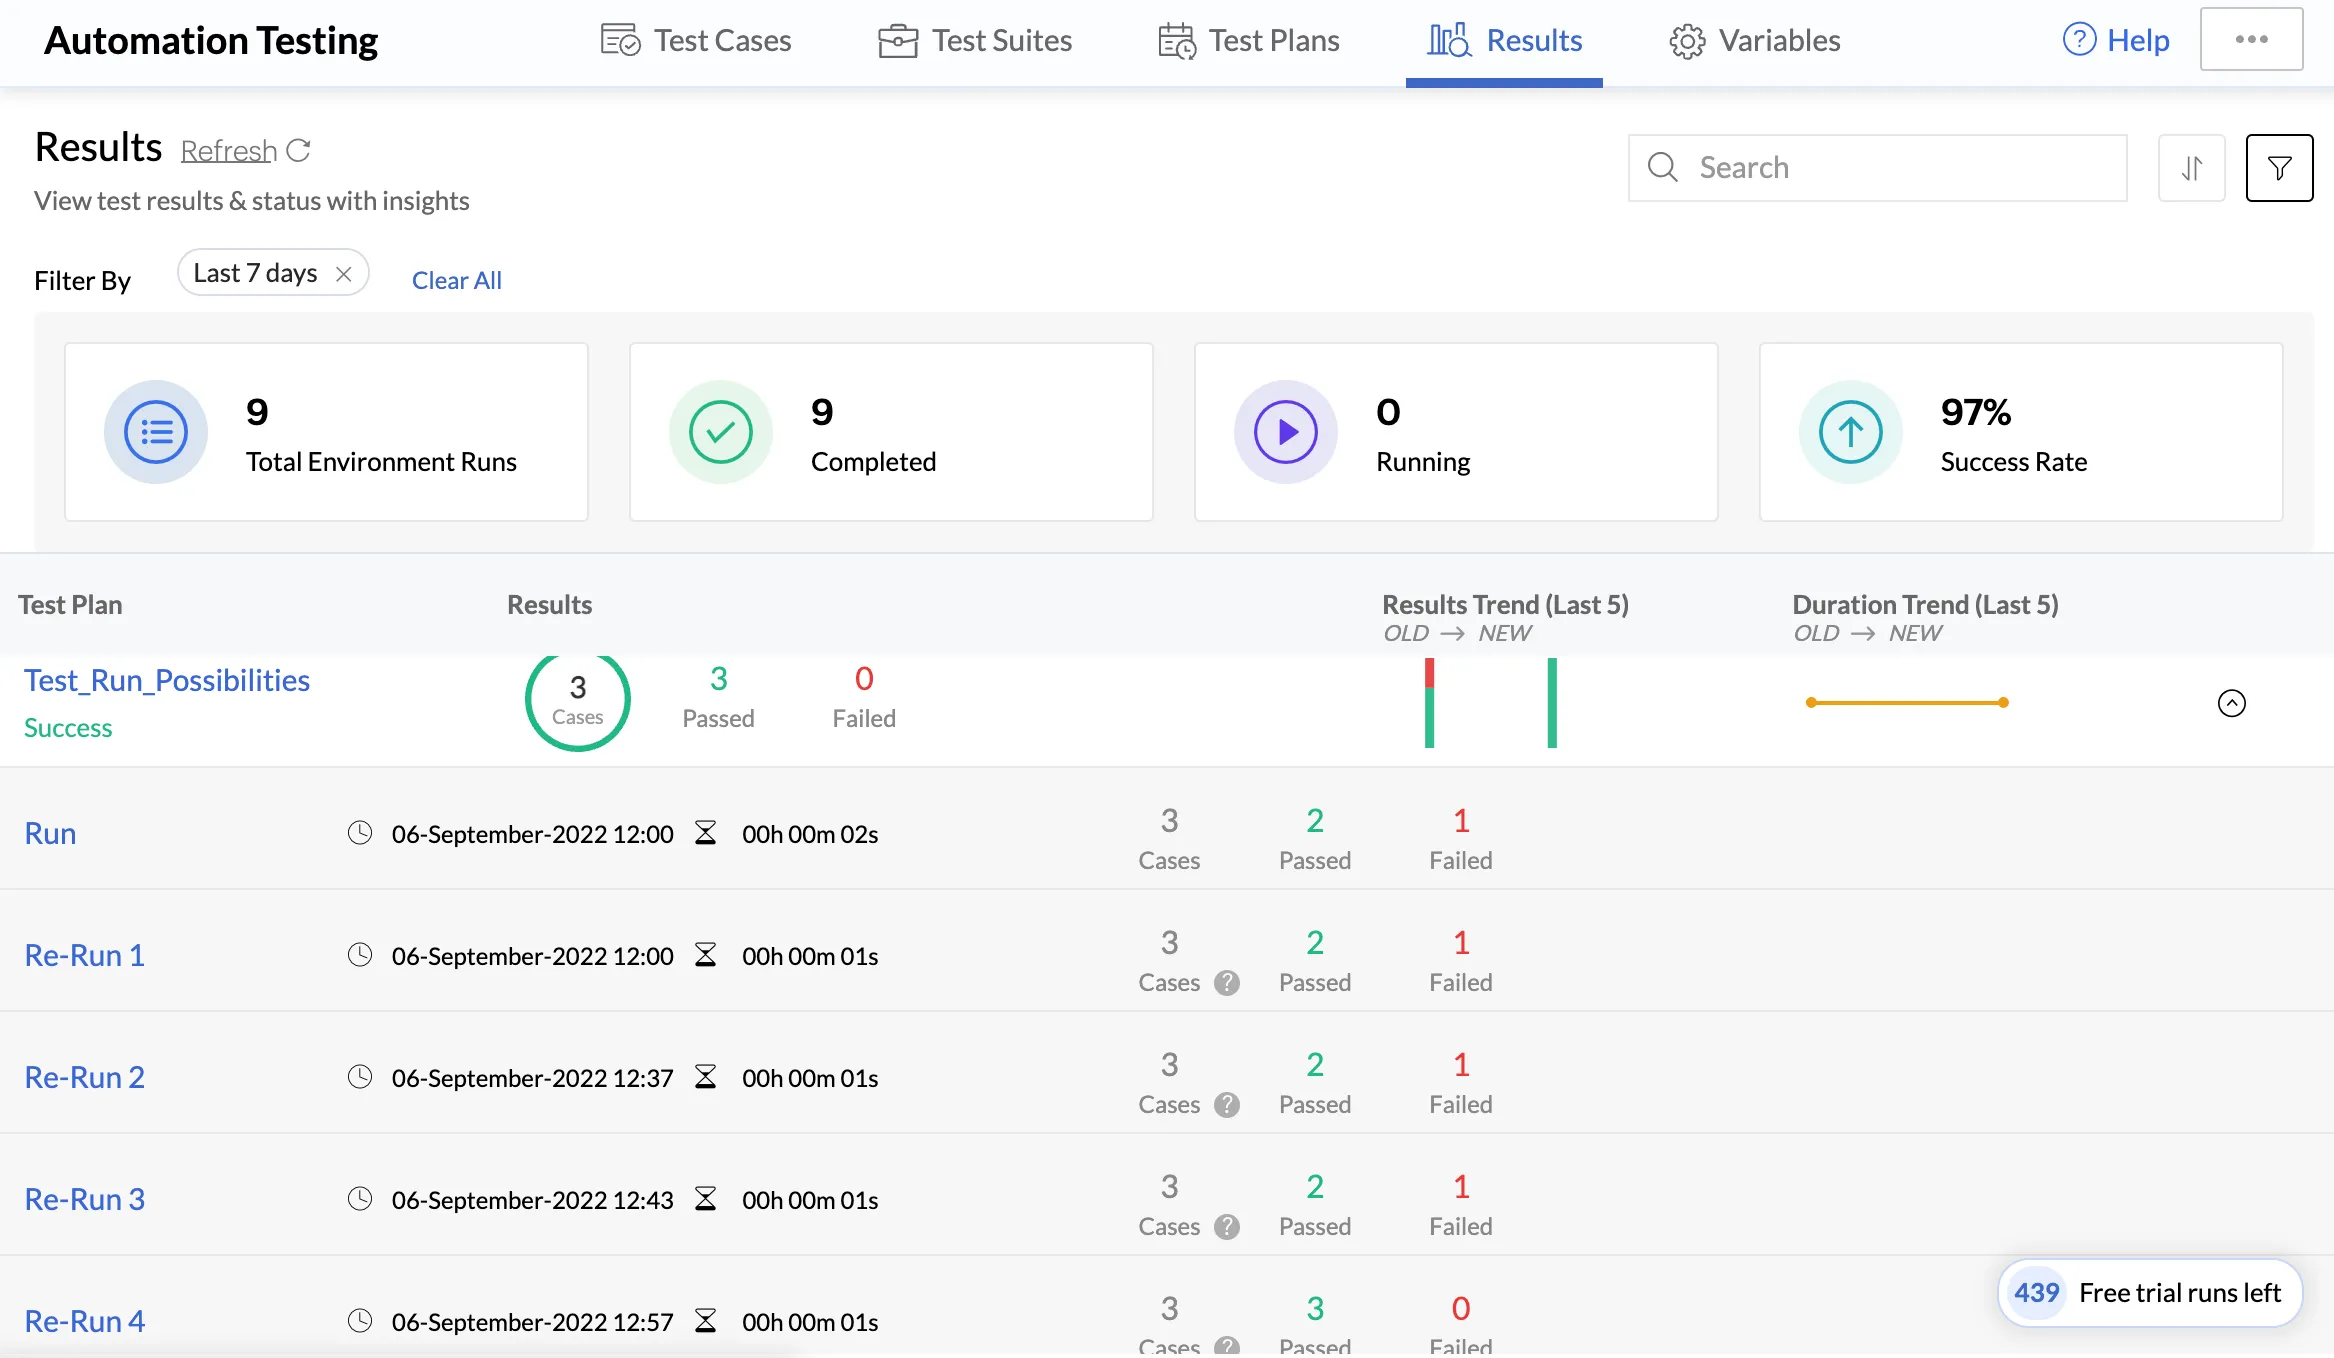
All test runs of all test plans will be displayed in the initial Results page.
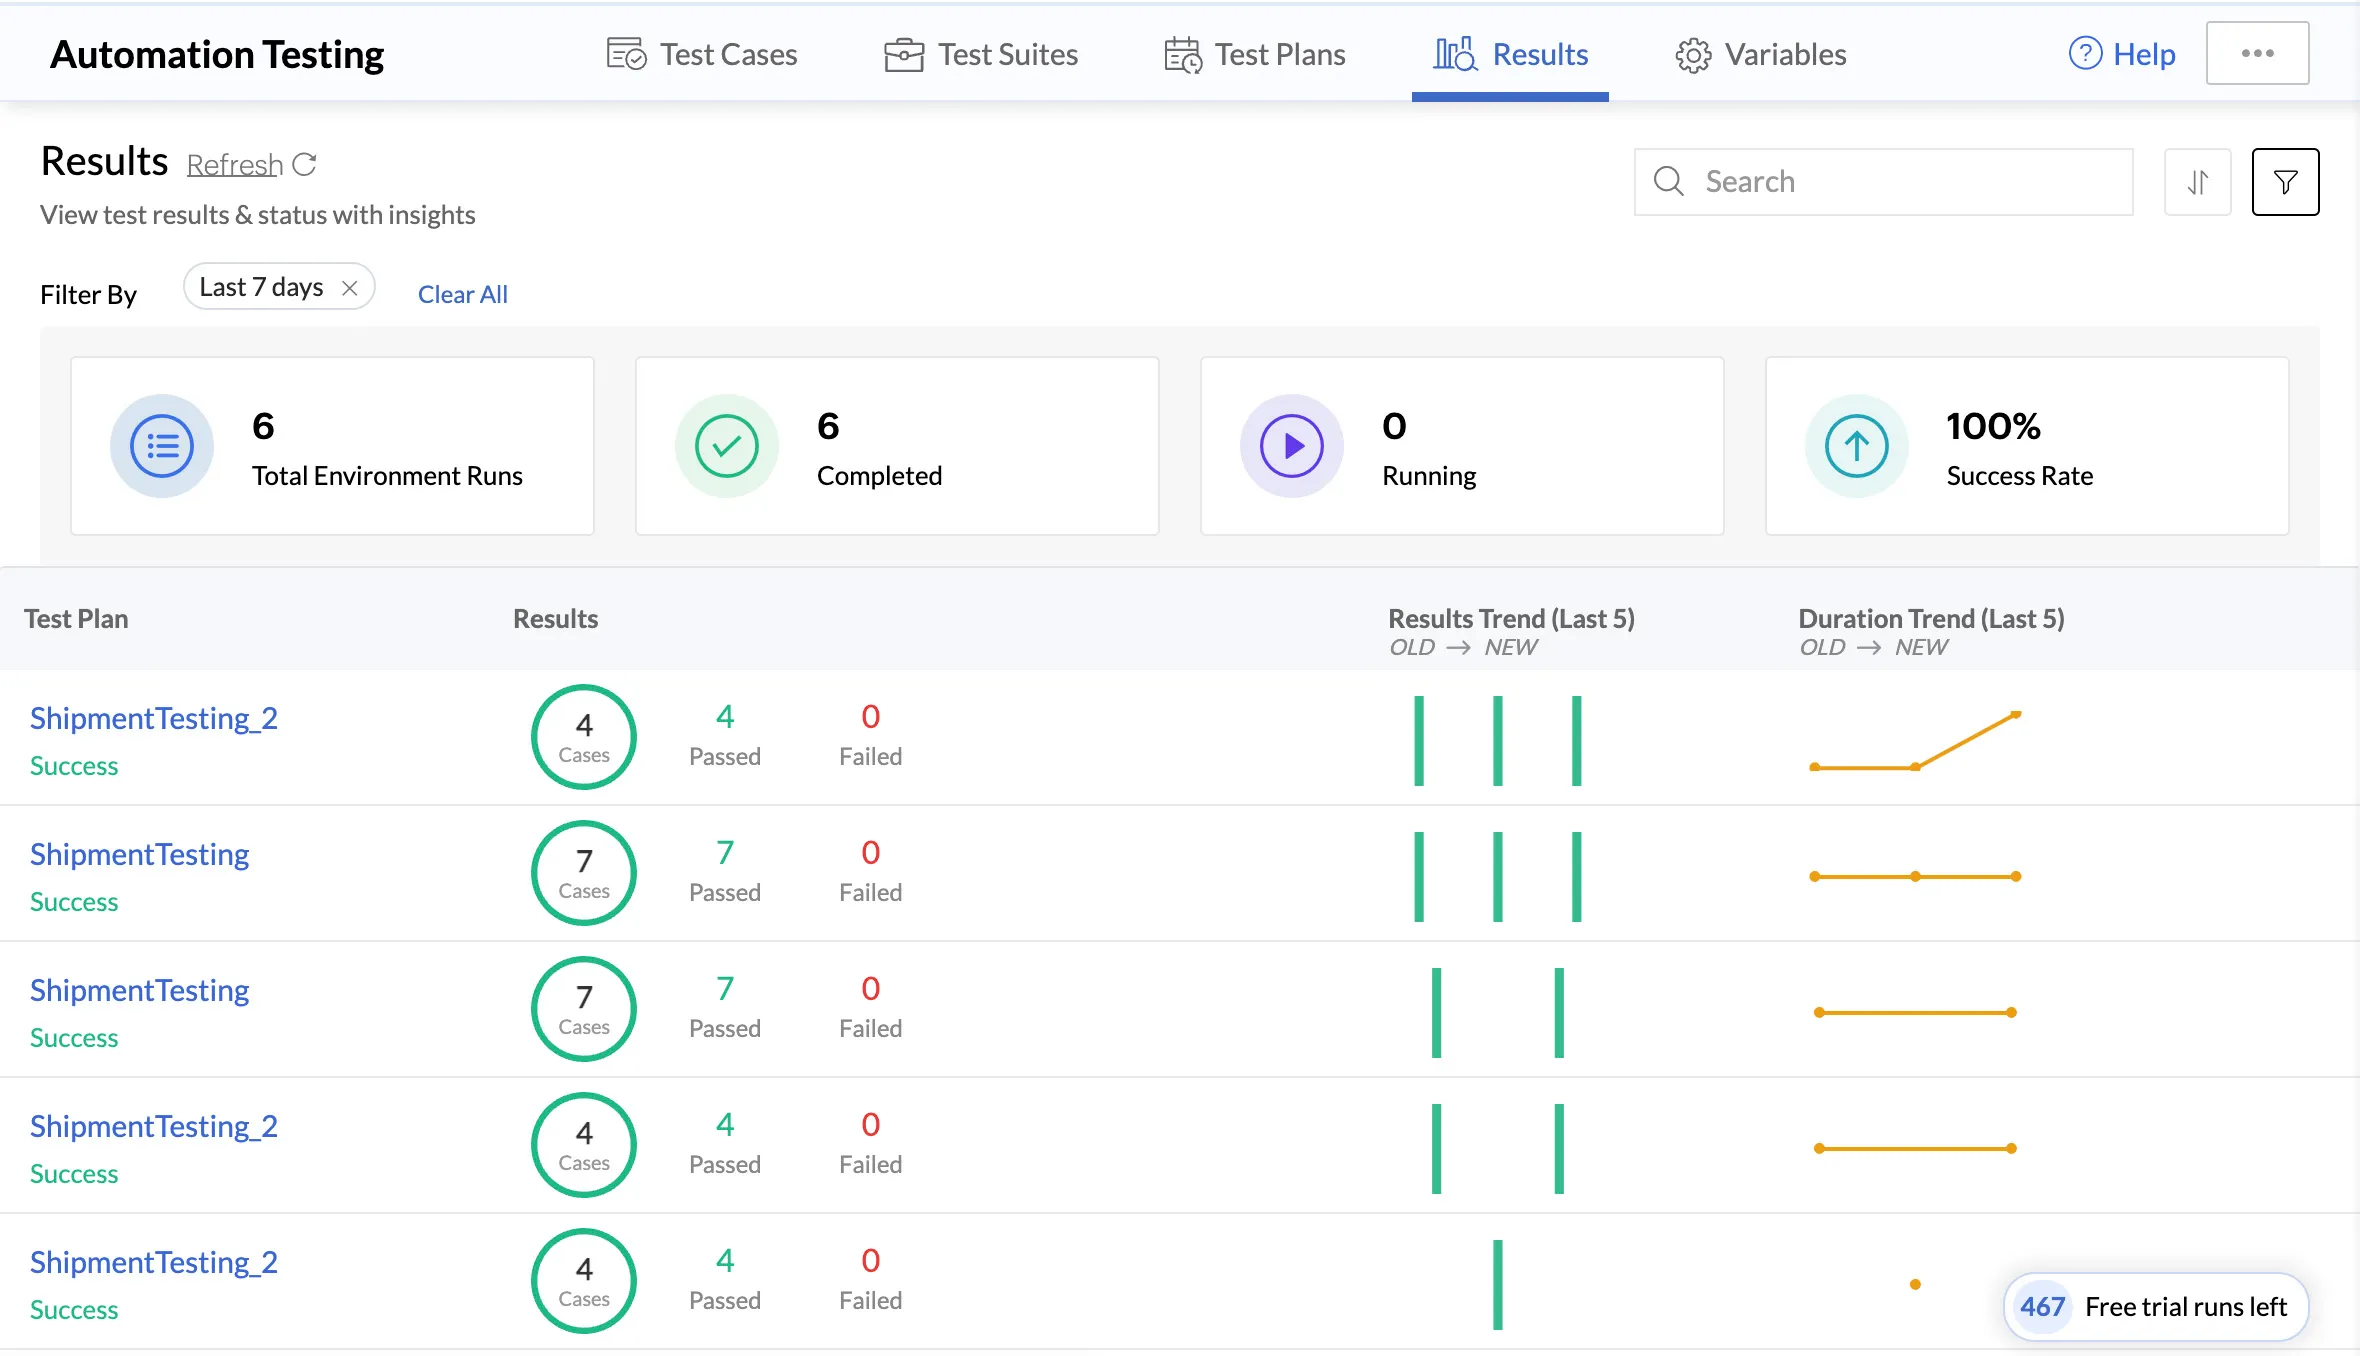
You can view stats such as the number of completed and currently running executions, the overall success rate of all test plan executions, and the number of environments that were involved in the all runs. The last one is based on the environment variables that you select while creating the test plans.
You can find a list of all test runs along with details like their unique Run IDs, number of test cases included in a run, the success percentage of the run, its start time and execution duration.
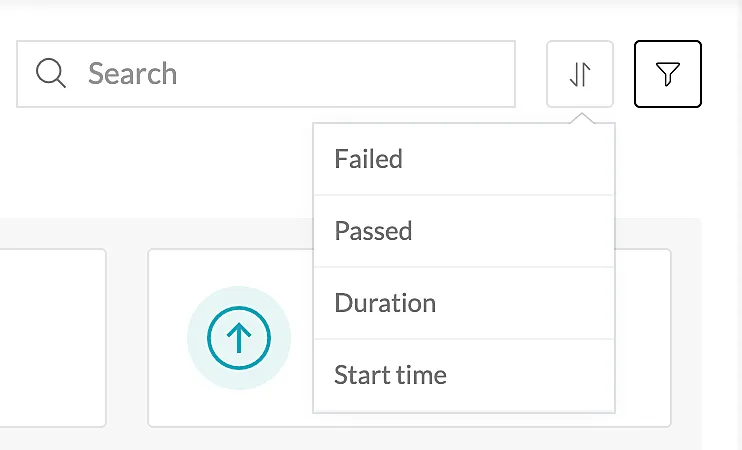
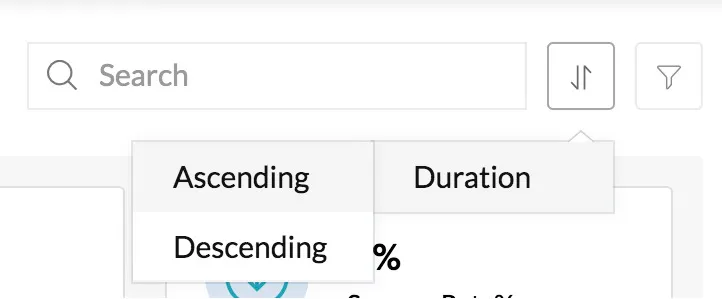
You can sort results based on the criteria shown below, to display runs accordingly.
You can also filter the results by clicking the filter button and selecting various filters.
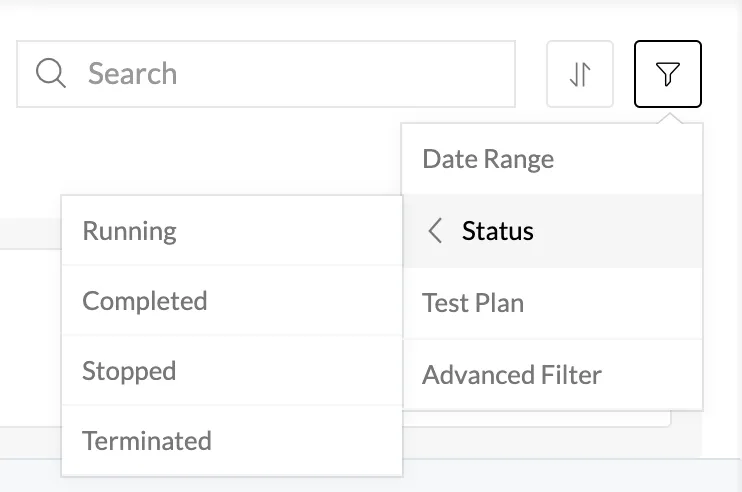
- Date: You can select one of these options for the date filter: Last 24 hours, Last 7 days, Last 1 month, Custom to view results only of that time period. The Custom option enables you select a date window based on your needs.
- Status: You can choose any one of these execution statuses to view relevant results: Completed, Running, Queued, Terminated.
- Test Plan: You can also filter the results based on a specific test plan. All executions of that test plan alone will be displayed.
Click Apply after selecting the filters.
If the results take some time to reflect, click Refresh on the top of this page.
Details of a Particular Test Run
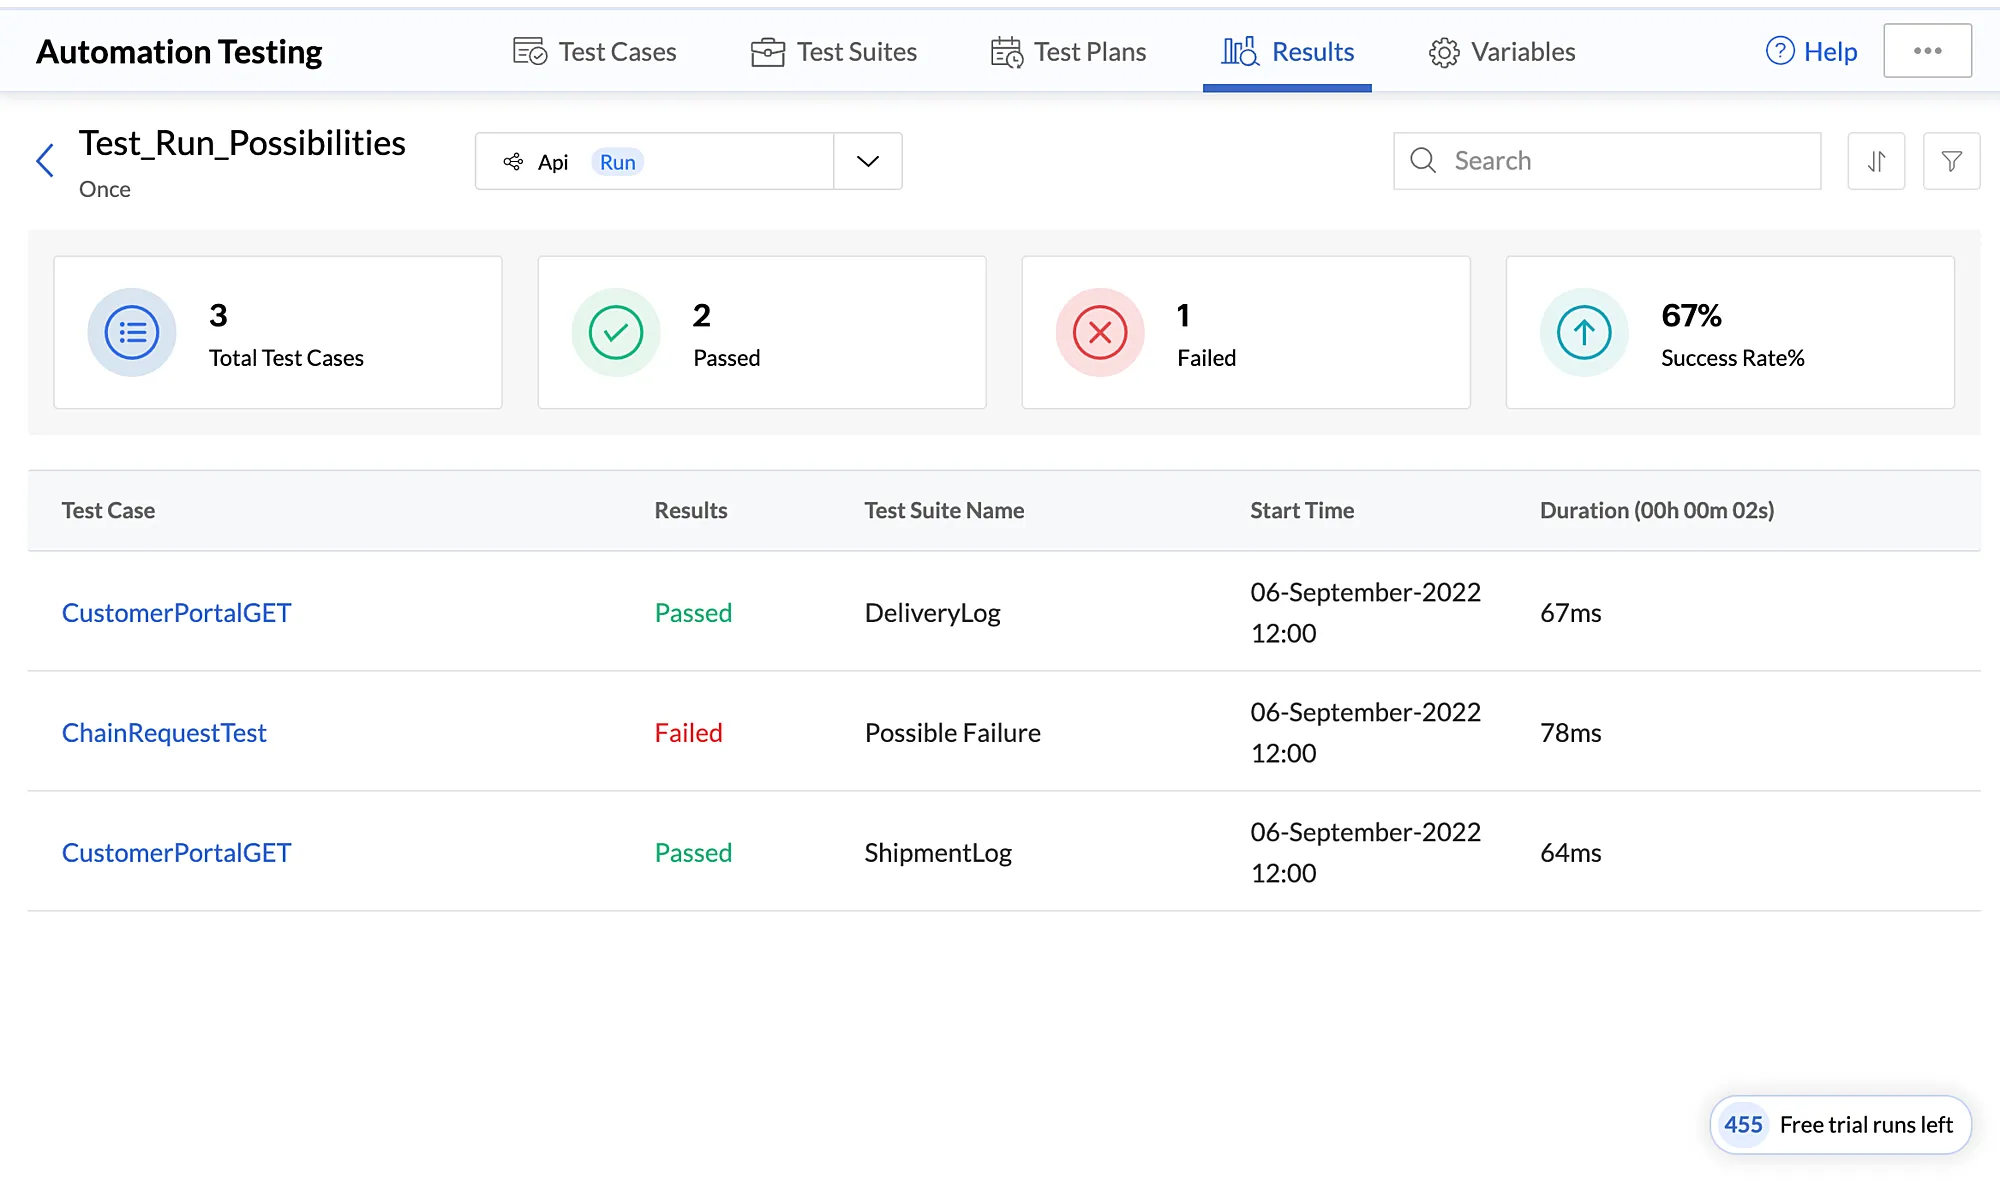
You can open a specific test run from the test runs list to view the details of the test cases included in the test plan. You can view stats like the total number of test cases, number of test cases that are completed, remaining, or inactive, and the overall success rate of that test run.
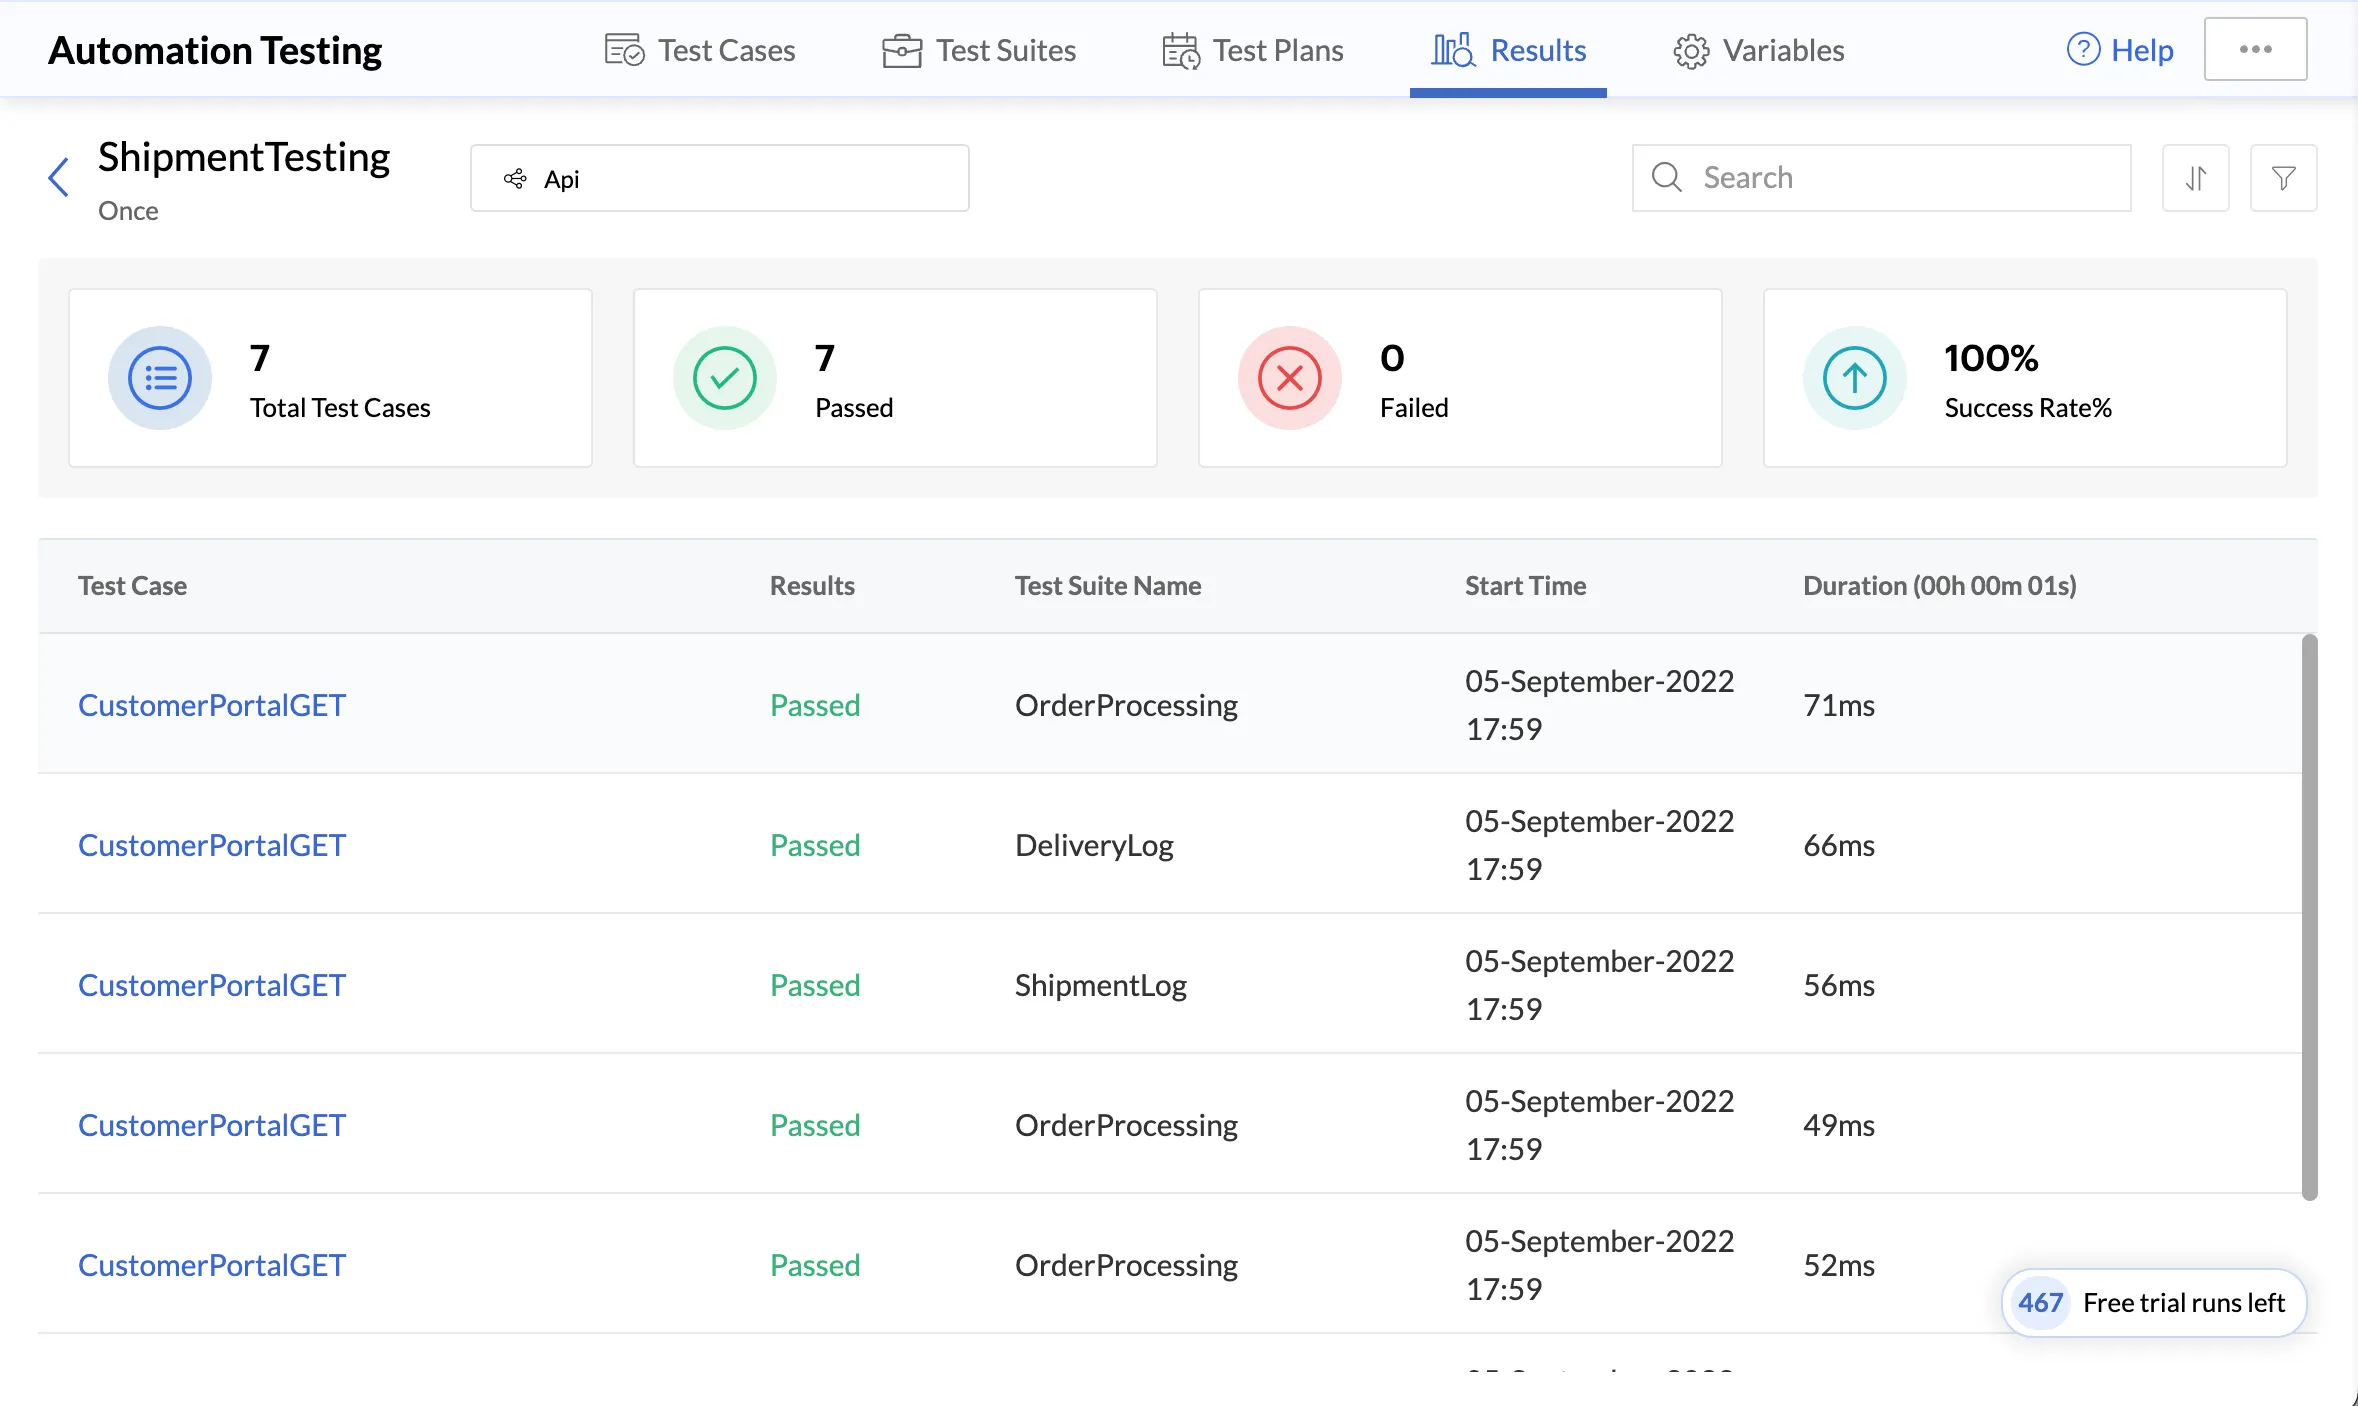
It lists all the test cases that were included in the test plan, along with the overall results and other details of each test case.
You can also sort the results based on the duration of the test case execution.
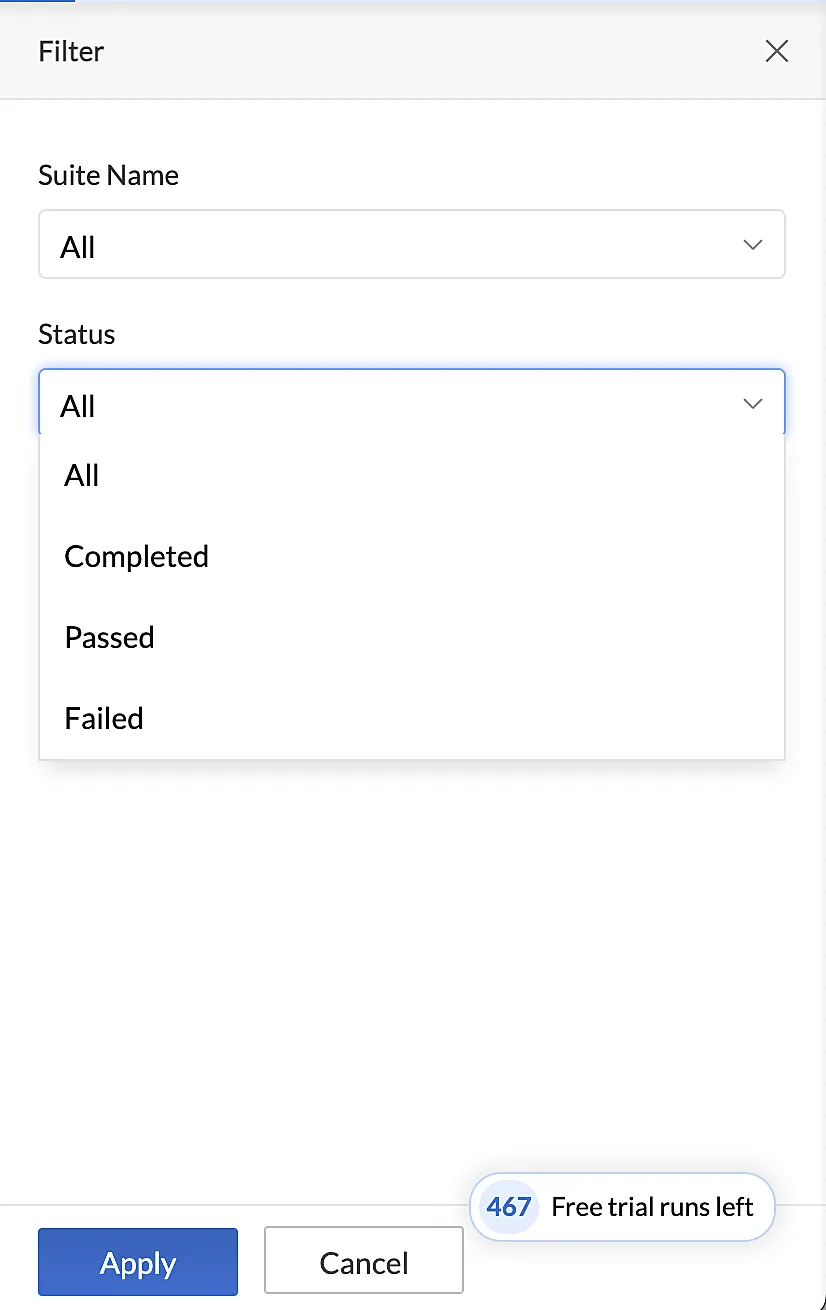
You can filter results by clicking the filter icon and selecting various details. You can view the test cases of a particular suite alone, or test cases that executed with any one of these statuses: Completed, Passed, Failed, Inactive, Remaining. Click Apply after selecting the filters.
Details of a Particular Test Case
You can open a particular test case from the test case list to view the execution details of the individual requests in it. This section provides a summary of the particular test case along with useful statistics such as the overall result and duration of the test case execution, and the overall number of assertions that were passed in the test case.
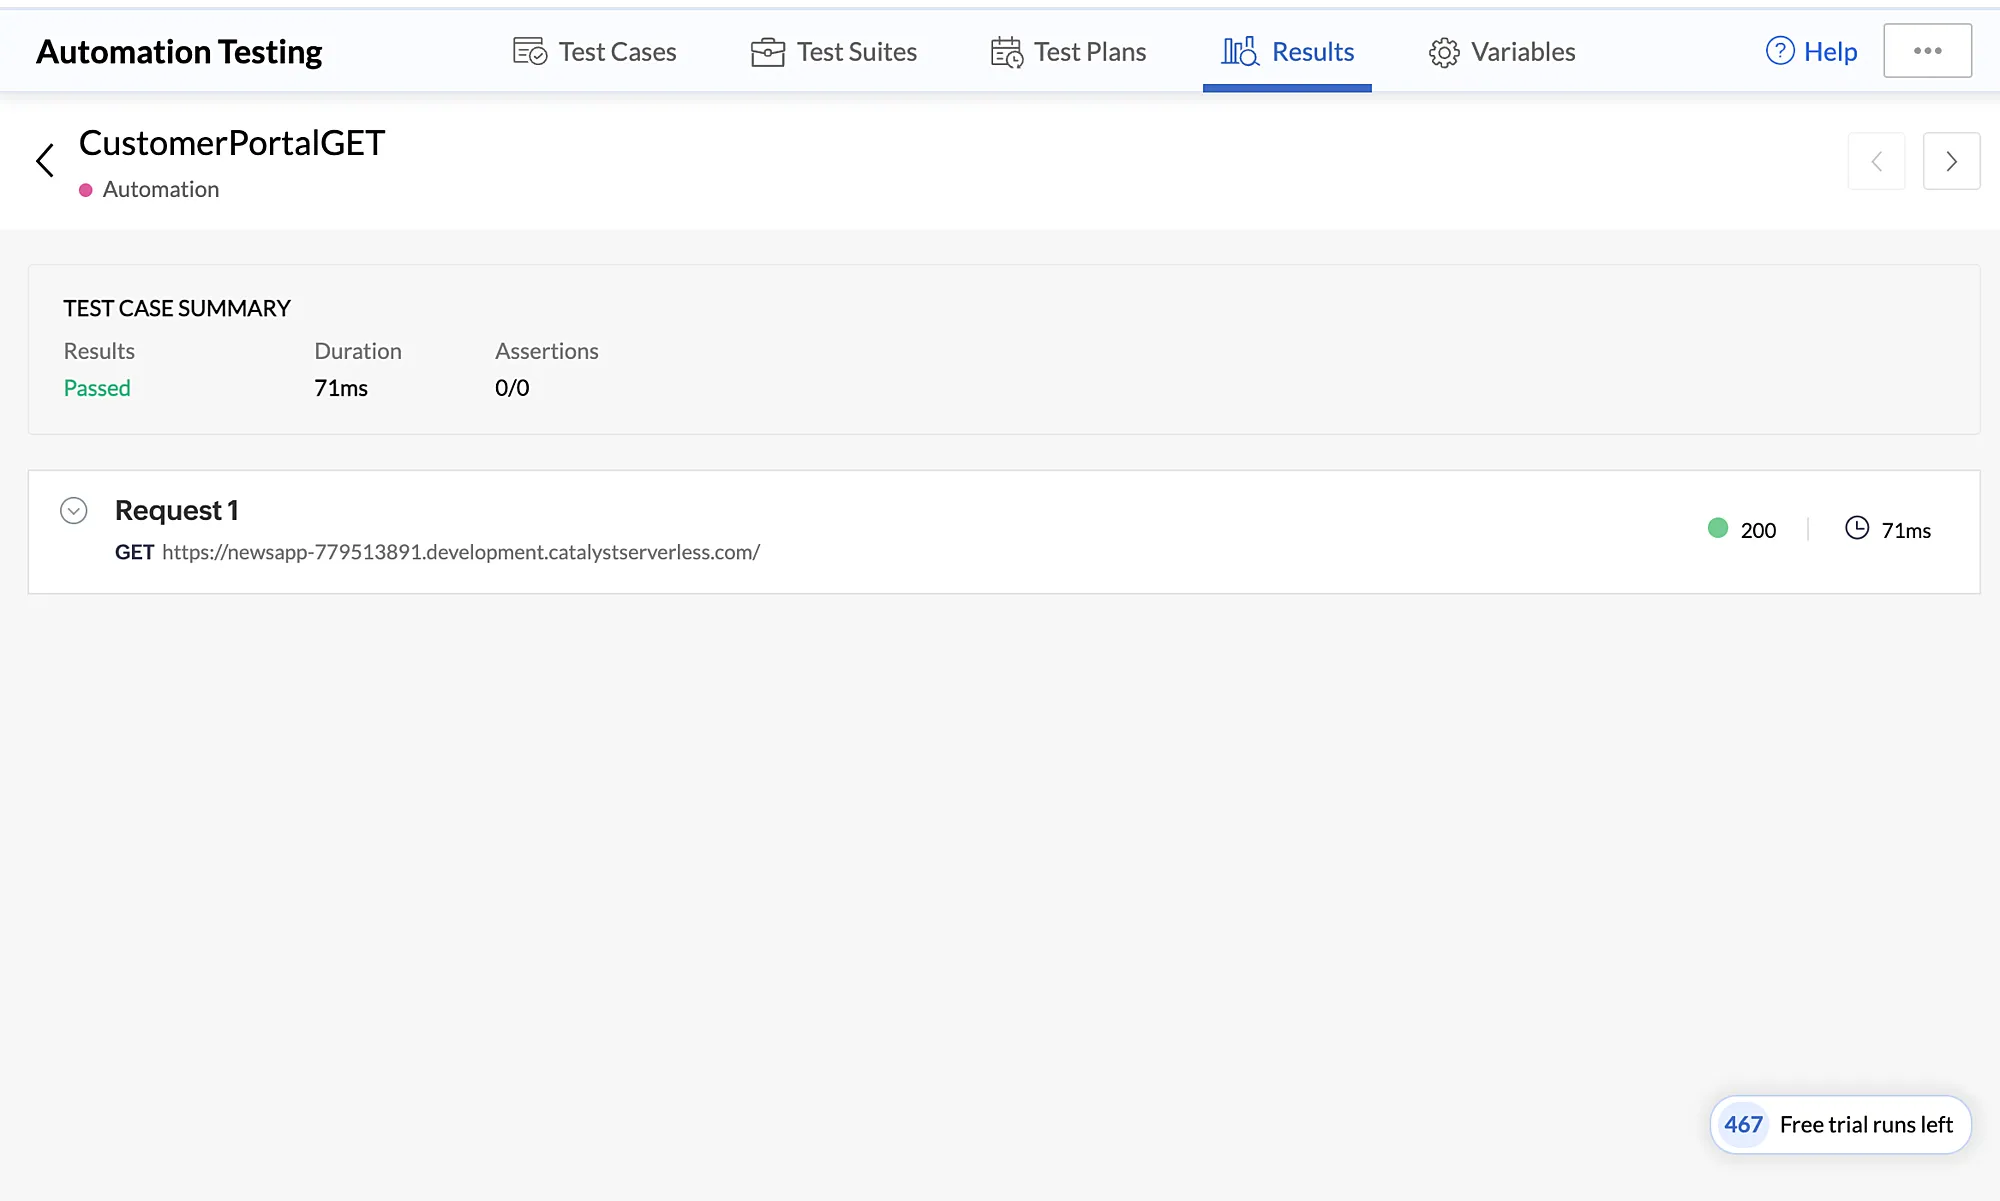
It lists the details of individual requests in the test case, along with the detailed response received for each request. You can expand a request’s section to view the assertions that were passed in that request and the response status code.
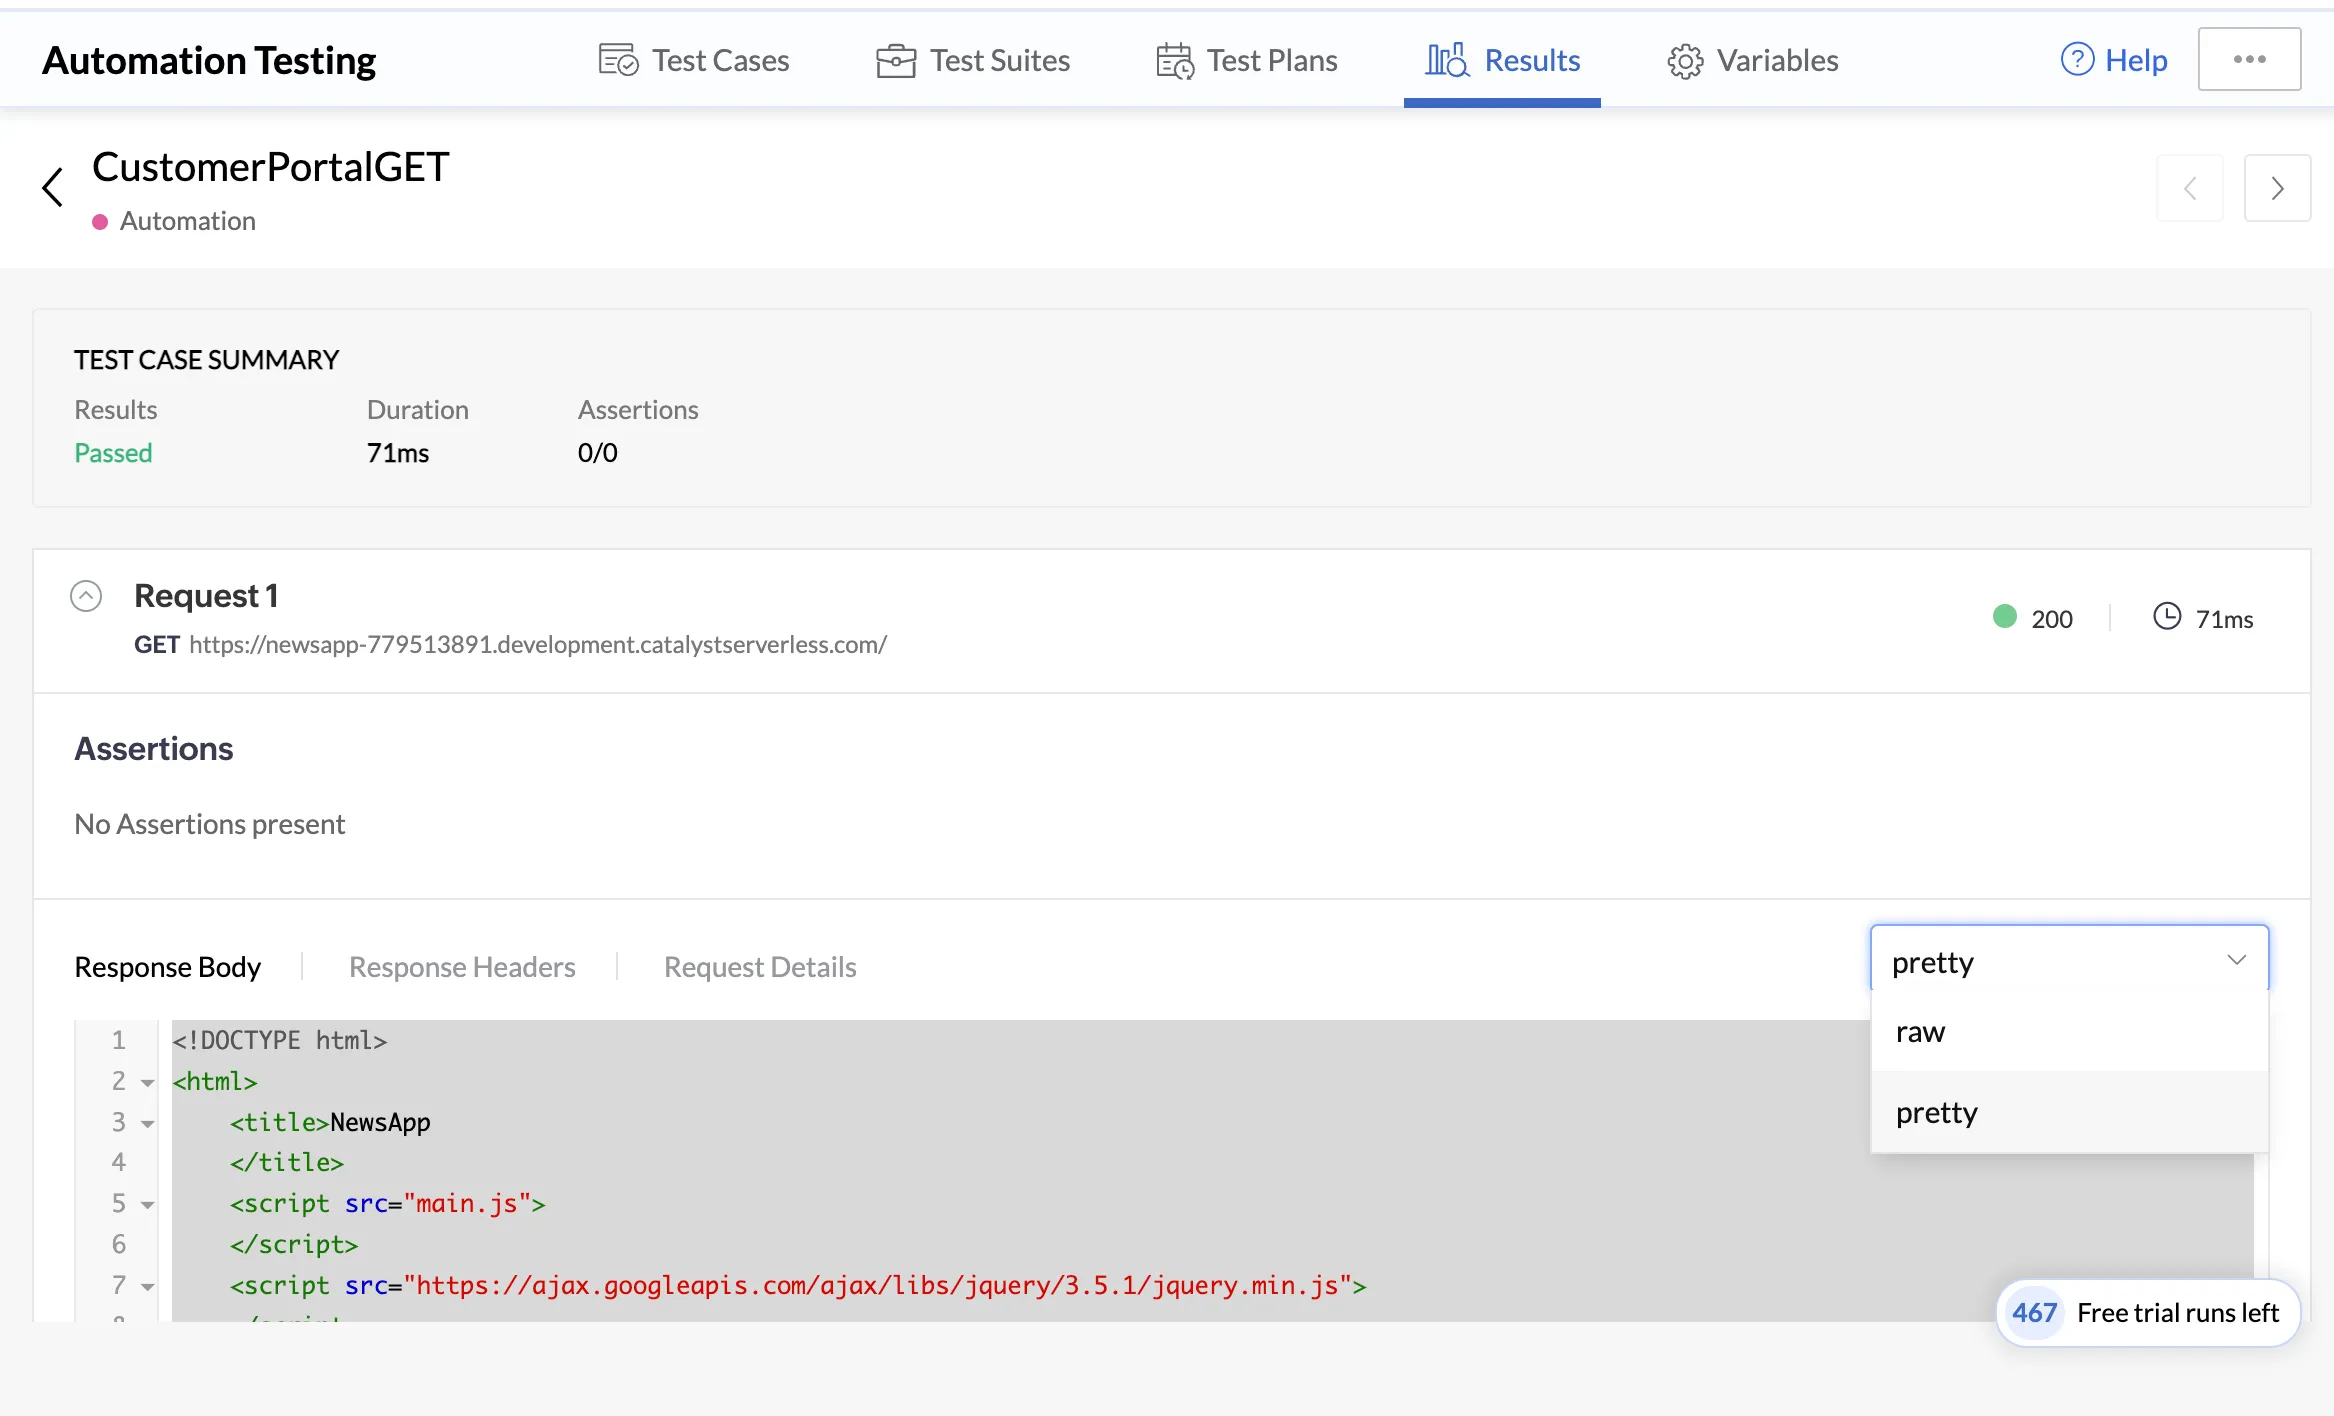
The report also shows the response body, the response headers, and the request details. You can view the Response Body in the raw or pretty format by selecting a choice from the drop-down on the right.
Click the Response Headers or Request Details tab to view those information.
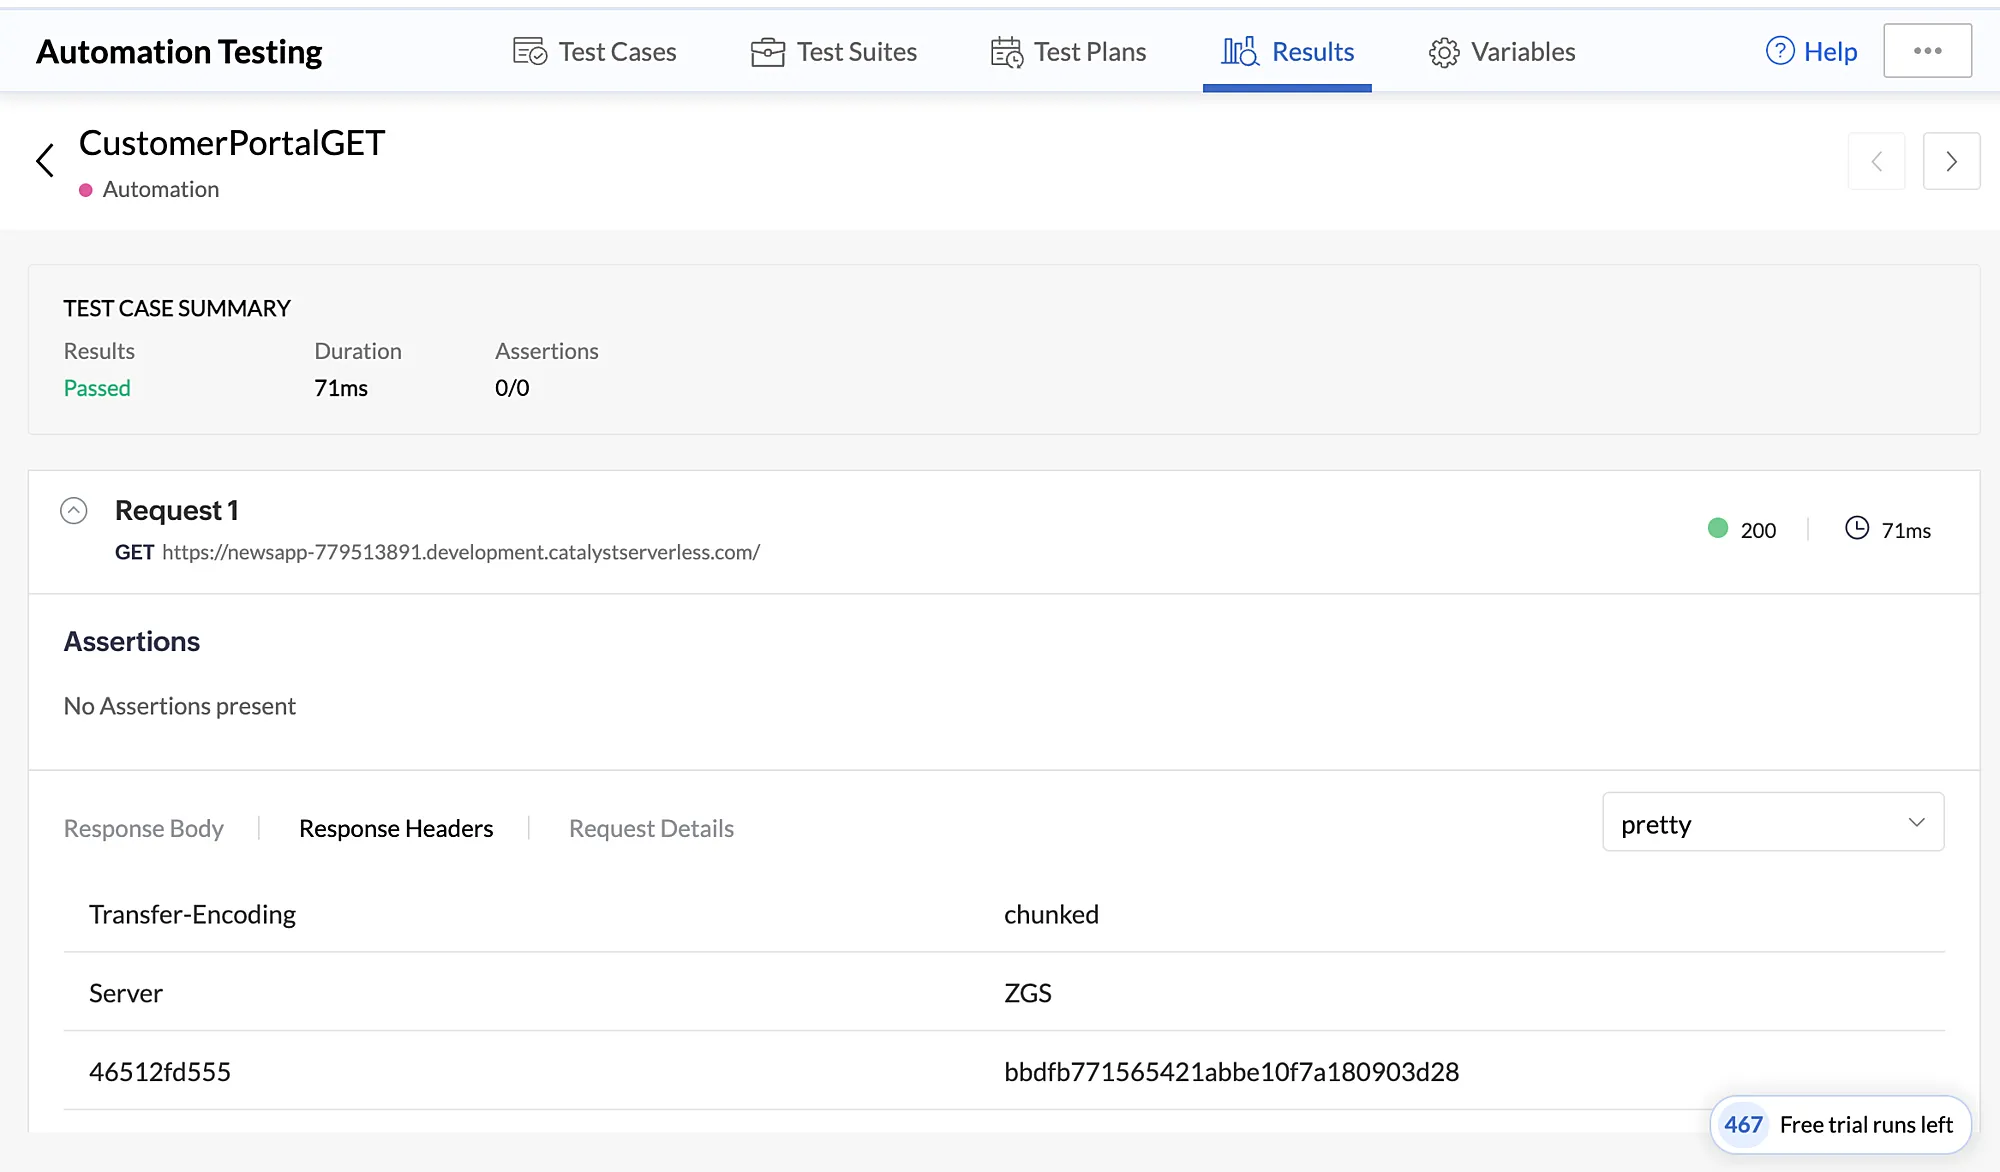
This drill down enables you to easily identify the exact request a test case failed on, with the specific reason.
You can navigate to view the details of the next test case using the arrows on the top-right corner.
Details of a Failed Test Run
As discussed earlier, in the event of a failed test run, an automatic re-run can be configured. The status and the details of the re-run can be viewed in the Results section.
In the Results section you can expand the failed test plan and get a useful overview of the number of test runs that were performed, number of test cases that were tested, their status, the duration, and the overall results. The overview of all the test runs and re-runs can be viewed here.
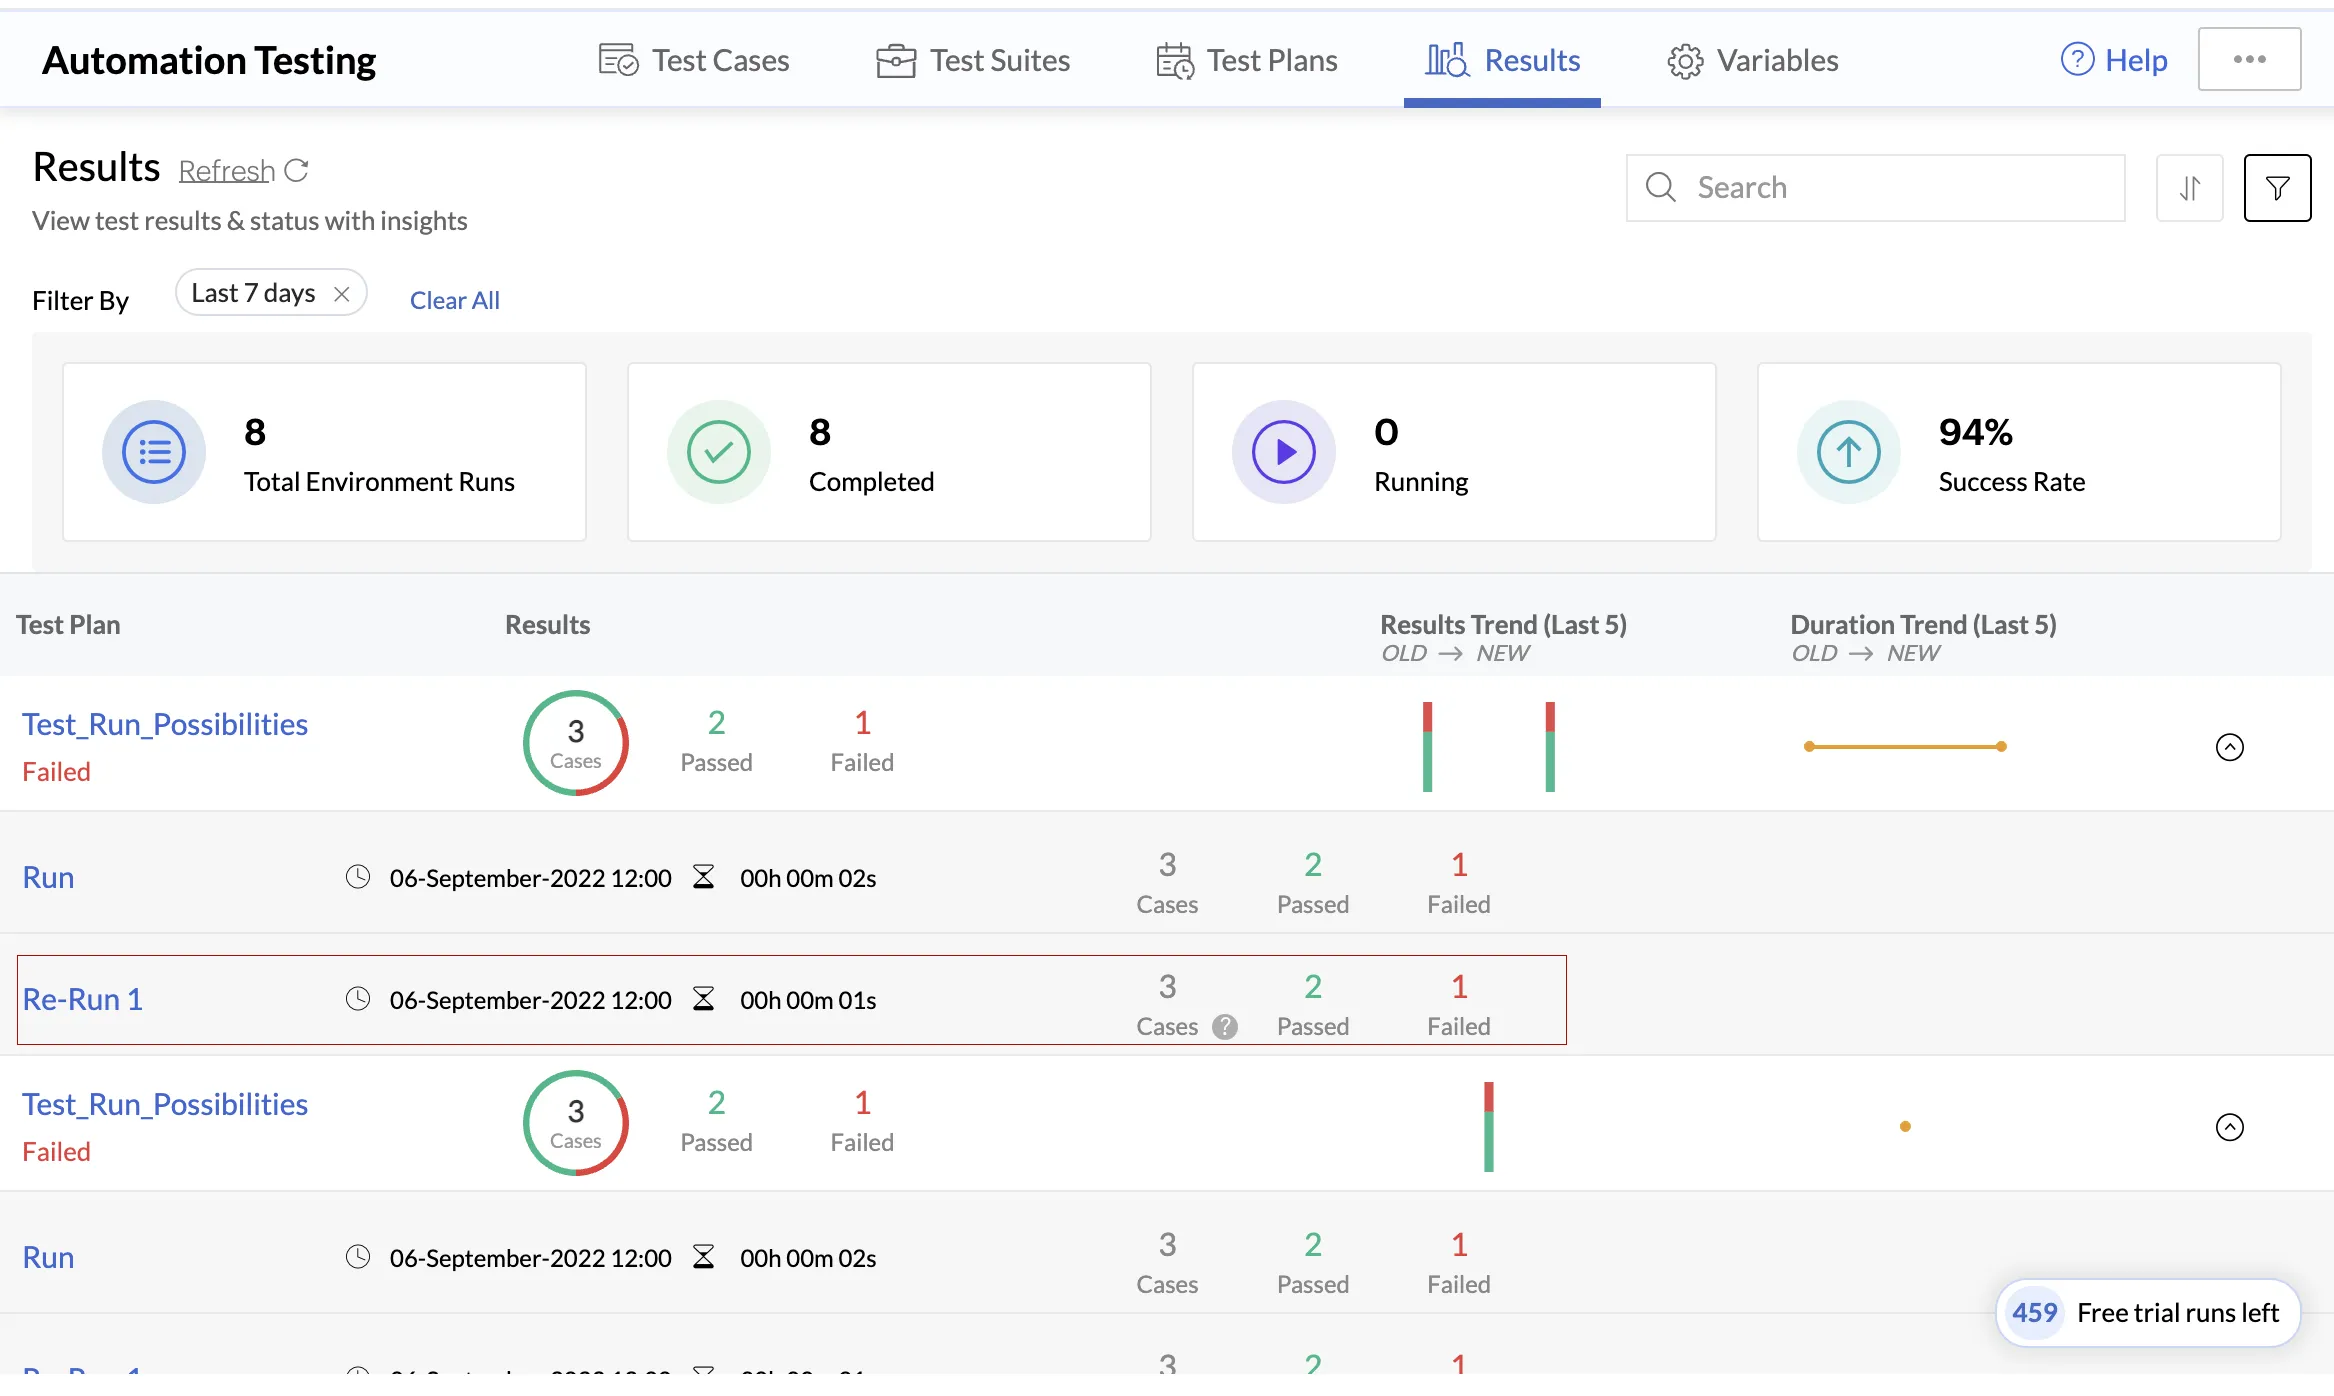
Re-Run 1 in this image denotes that an automatic re-run on failure was performed, and the overview of that test run is also displayed alongside.
You can click a particular failed test run to view a detailed report of it.
Details of a Particular Failed Test Run
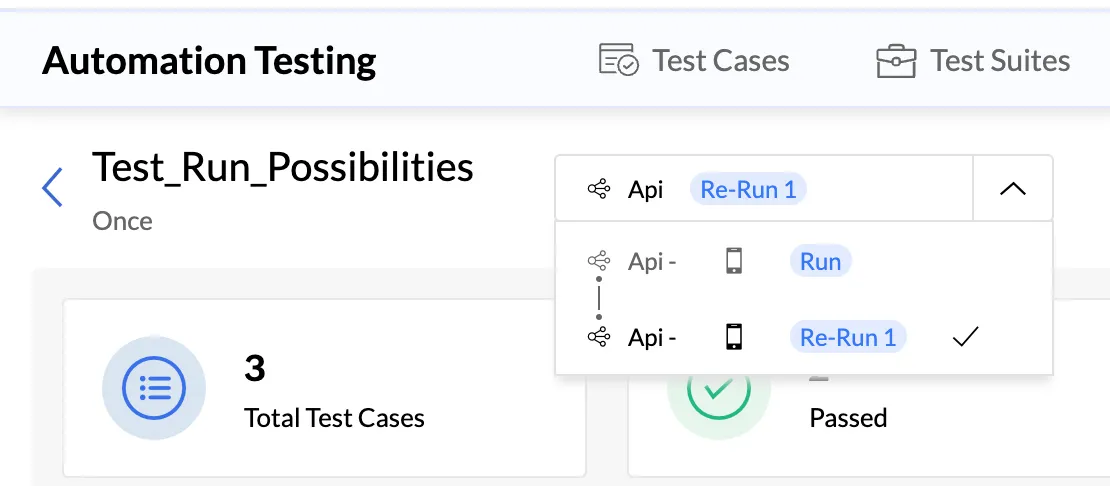
Once you click a failed test run, you can view all the overview stats present in the Results section, and view the status and the results of the Pre-Condition and the Post-Condition test cases as well, along with their details.
At the top of the screen, beside the name of the test plan, you can click the dropdown and select Re-Run 1 to view the status and results of the re-run that was automatically executed upon failure.
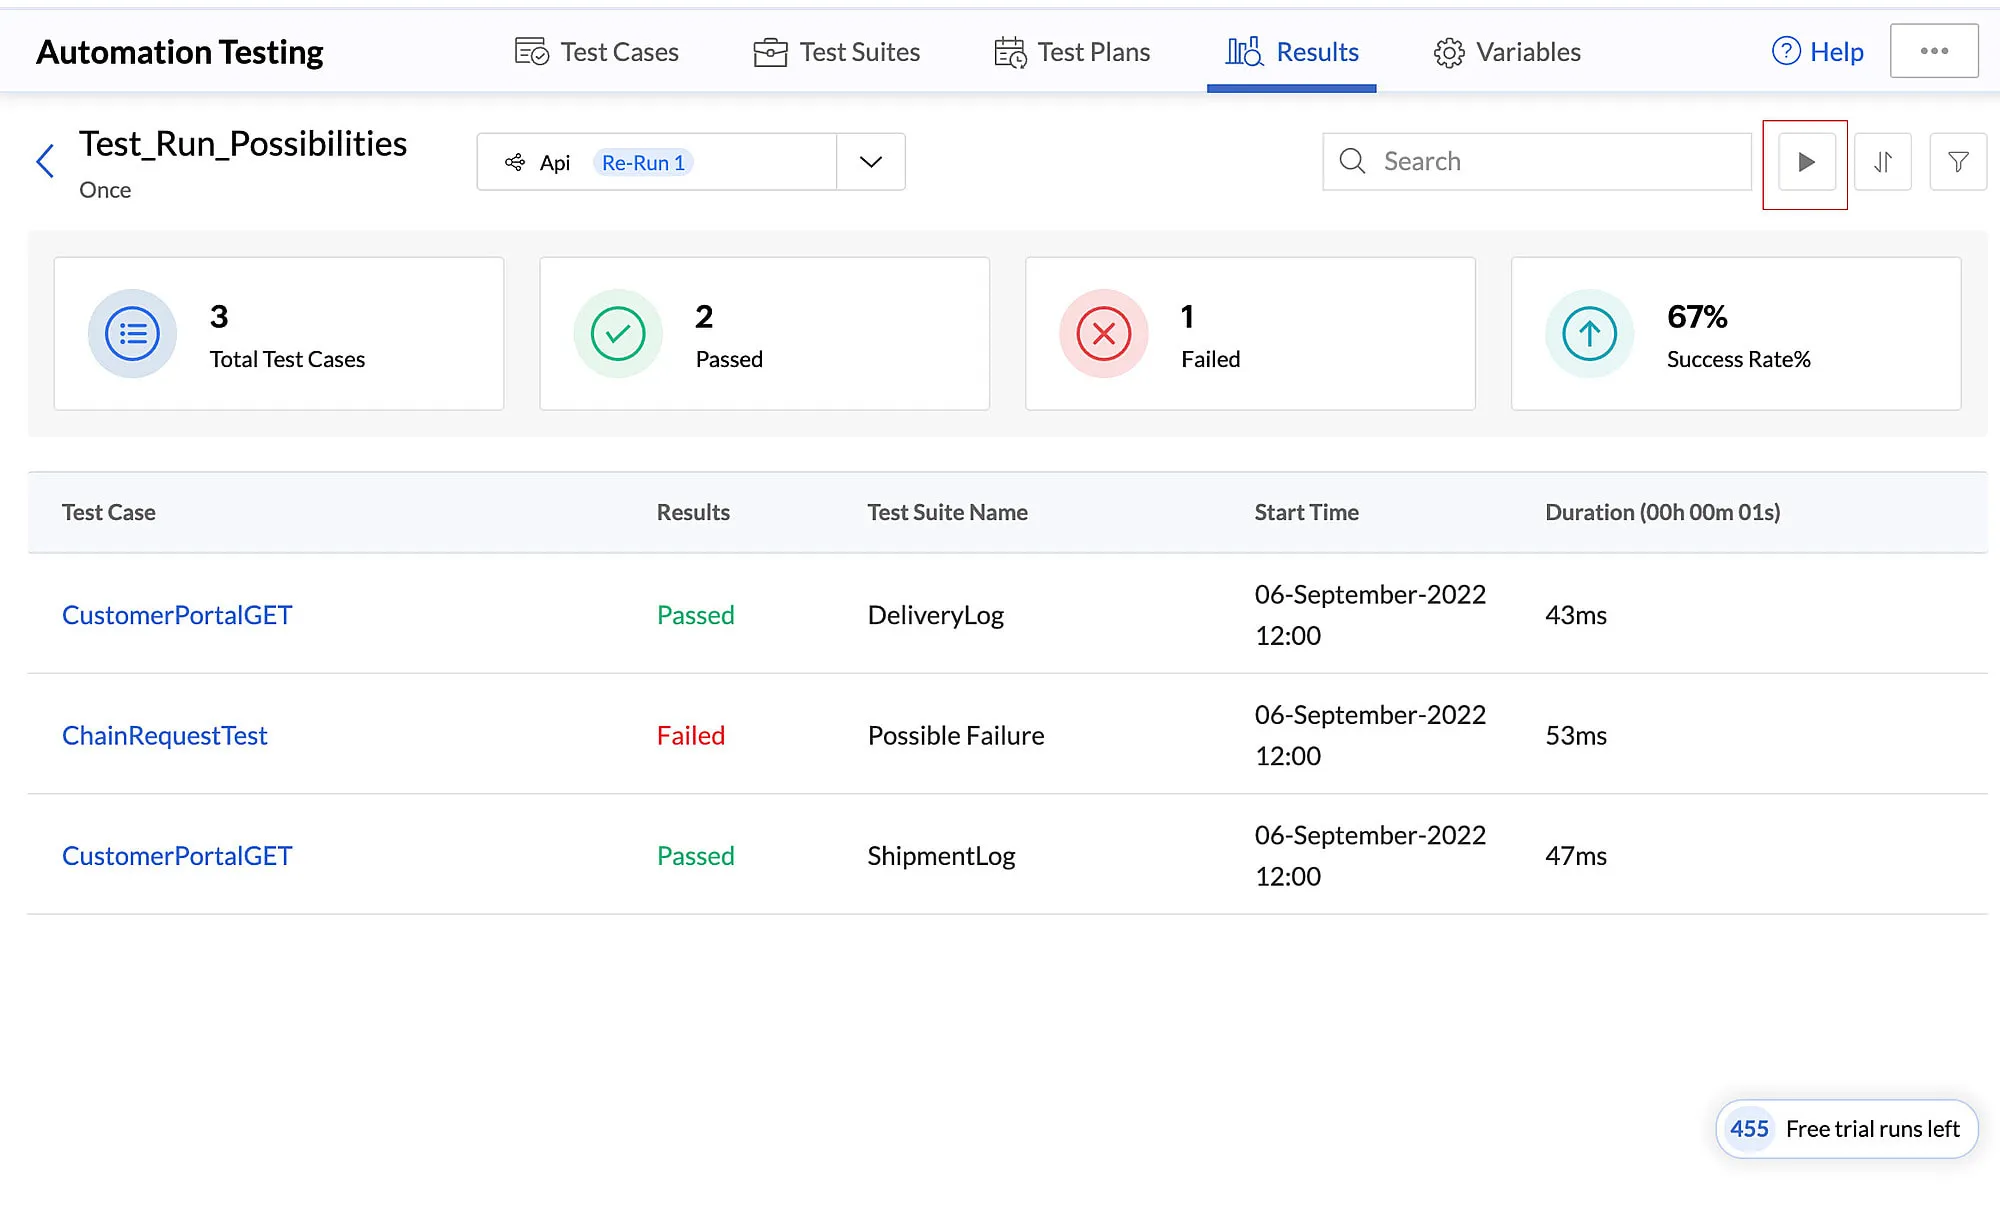
Manually Run a Test Plan with a Failed Re-Run
- If the re-run is also a failure, you can manually run the failed test plan by clicking the Run button on the top right-hand corner.
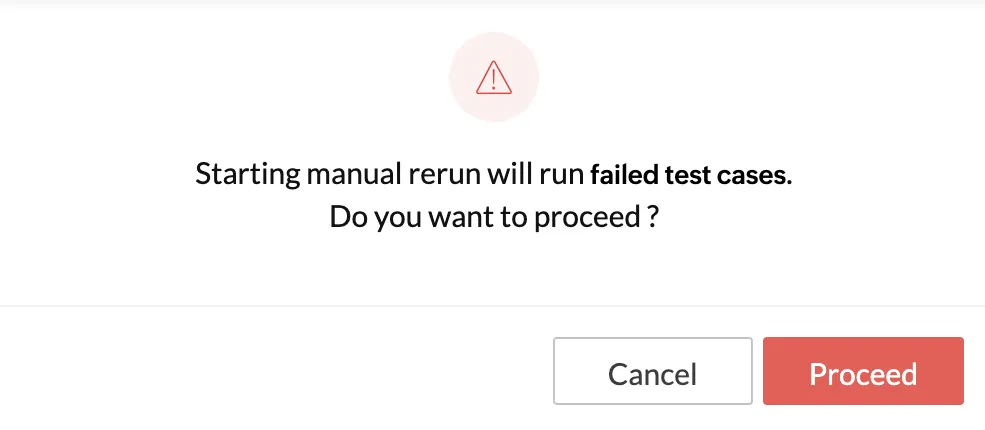
- Click Proceed to start a manual re-run.
Click the respective test plan on which you performed the manual re-run to view its status.
This drill down enables you to easily identify the exact request a test case failed on with the details.
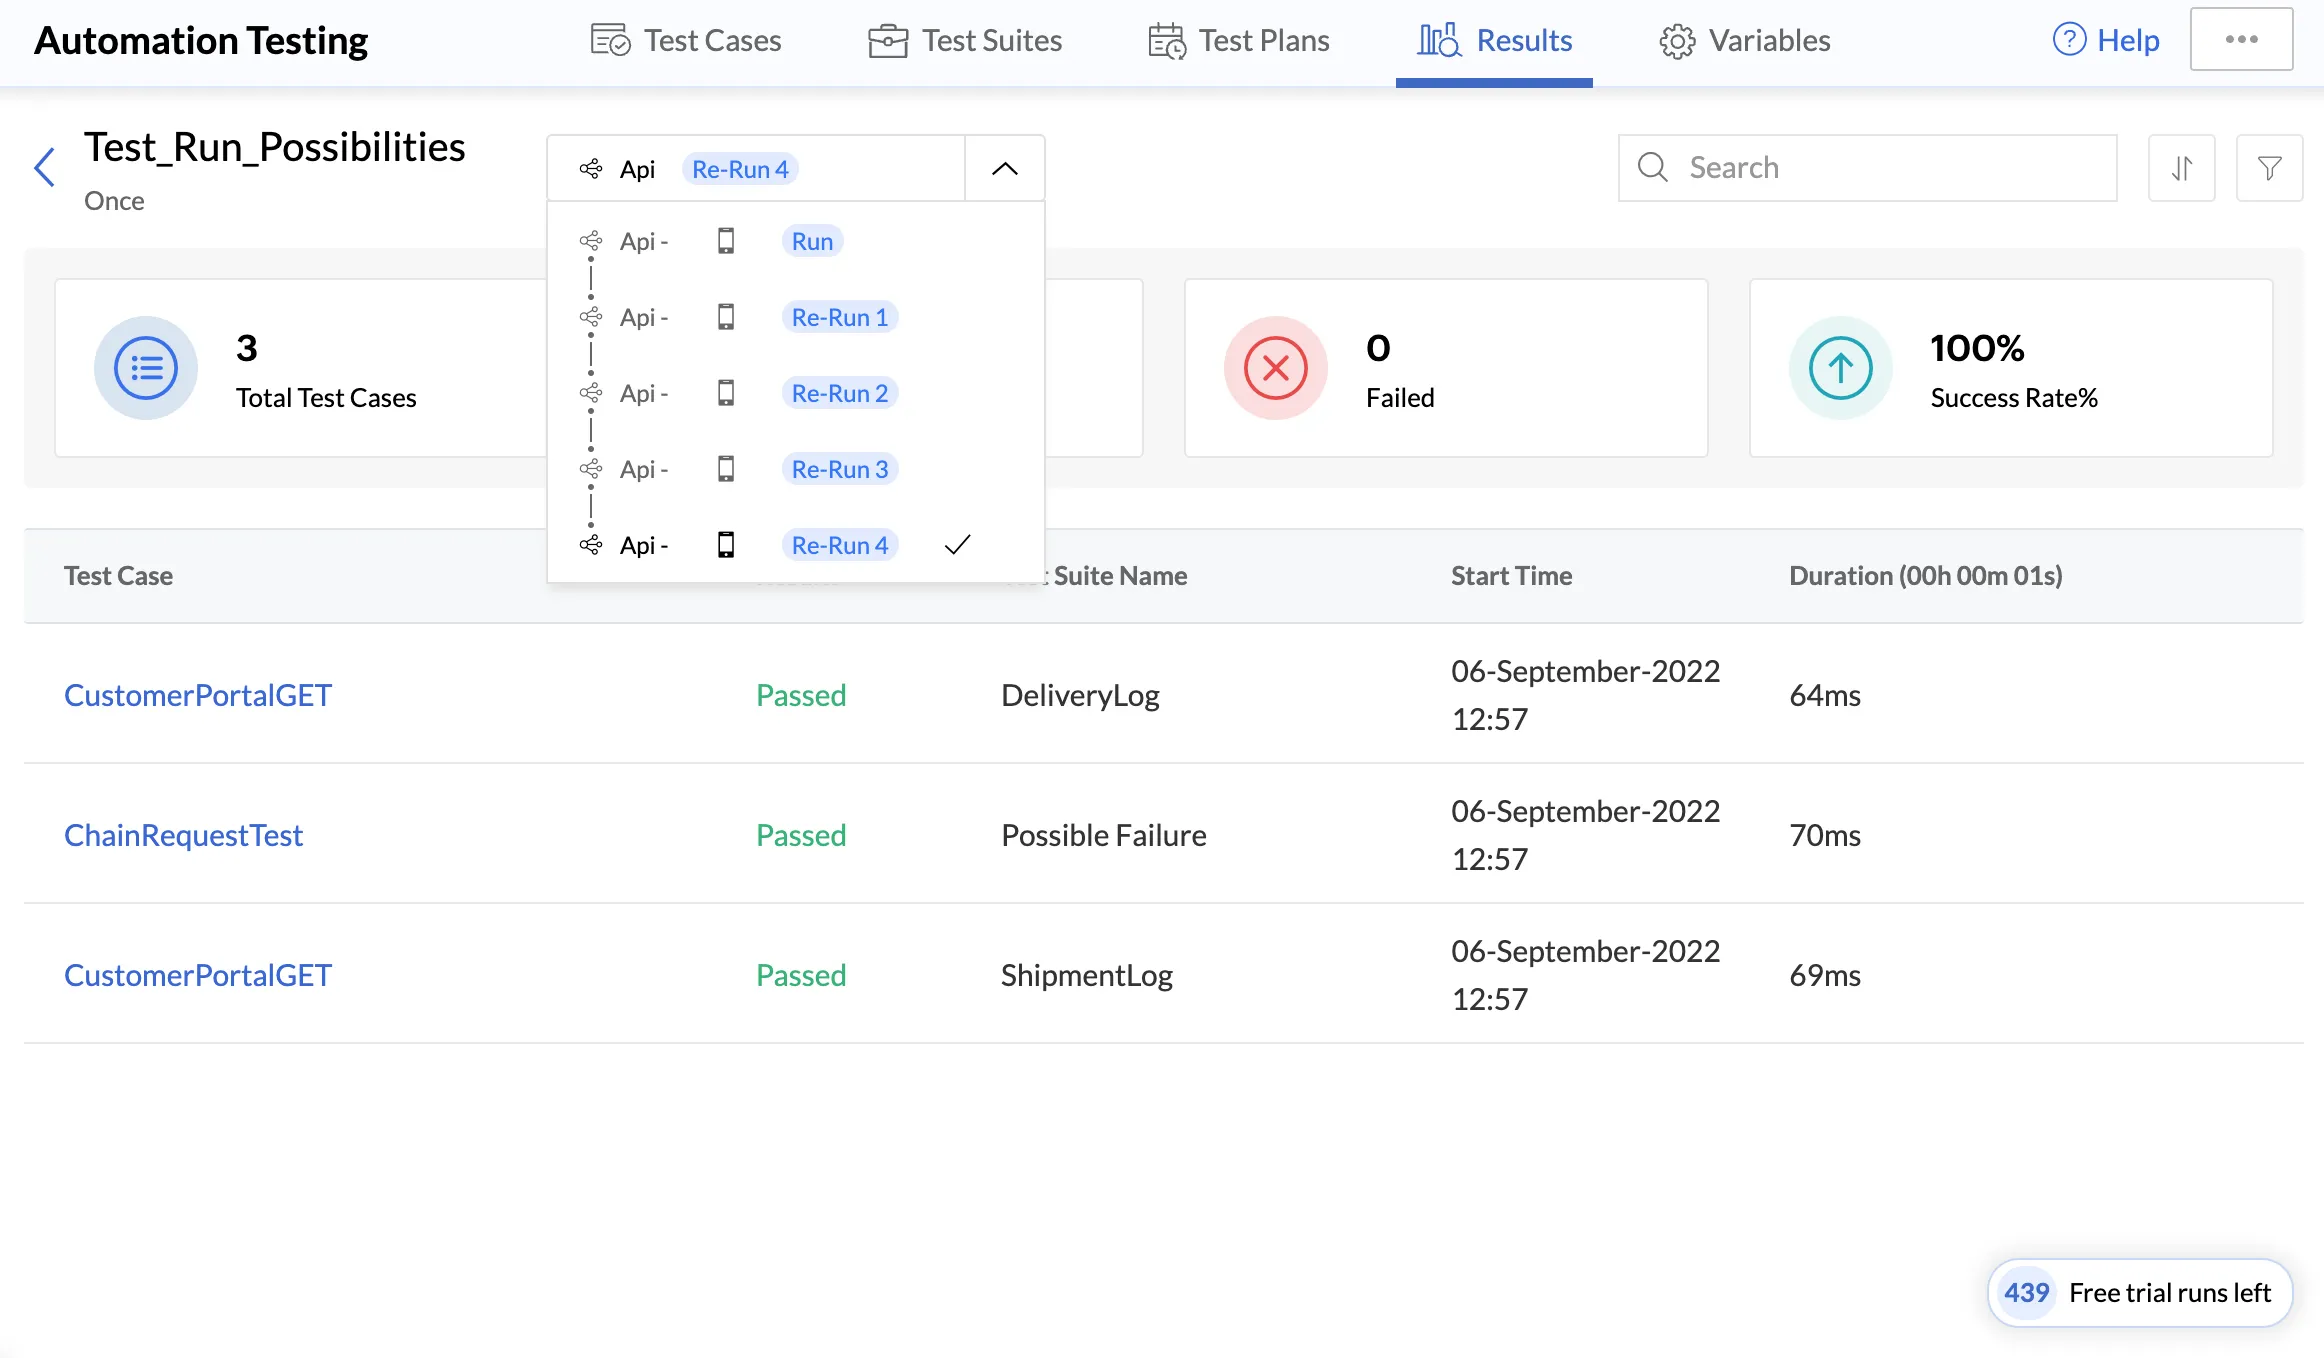
You can re-run a failed test plan any number of times in the same way, until its execution is a success. If its execution succeeds, the run button will no longer be displayed in this section. The detailed log of all the previous test cases be viewed by clicking the drop-down selection and choosing the required test run.
Last Updated 2025-03-06 20:18:17 +0530 IST
Yes
No
Send your feedback to us