Application Logs
Application logs display the log details of the internal application layer in the gateway of a function’s execution. The internal layer of the gateway, as explained in the Access Logs section, logs application-level details. This includes details related to the processing of the function, such as the messages passed to the logs at particular instances, log severity levels, etc.
This internal application-level logging applies to both functions that were invoked manually by a user or executed internally by the application. An example of an internal function execution is, a daily Cron execution that triggers the invocation of a Cron function automatically everyday. Log details of such functions are also included in the Application logs.
Application logs therefore contain execution logs of all function types, including Event and Cron functions.
Log Levels of Java, Node.js and Python Functions
Application logs include log levels that indicate the severity of an error event in a function execution. As mentioned in the Pushing to Logs section, you can assign an appropriate log level to an event or an error when you code the function. The log levels differ based on the function stack, i.e., Java, Node.js or Python functions.
The log levels of Java platform supported by Catalyst that you can use in your functions are:
- Severe: Indicates a serious failure
- Warning: Indicates a potential problem
- Info: Indicates an informational message
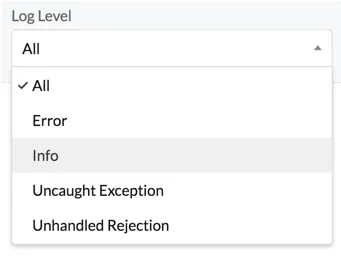
The log levels that you can use in Node.js functions are:
- Error: Indicates an unexpected error
- Info: Indicates an informational message
- Warning: Indicates a potential problem
- Debug: Indicates information about troubleshooting and testing the application
The log levels of Python platform supported by Catalyst include:
- Critical: Indicates an event that can be recovered from.
- Error: Indicates an unexpected error
- Warning: Indicates a potential problem
- Info: Indicates an informational message
- Debug: Indicates information about troubleshooting and testing the application.
You can use select one of these log levels in the filters to fetch execution results of that level alone.
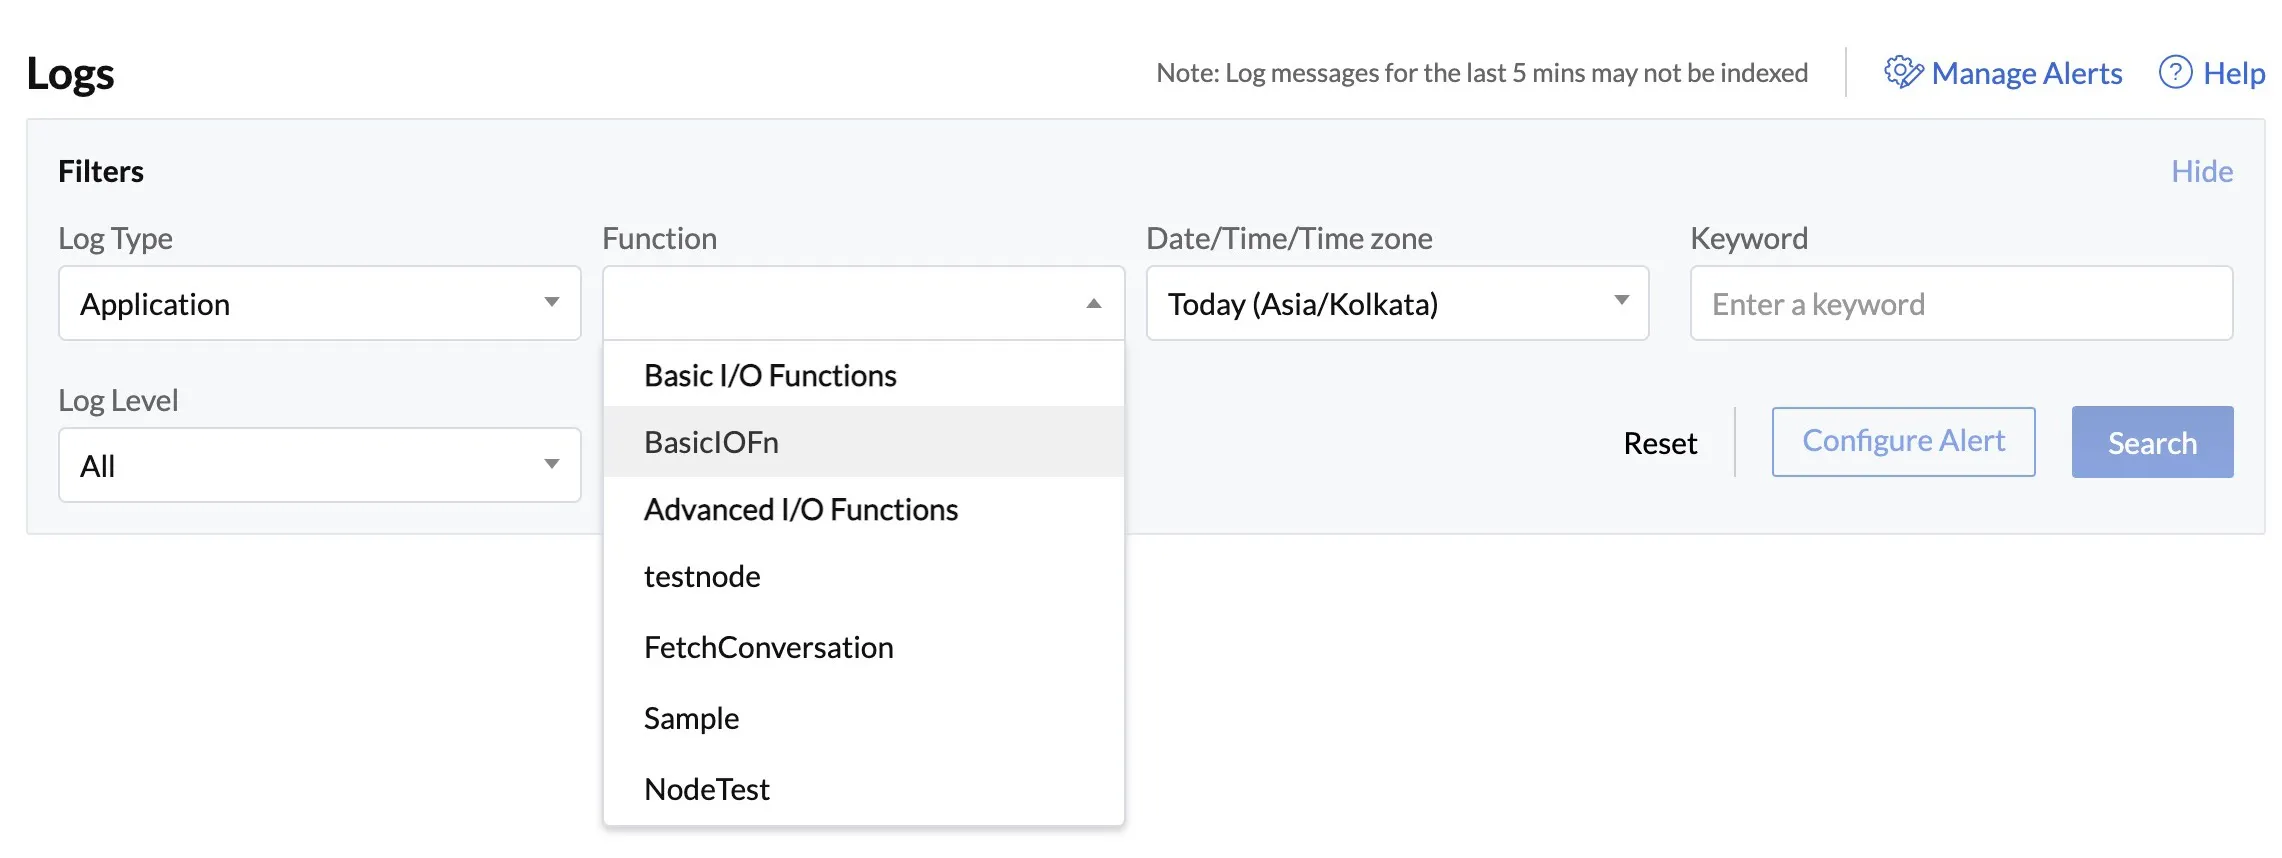
Application Log Filters
Application logs include some more filters in addition to the Access log filters. The filters available for Application logs are shown below.
The Log Type, Date/Time/Time Zone, and Keyword filters are the same as the Access log filters.
- Function: The Function filter in Application logs lists functions of all types. You must select one or more functions from this dropdown list to view their logs.
- Log Level: Log Level: Based on the functions that you select, the log levels of Java or Node.js functions are shown. If you select functions of both Java and Node.js in the Function dropdown, a mixture of both Java and Node.js log levels will be available in this dropdown. Relevant details of each function will be shown in the results.
- Execution ID: When a Cron or an Event function executes, a unique Execution ID is associated with each execution. You can filter the logs by providing this Execution ID, and fetch that particular execution alone.
The execution history section of an Event Listener or a Cron also contains a direct access to Logs. You can select a particular execution, and click on the View Logs button to open Logs from there.
Click Search after you set the filters.
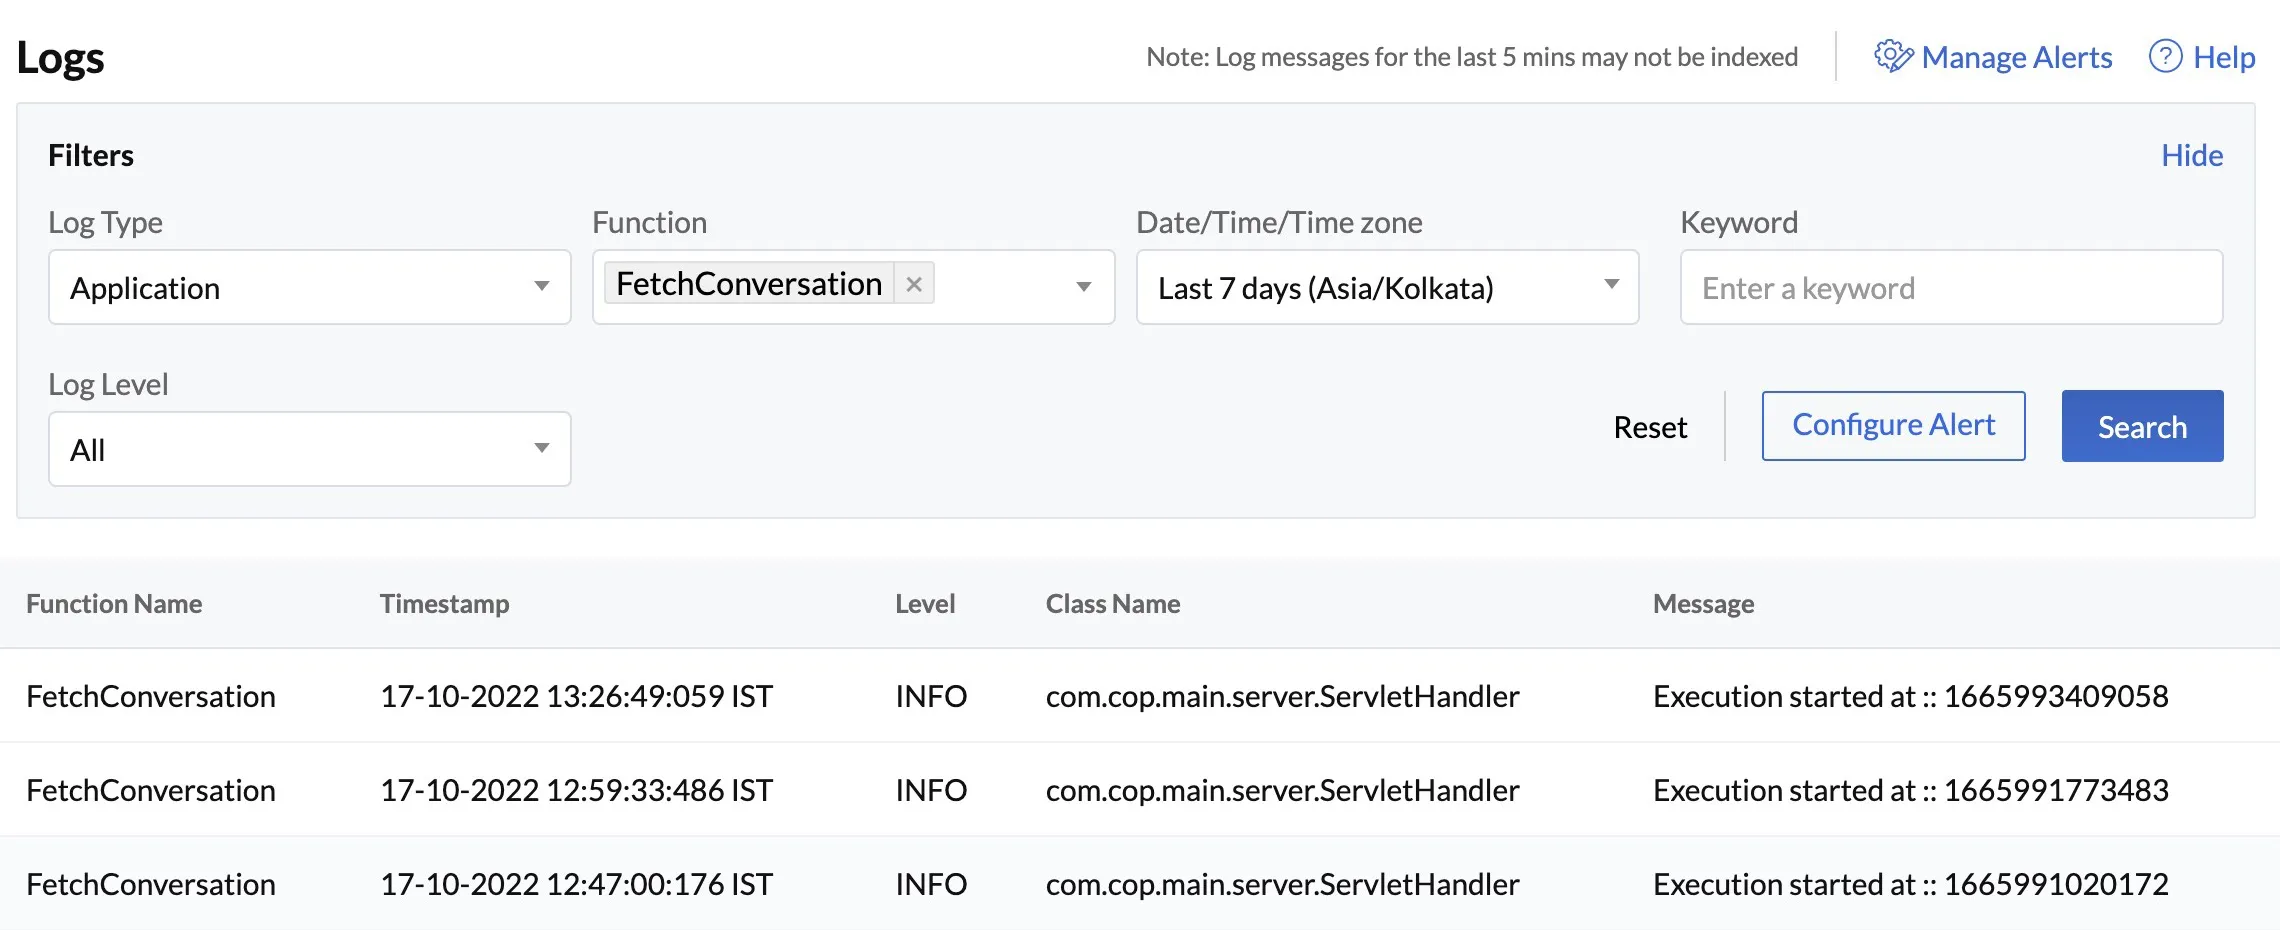
Application Log Results
The results of Application logs will contain information relating to the internal application layer, such as the function name, time of execution, log level, and the messages pushed by the developers when specific events occur.
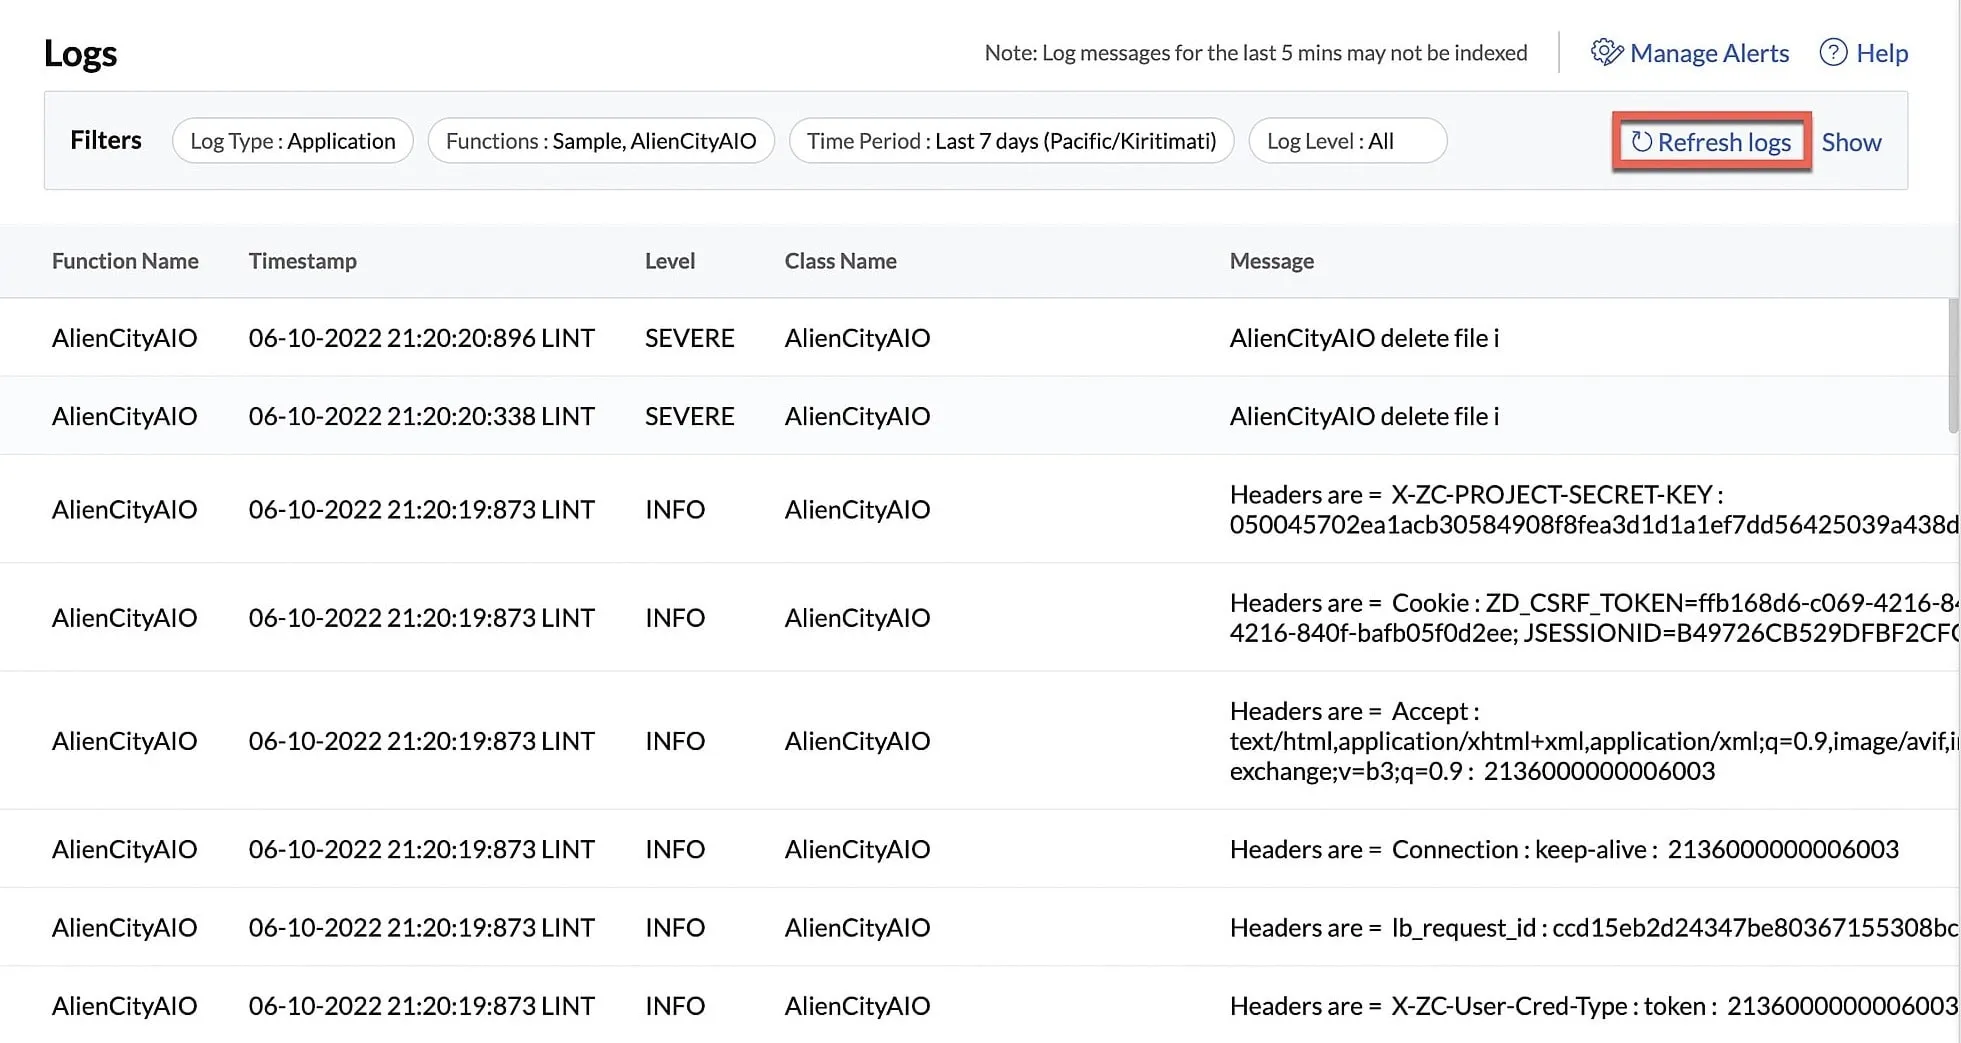
When the filter section is hidden, the results page shows a Refresh Logs button. You can click this to obtain the latest log results.
Last Updated 2025-03-06 20:18:17 +0530 IST
Yes
No
Send your feedback to us