Access Logs
Access logs include the log details of an external access layer of a function’s execution.
Consider a gateway with two layers that need to be passed, to access and execute a Catalyst function. Access logs show relevant details of the function’s invocation and execution about the external access layer in this gateway. These details include the User ID of the user invoking the function, the HTTP request method used to invoke the function, and more. The details of the response in this external layer are also shown in these logs, such as the response status, response time, etc.
The functions that can be manually invoked by a user are the ones that pass through this external access layer. This includes only Basic I/O, Advanced I/O, Integration and Browser Logic function executions in your application, as they can be invoked manually by the users. Integration functions are not invoked through a Function URL like Basic or Advanced I/O functions, but they are still accessed through external means by the users that call upon the integration service. Therefore, these function types are included in Access logs.
Event and Cron functions cannot be accessed through an endpoint and do not pass through this layer. They directly pass through the Application layer. Therefore, Event and Cron function executions will not be included in the Access logs. They will only be included in the Application logs.
To open the logs for your Catalyst project, navigate to the Host and Manage section in the Catalyst console, then click Logs.
Access Log Filters
The Access logs and Application logs contain different sets of filters that you can use to filter the log data that are displayed.
The filters available for Access logs are shown below.
-
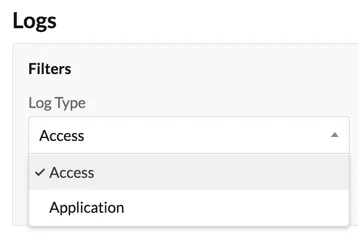
Log Type: You must select Access or Application log type to view the respective logs. The other filters will change slightly based on the type you select.

-
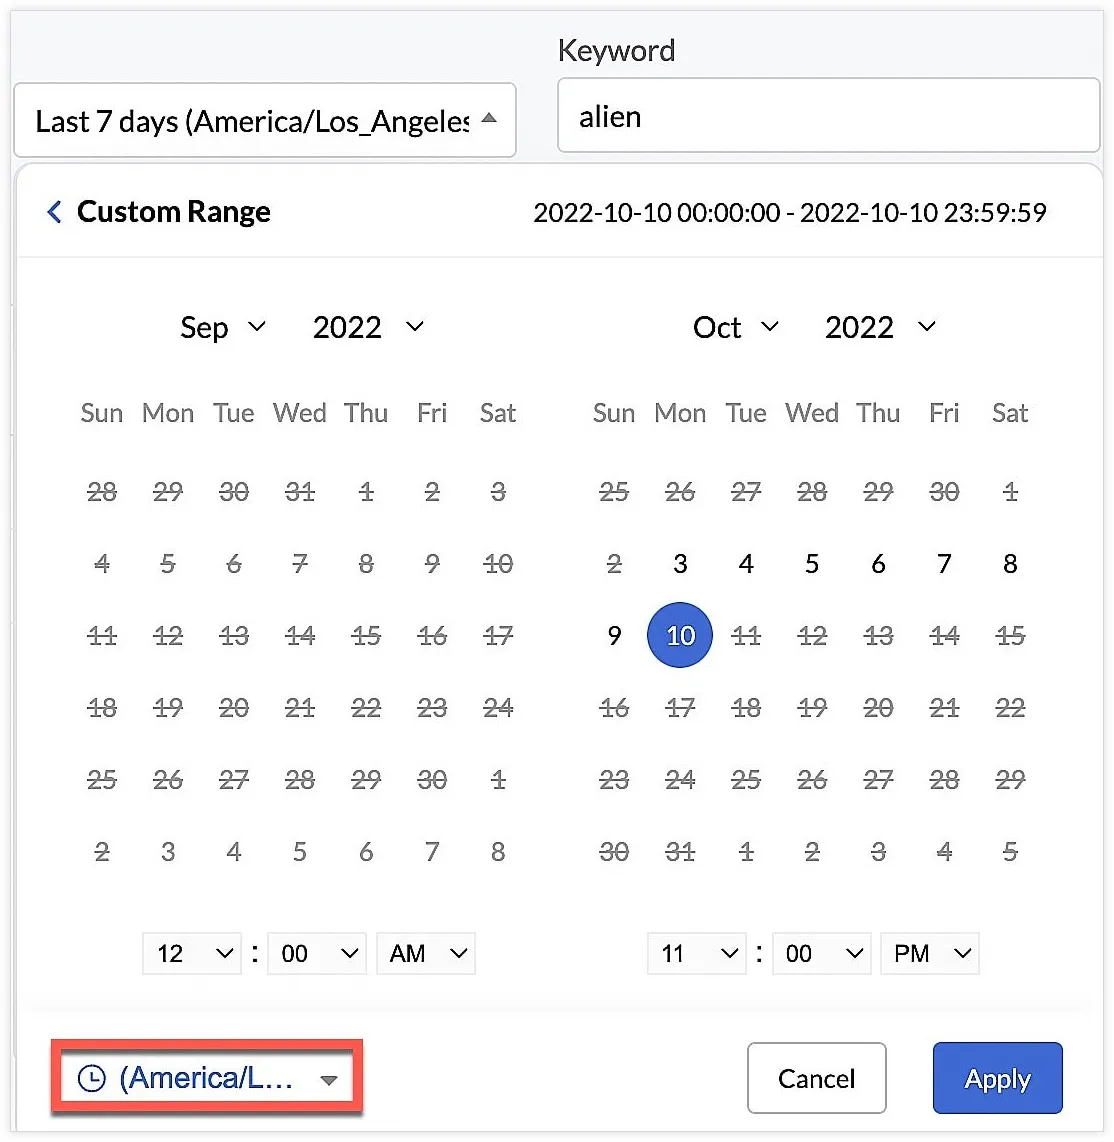
Date/Time/Time zone: You can select a time period of logs to show from the variety of options in the Date/Time dropdown list.

You can also select a custom time range from a calendar, by clicking on the dates that you require and entering the time. Click Apply after the selection.
You can select a preferred time zone by clicking the dropdown. Click Apply after the selection.
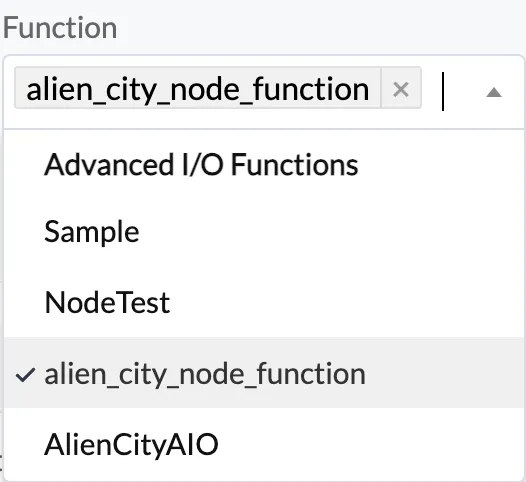
- Function: You must select one or more functions from this dropdown list to view their logs. The Access logs only list Basic I/O, Advanced I/O, Integration, and Browser Logic functions.

- Keyword: You can also search for a specific keyword that you might have included in your log message while writing the function, to view logs that include this keyword.

For example, to access the execution logs of a function that contains a specific path in its request URL, you can enter that path as the keyword and search for the logs.
Click Search after you set the filters.
Access Log Results
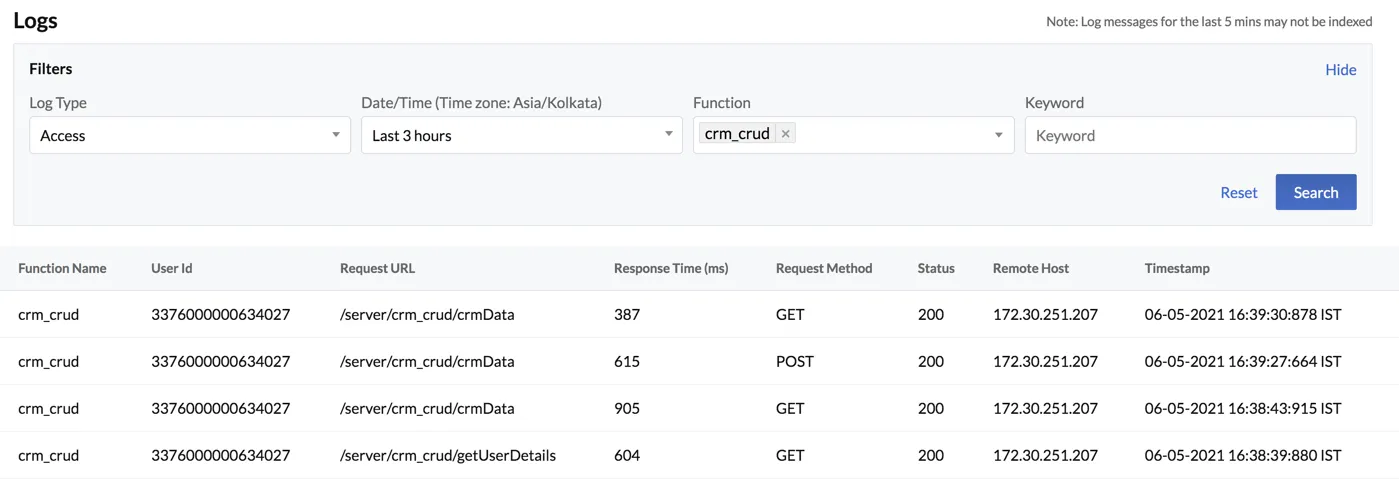
The results of Access logs will contain information relating to the external access layer such as the function name, User ID of the user who invoked it, the invocation URL, time of execution, request method, the host address, and response details such as the HTTP response status and response time.
The logs are generally indexed instantly, but there could be a 5 minute delay in indexing in some cases. When the filter section is hidden, the results page shows a Refresh Logs button. You can click this to obtain the latest log results.
Last Updated 2025-02-19 15:51:40 +0530 IST
Yes
No
Send your feedback to us


