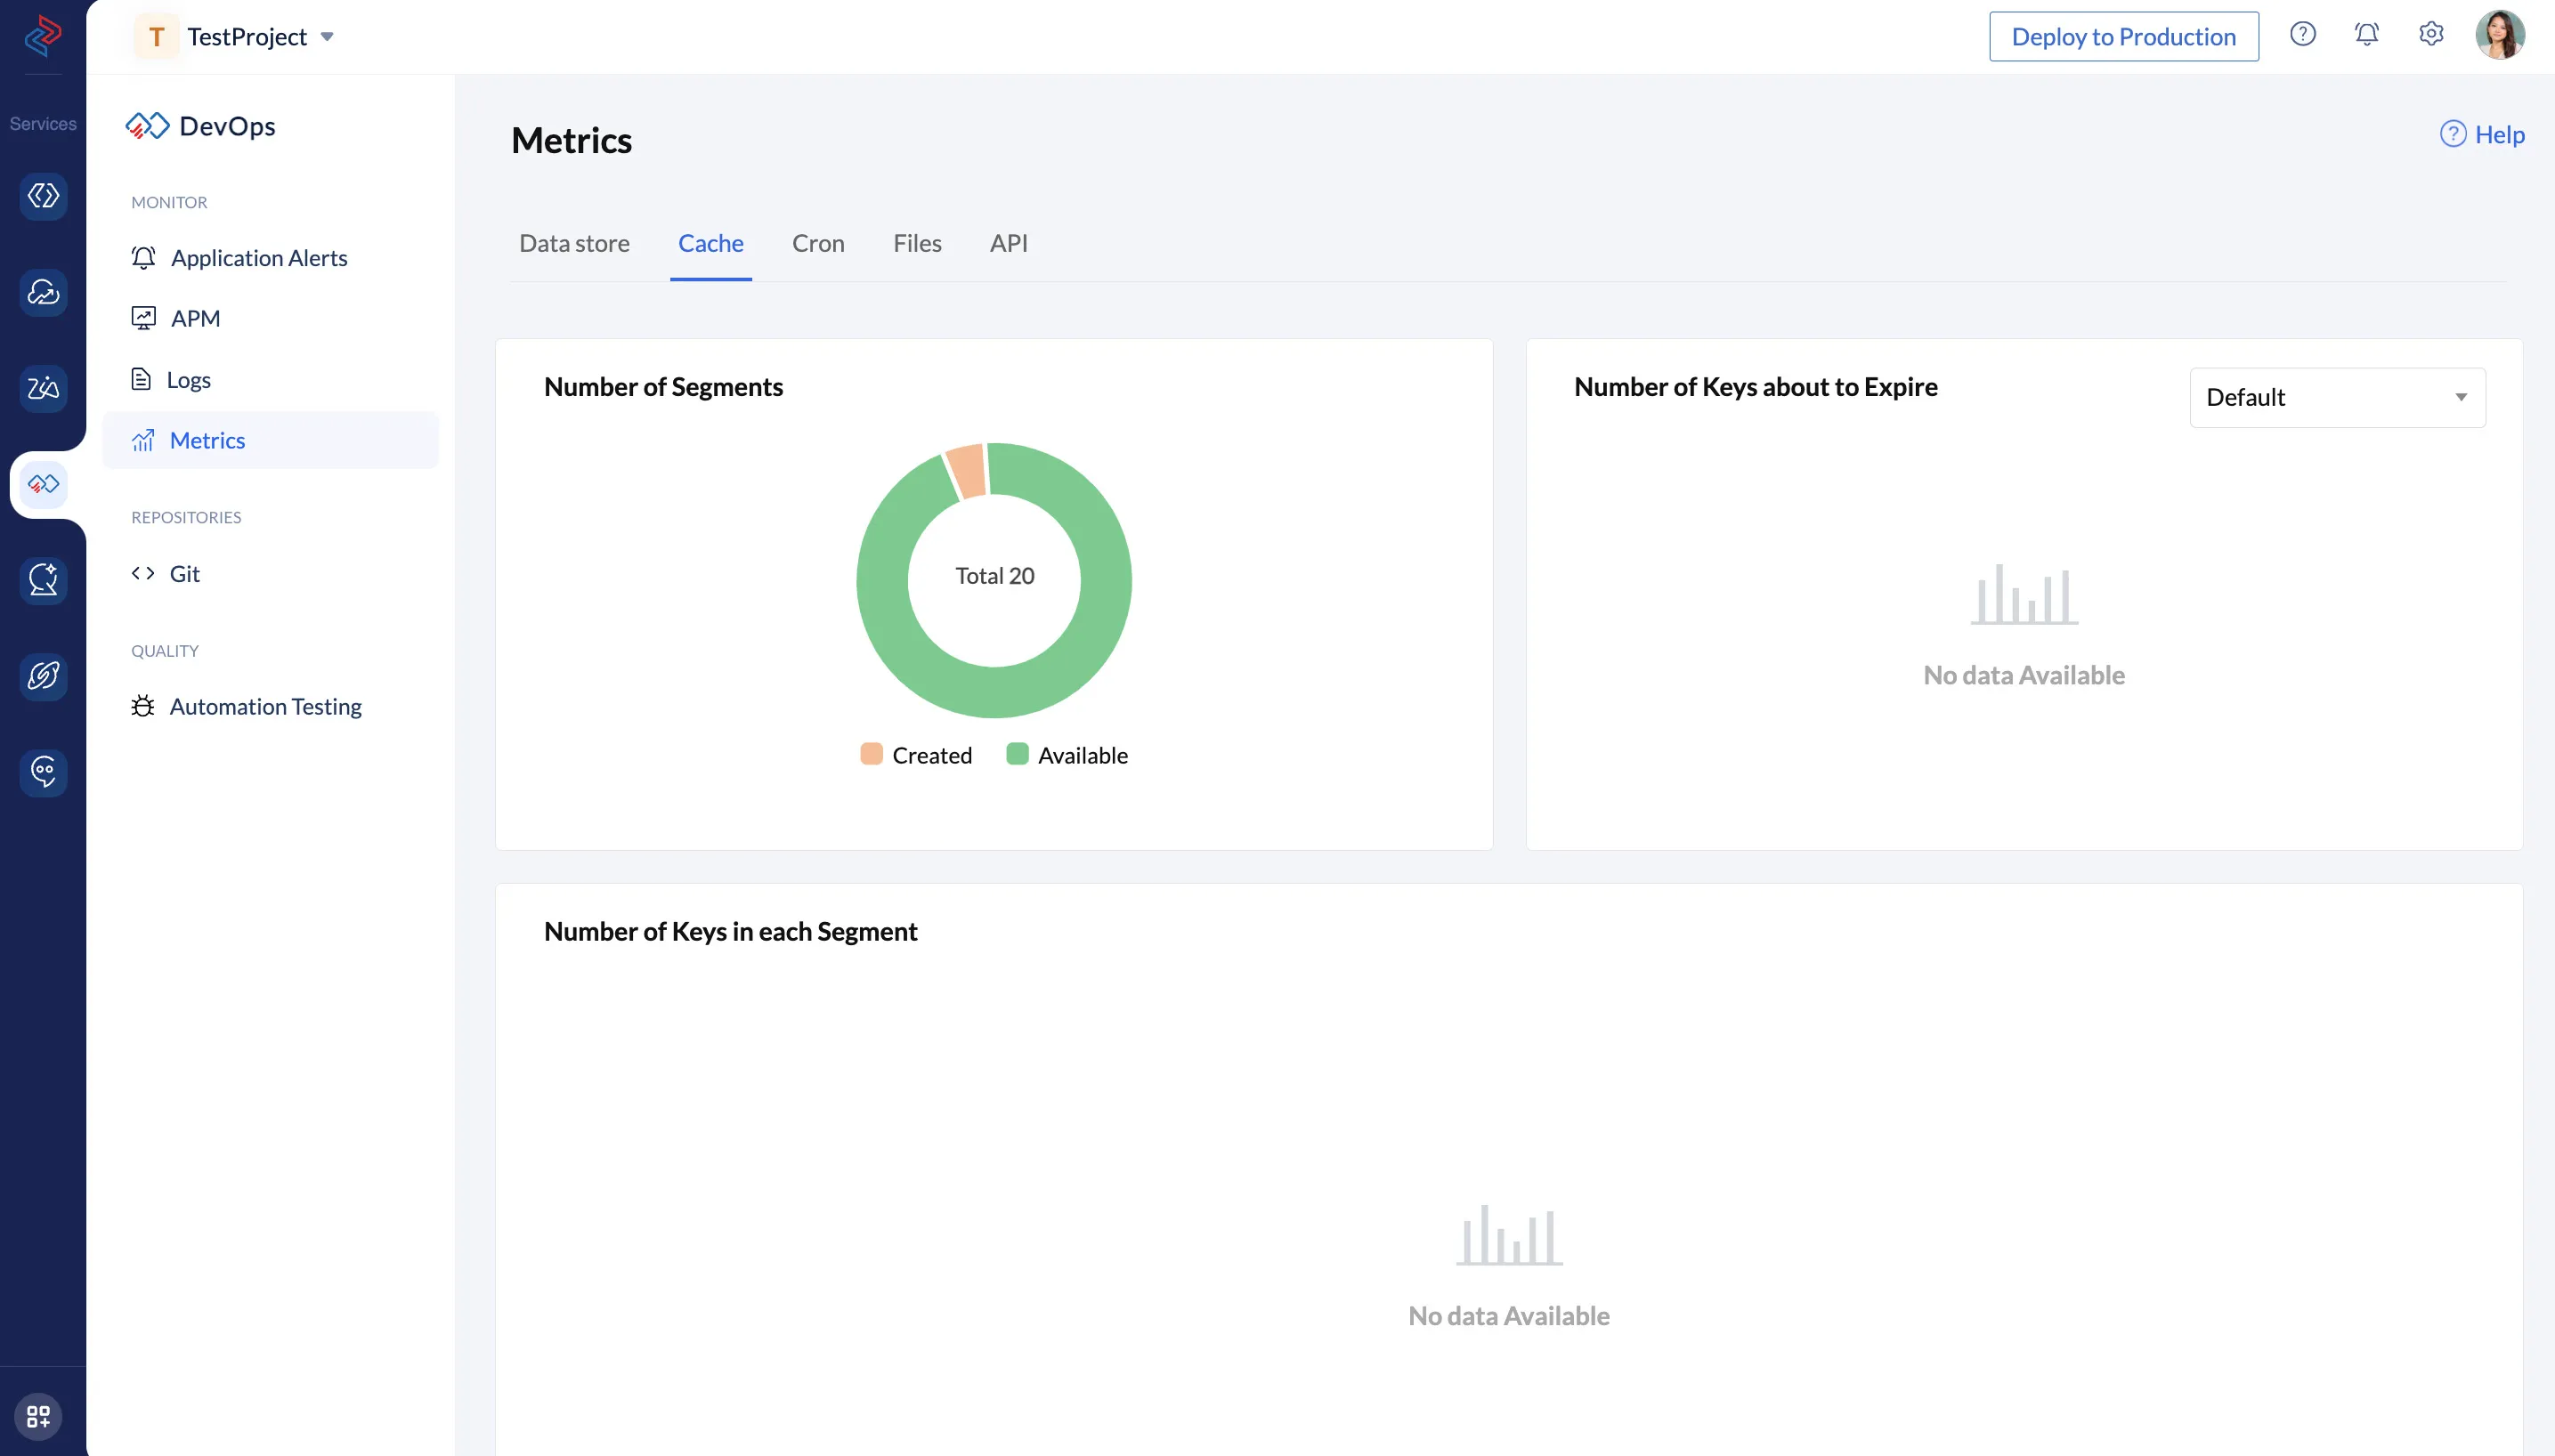
Metrics
Introduction
Metrics is a Catalyst DevOps component that displays the usage information of your project components in Catalyst. This usage information allows you to track the performance of the components and detect anomalies in their behavior. It can also be used to keep track of your resource usage and to check if they are about to be exhausted.
You can learn more about the other components of the DevOps service from this page.
The usage information is displayed in graphical format, such as a pie chart or bar graph, which helps you understand and interpret the information more easily. You can also hover over graphs or diagrams to access tooltips for that element.
To access metrics, navigate to DevOps in the left pane of the Catalyst console and click Metrics. The Metrics page displays usage statistics for the following components: Data Store, Cache, Cron, Files, and API.
Last Updated 2025-02-19 15:51:40 +0530 IST
Yes
No
Send your feedback to us
