SmartBrowz Dashboard
The SmartBrowz Dashboard is an informative tool that will provide you with a crisp overview on the activities of all the SmartBrowz components.
Access The SmartBrowz Dashboard
To access the SmartBrowz Dashboard:
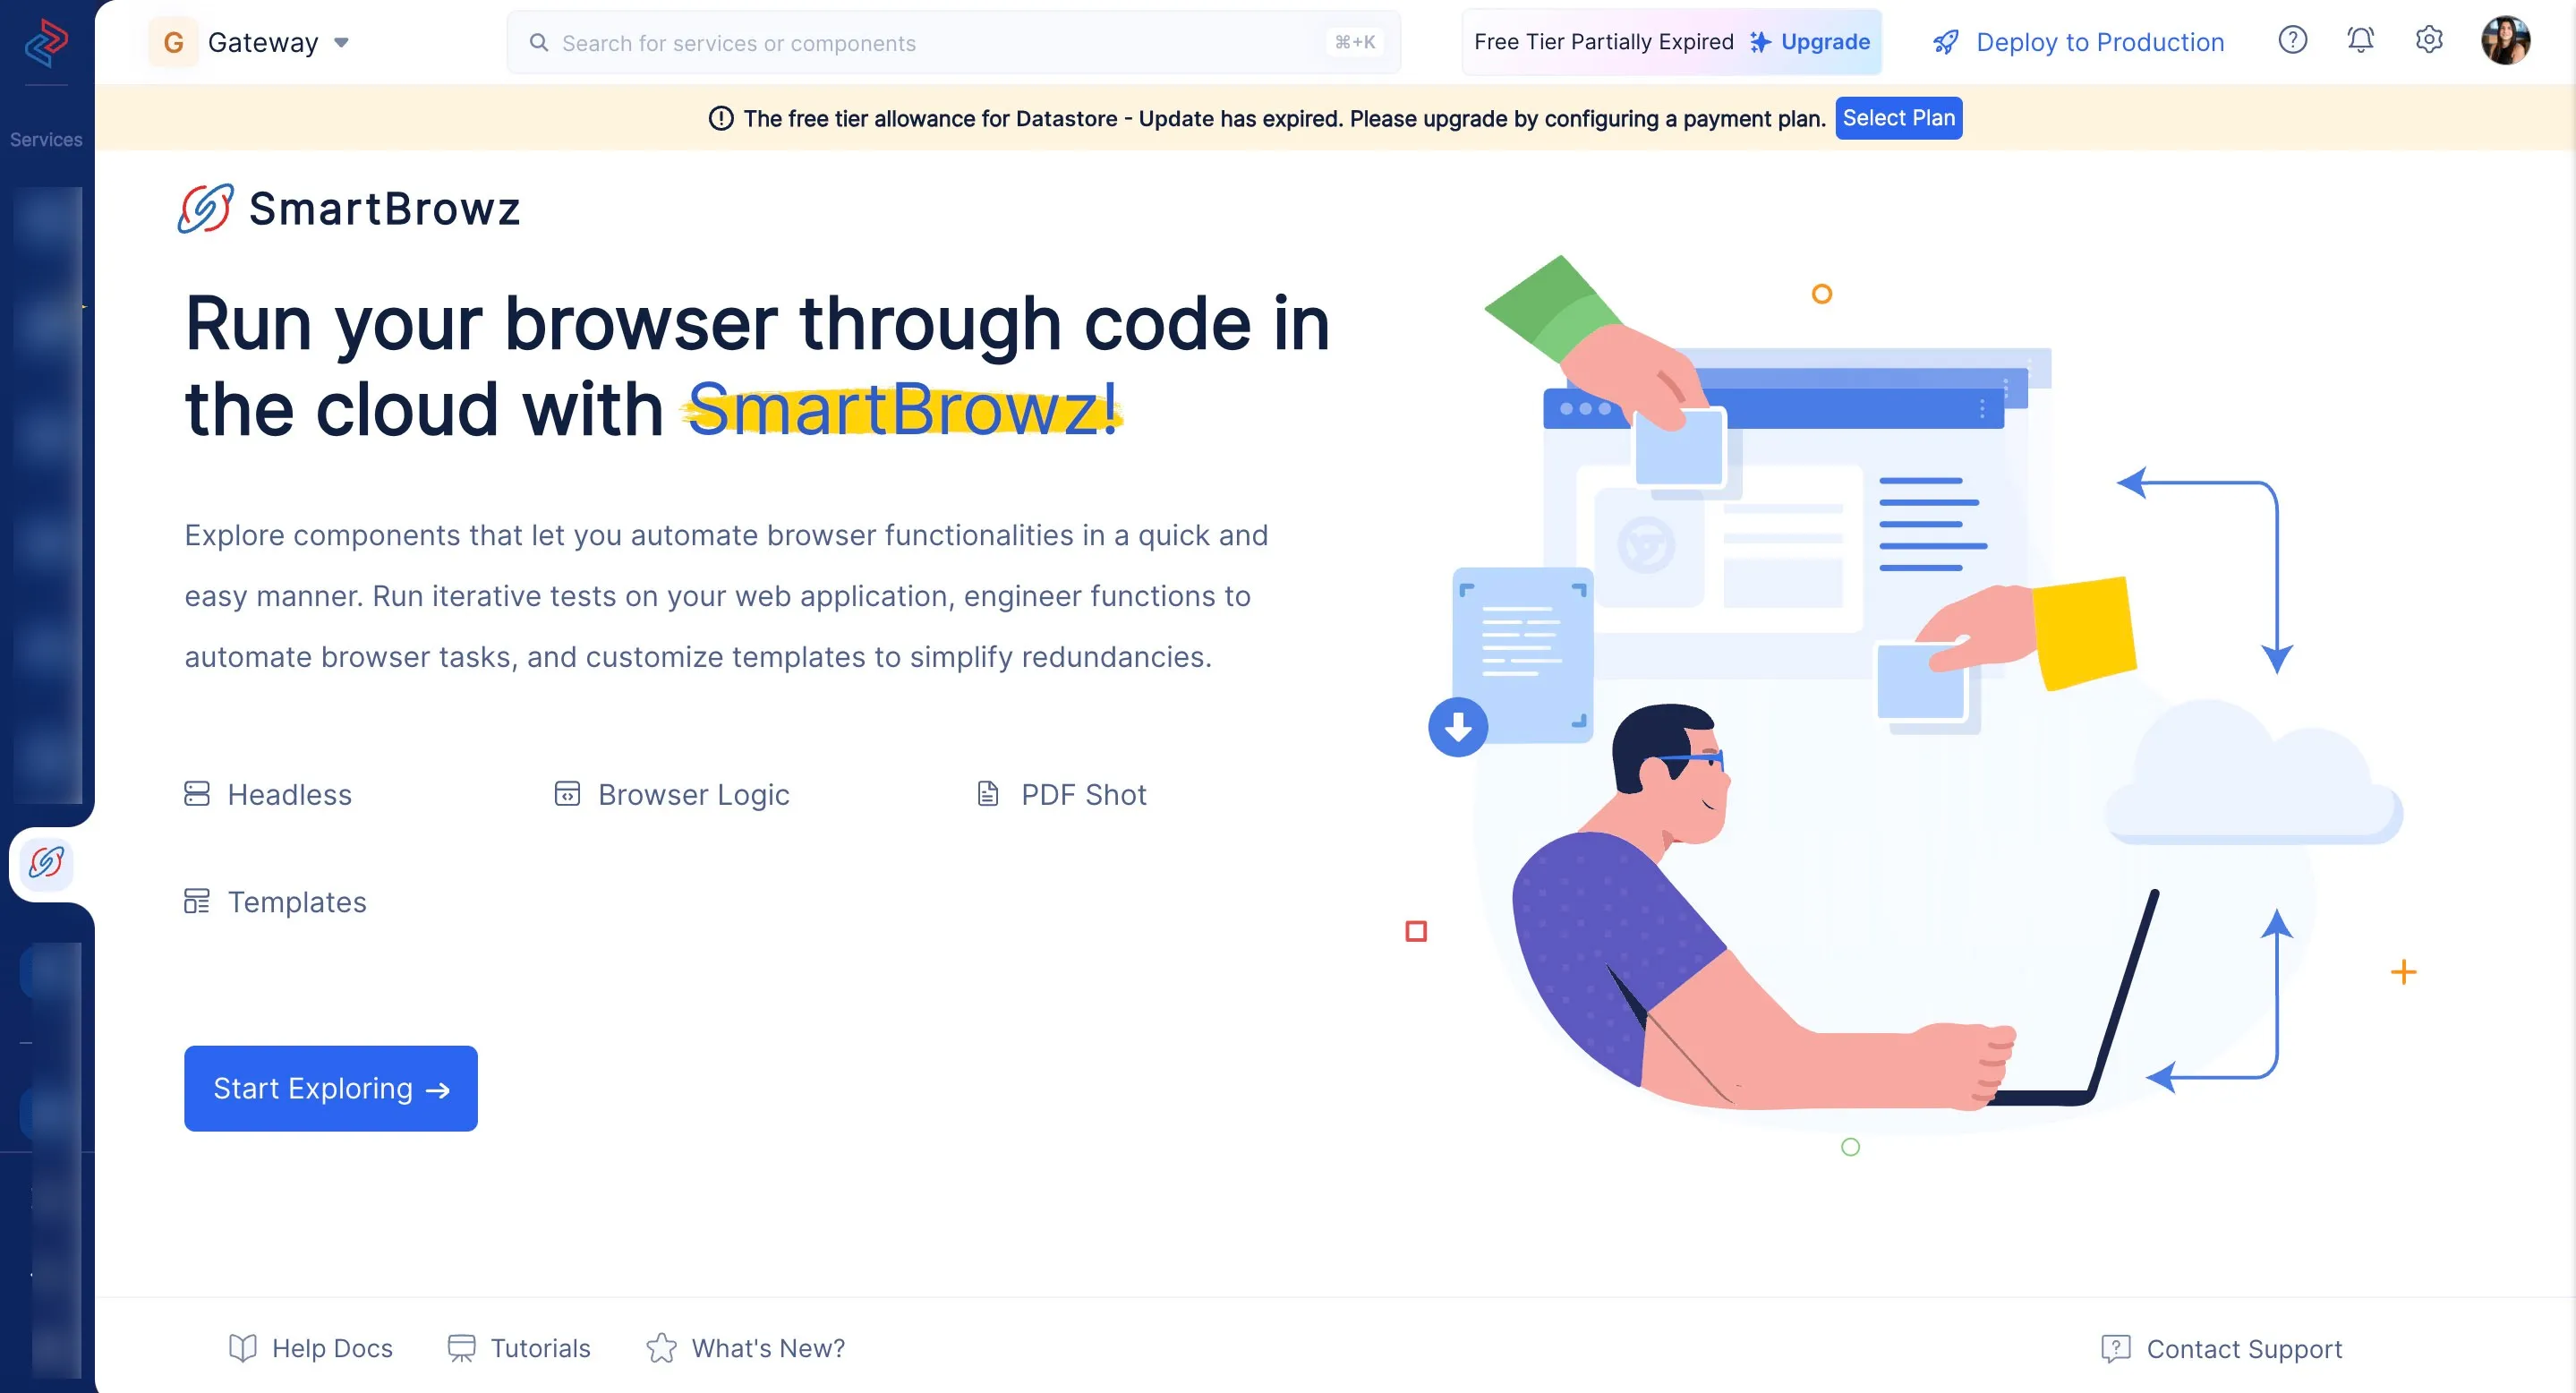
- Click the SmartBrowz service icon from the left-panel of the console, and click Start Exploring.
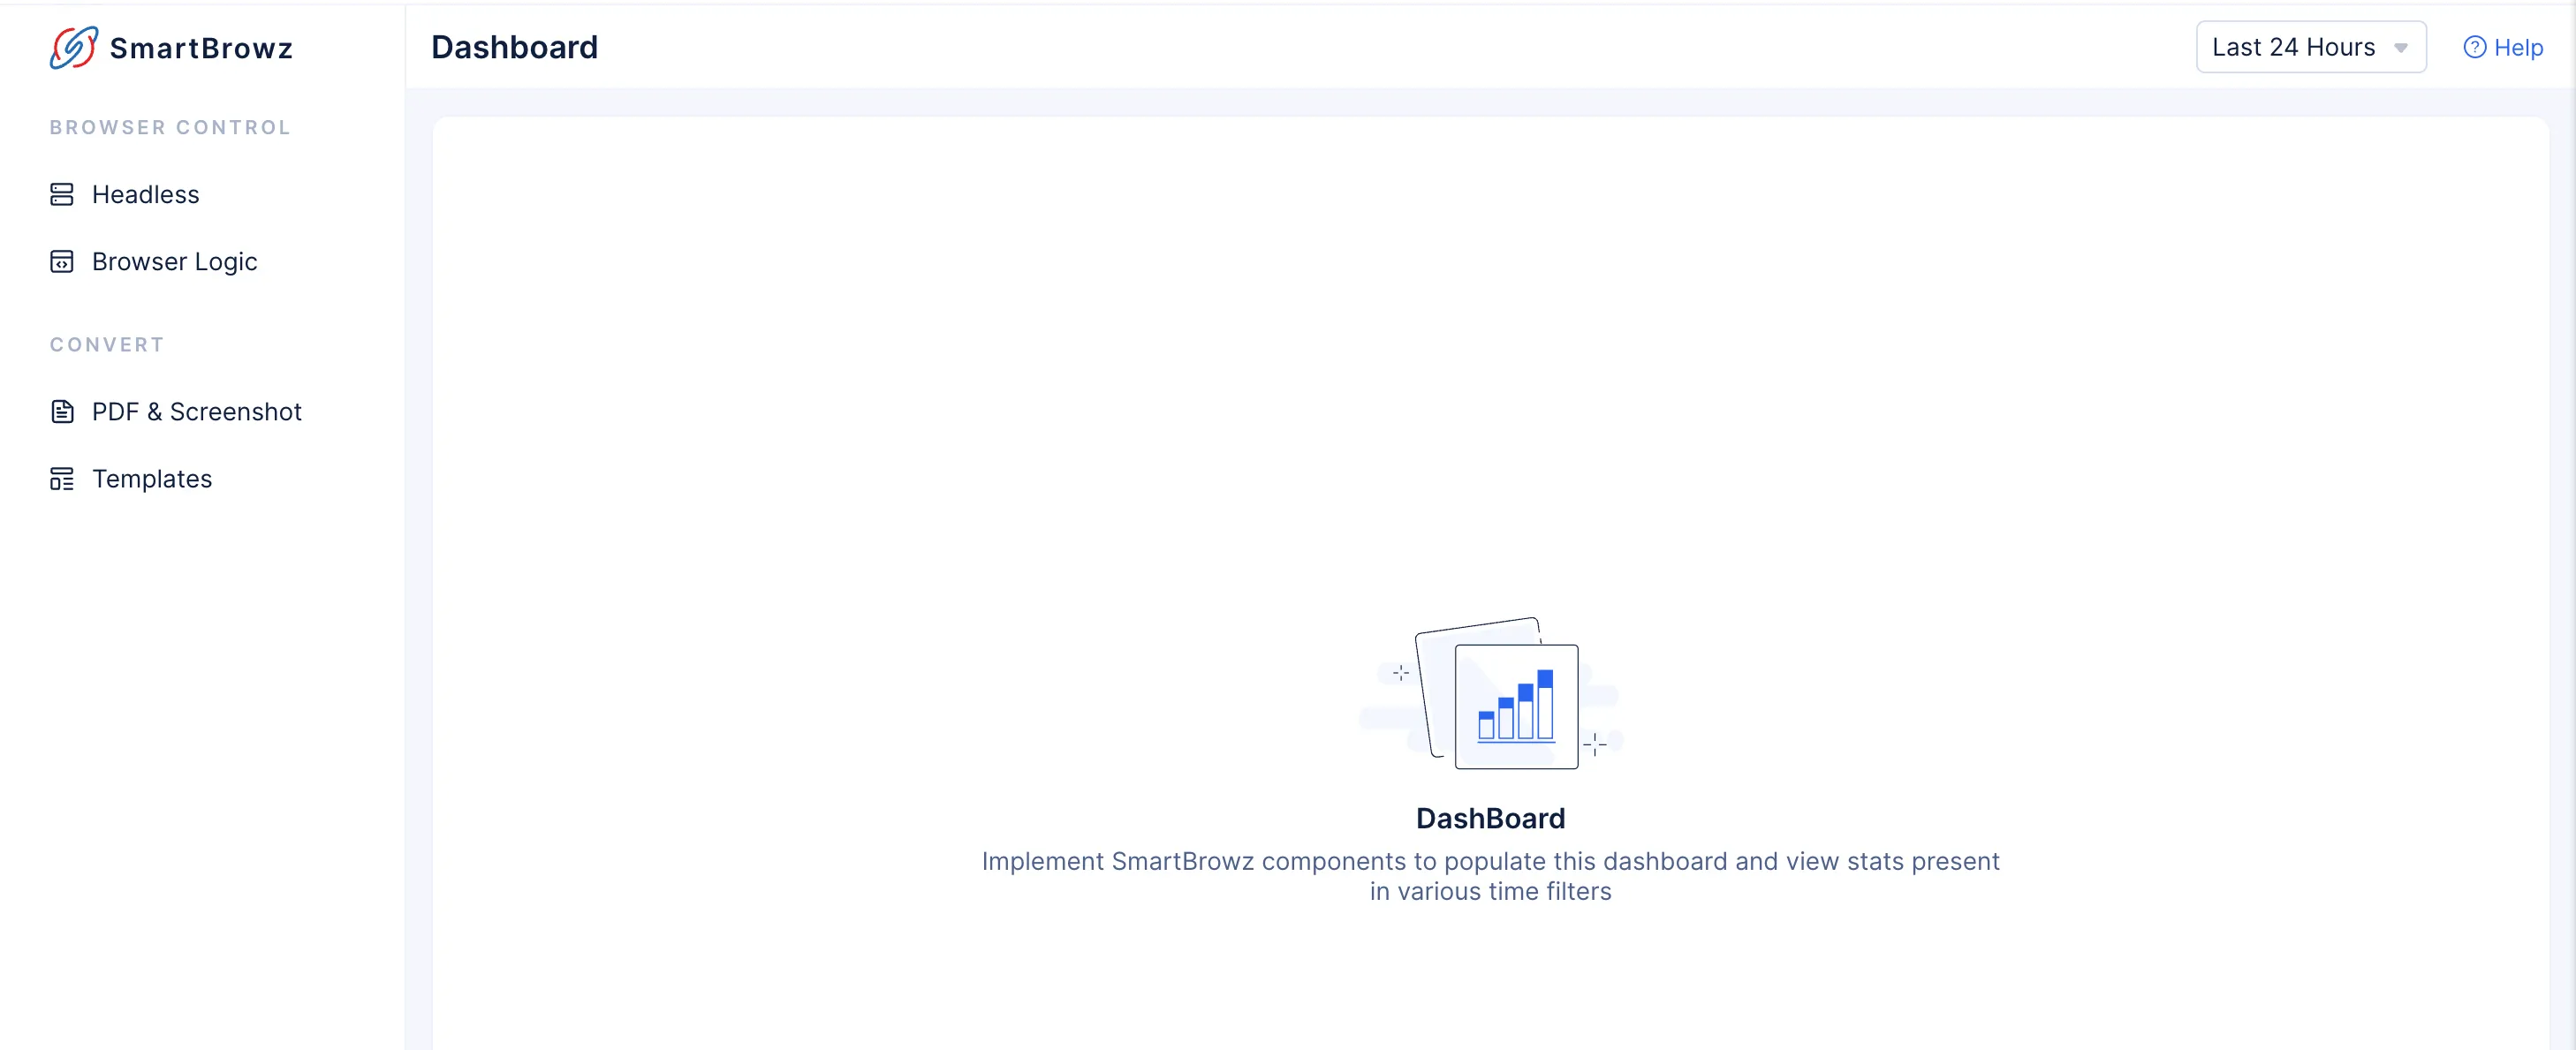
You will need to use the SmartBrowz components to populate the Dashboard.
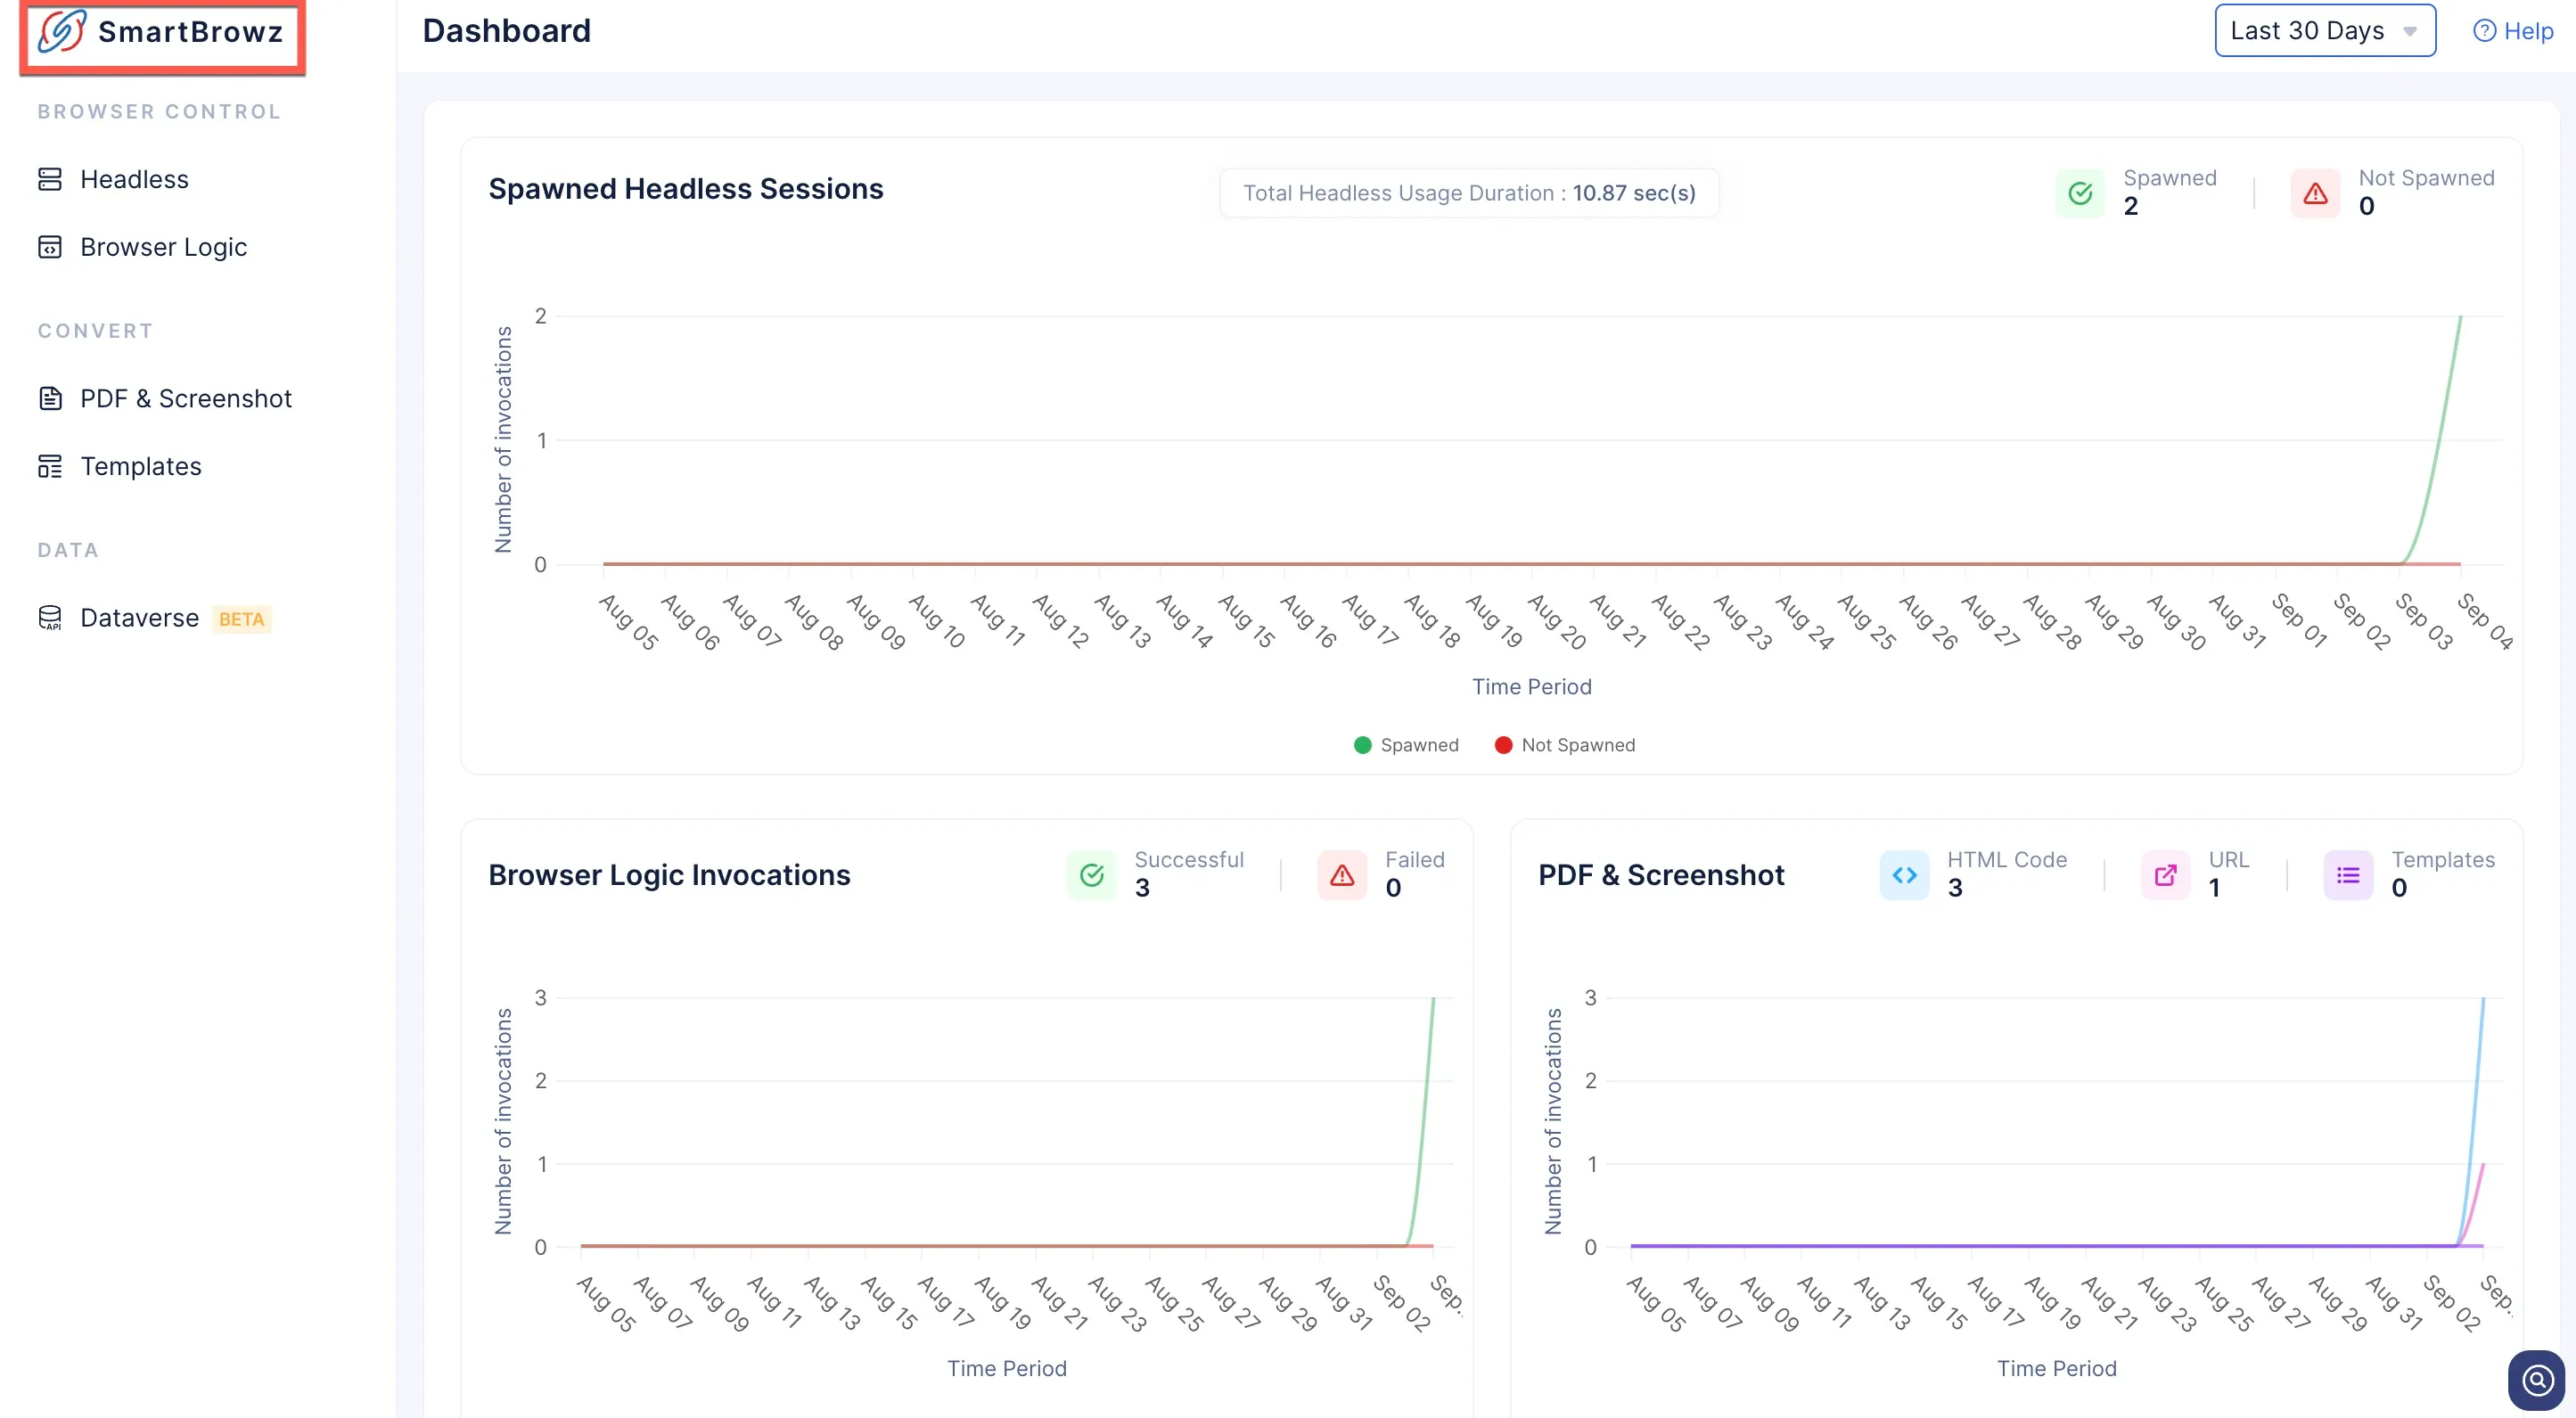
- Click the SmartBrowz icon to view the Dashboard at any time.
Dashboard Features
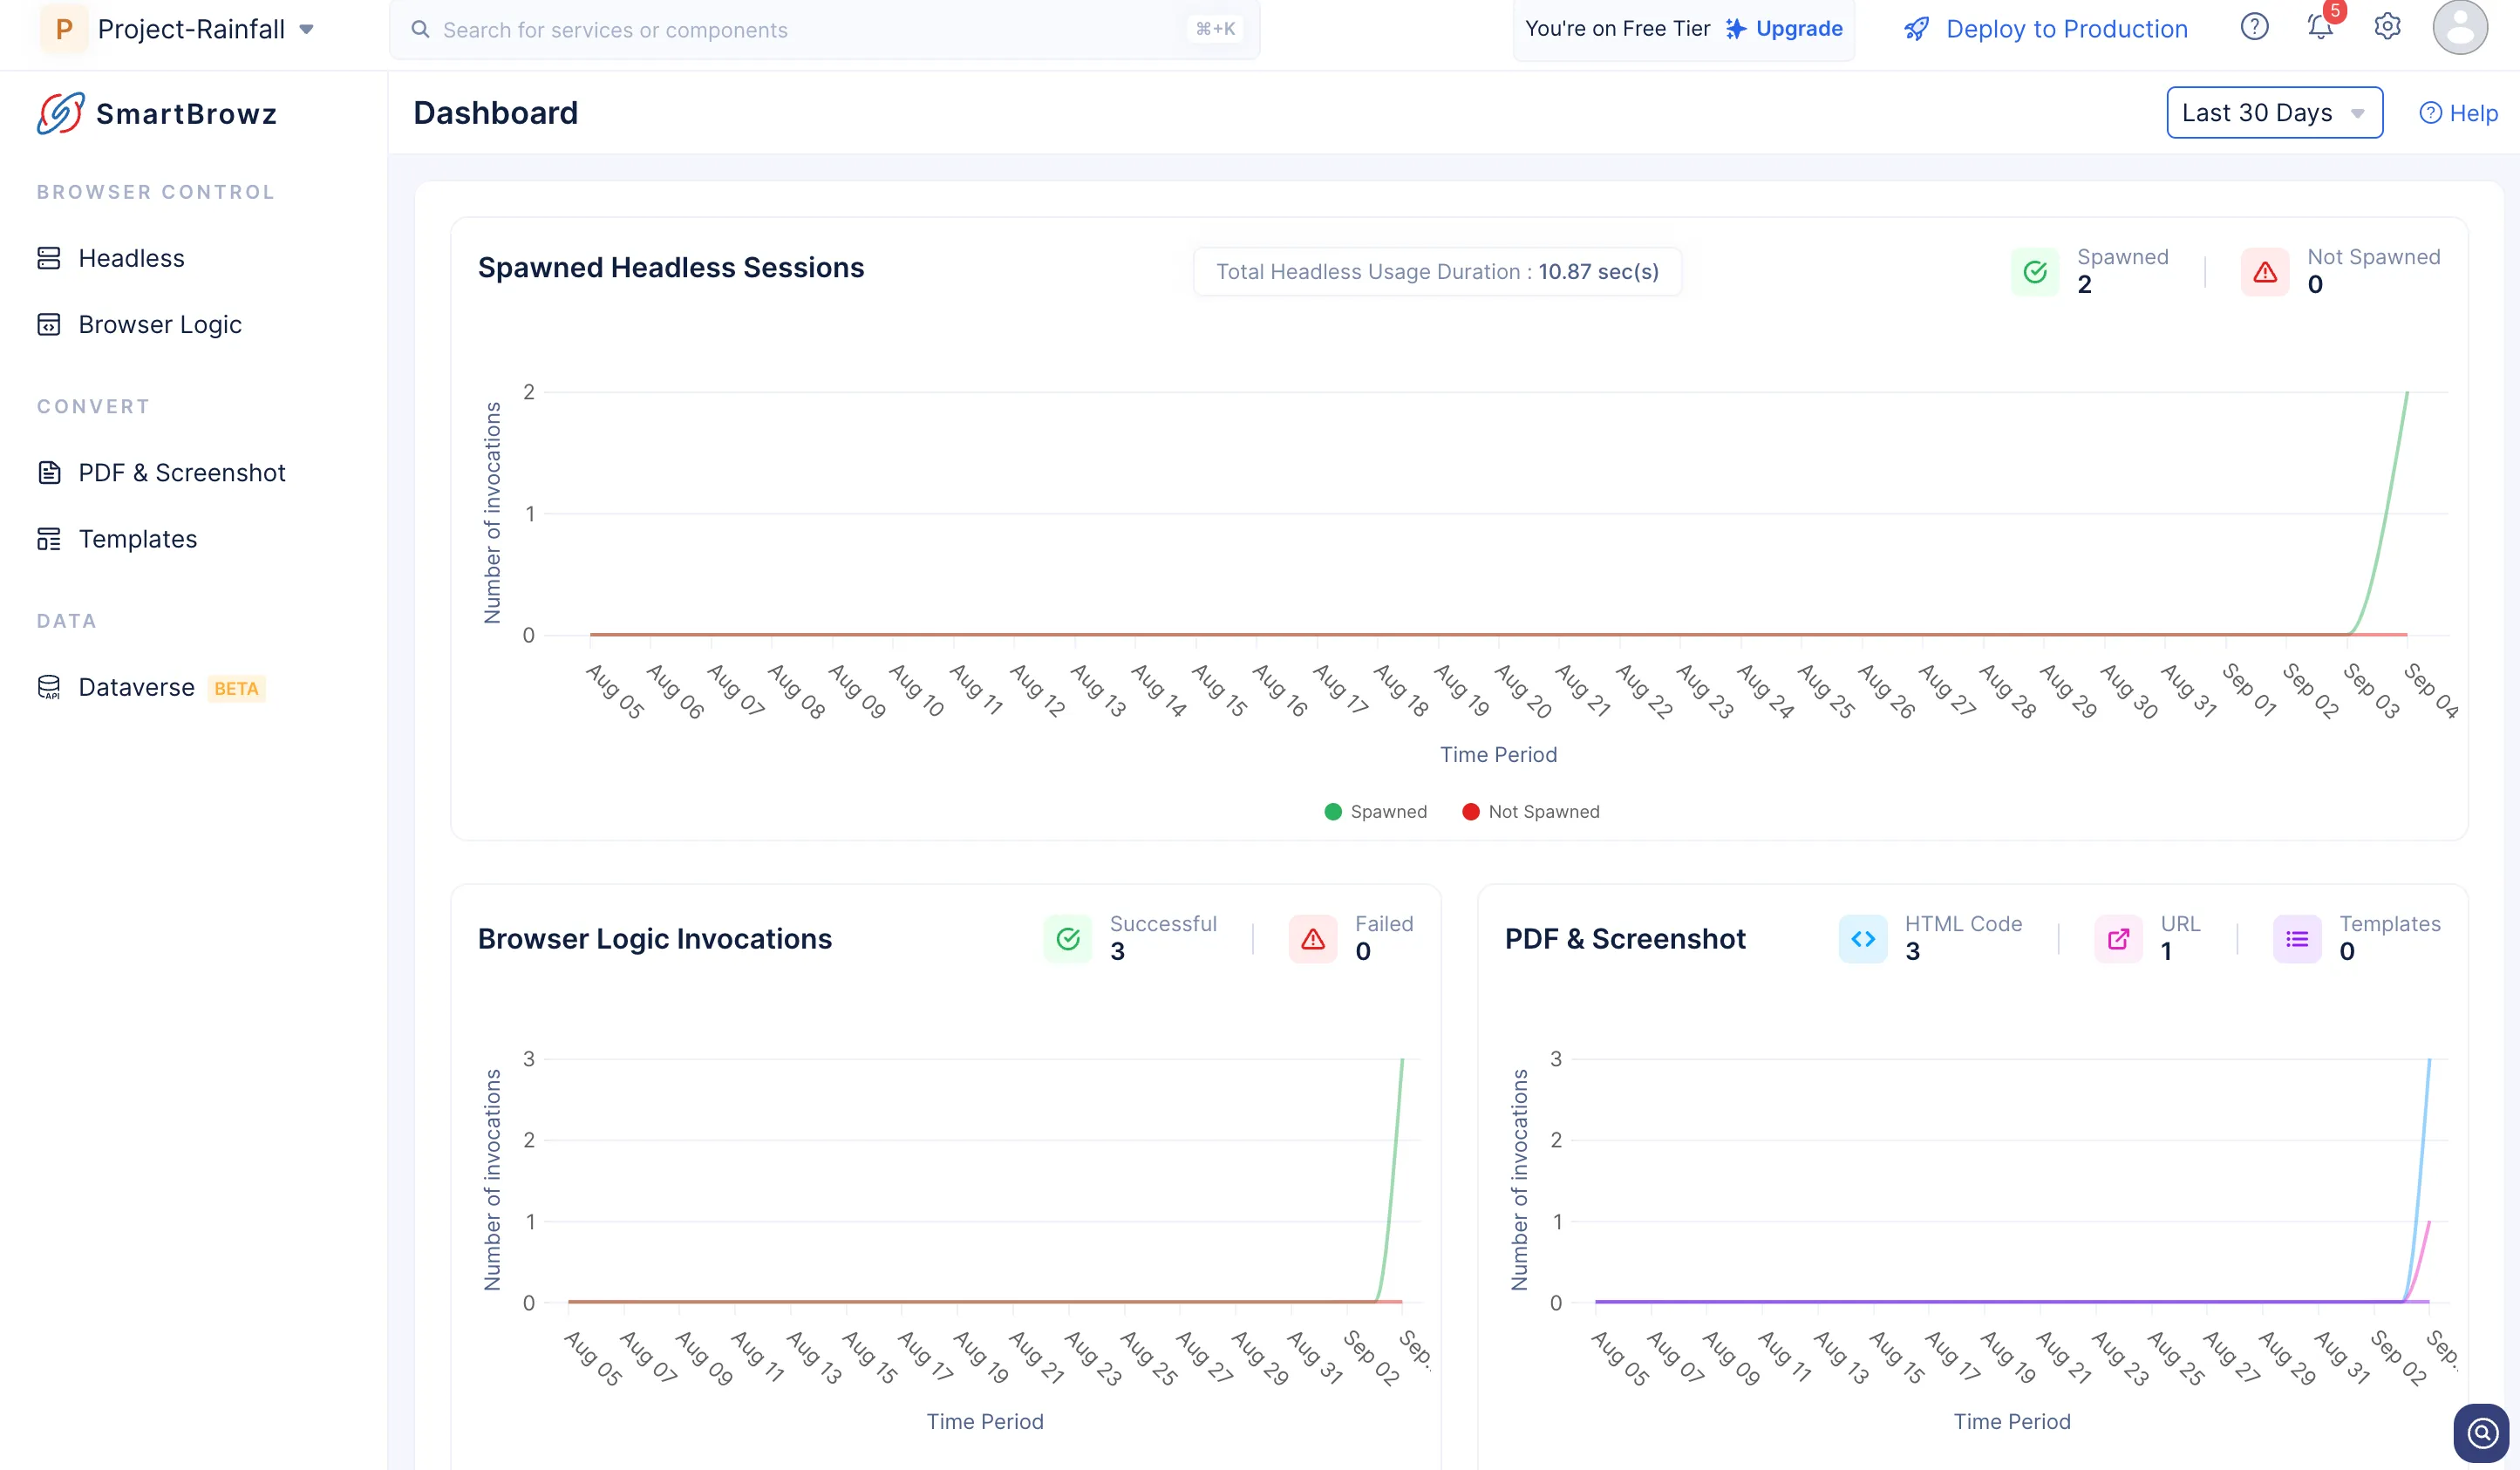
The primary purpose of the SmartBrowz Dashboard is to provide a clear understanding of each component’s usage and performance across a required period of time.
-
View the performance and precisely note the number of failed executions of various actions across a required time period to facilitate better informed debugging sessions.
-
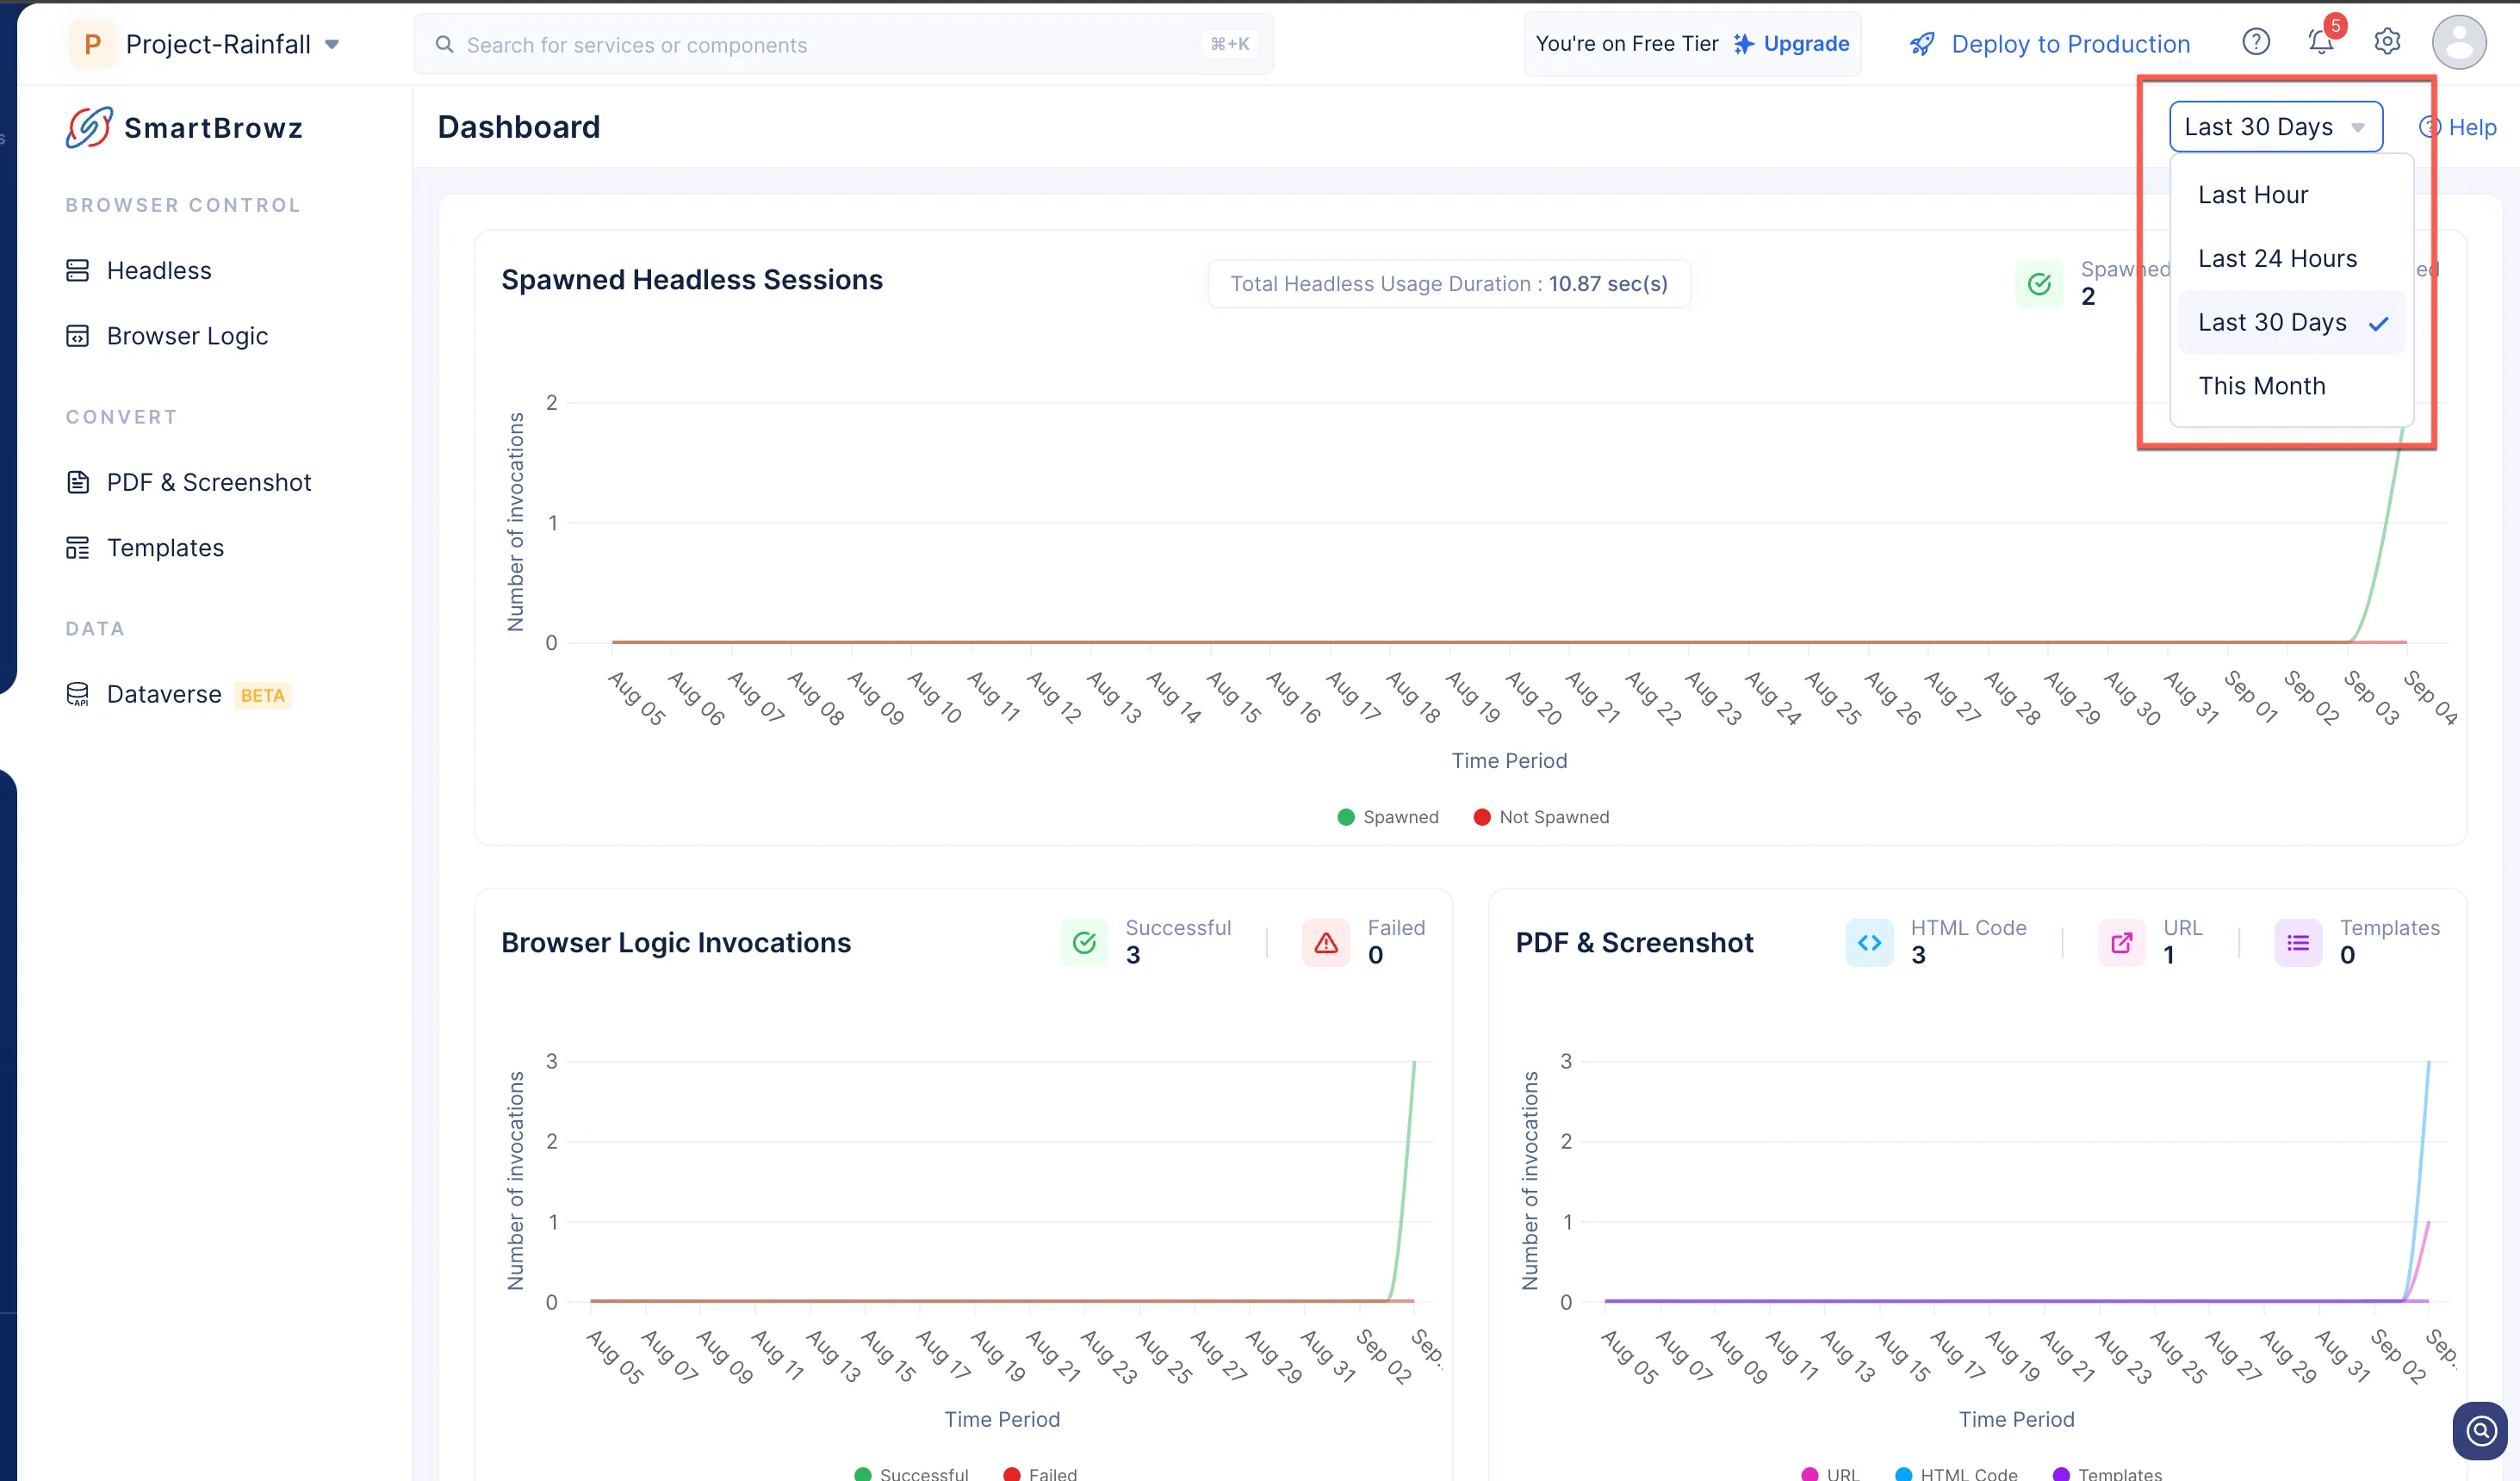
The graphs will be populated live with each usage. The dashboard contains three graphs each representing the performance and usage of the following SmartBrowz components:
-
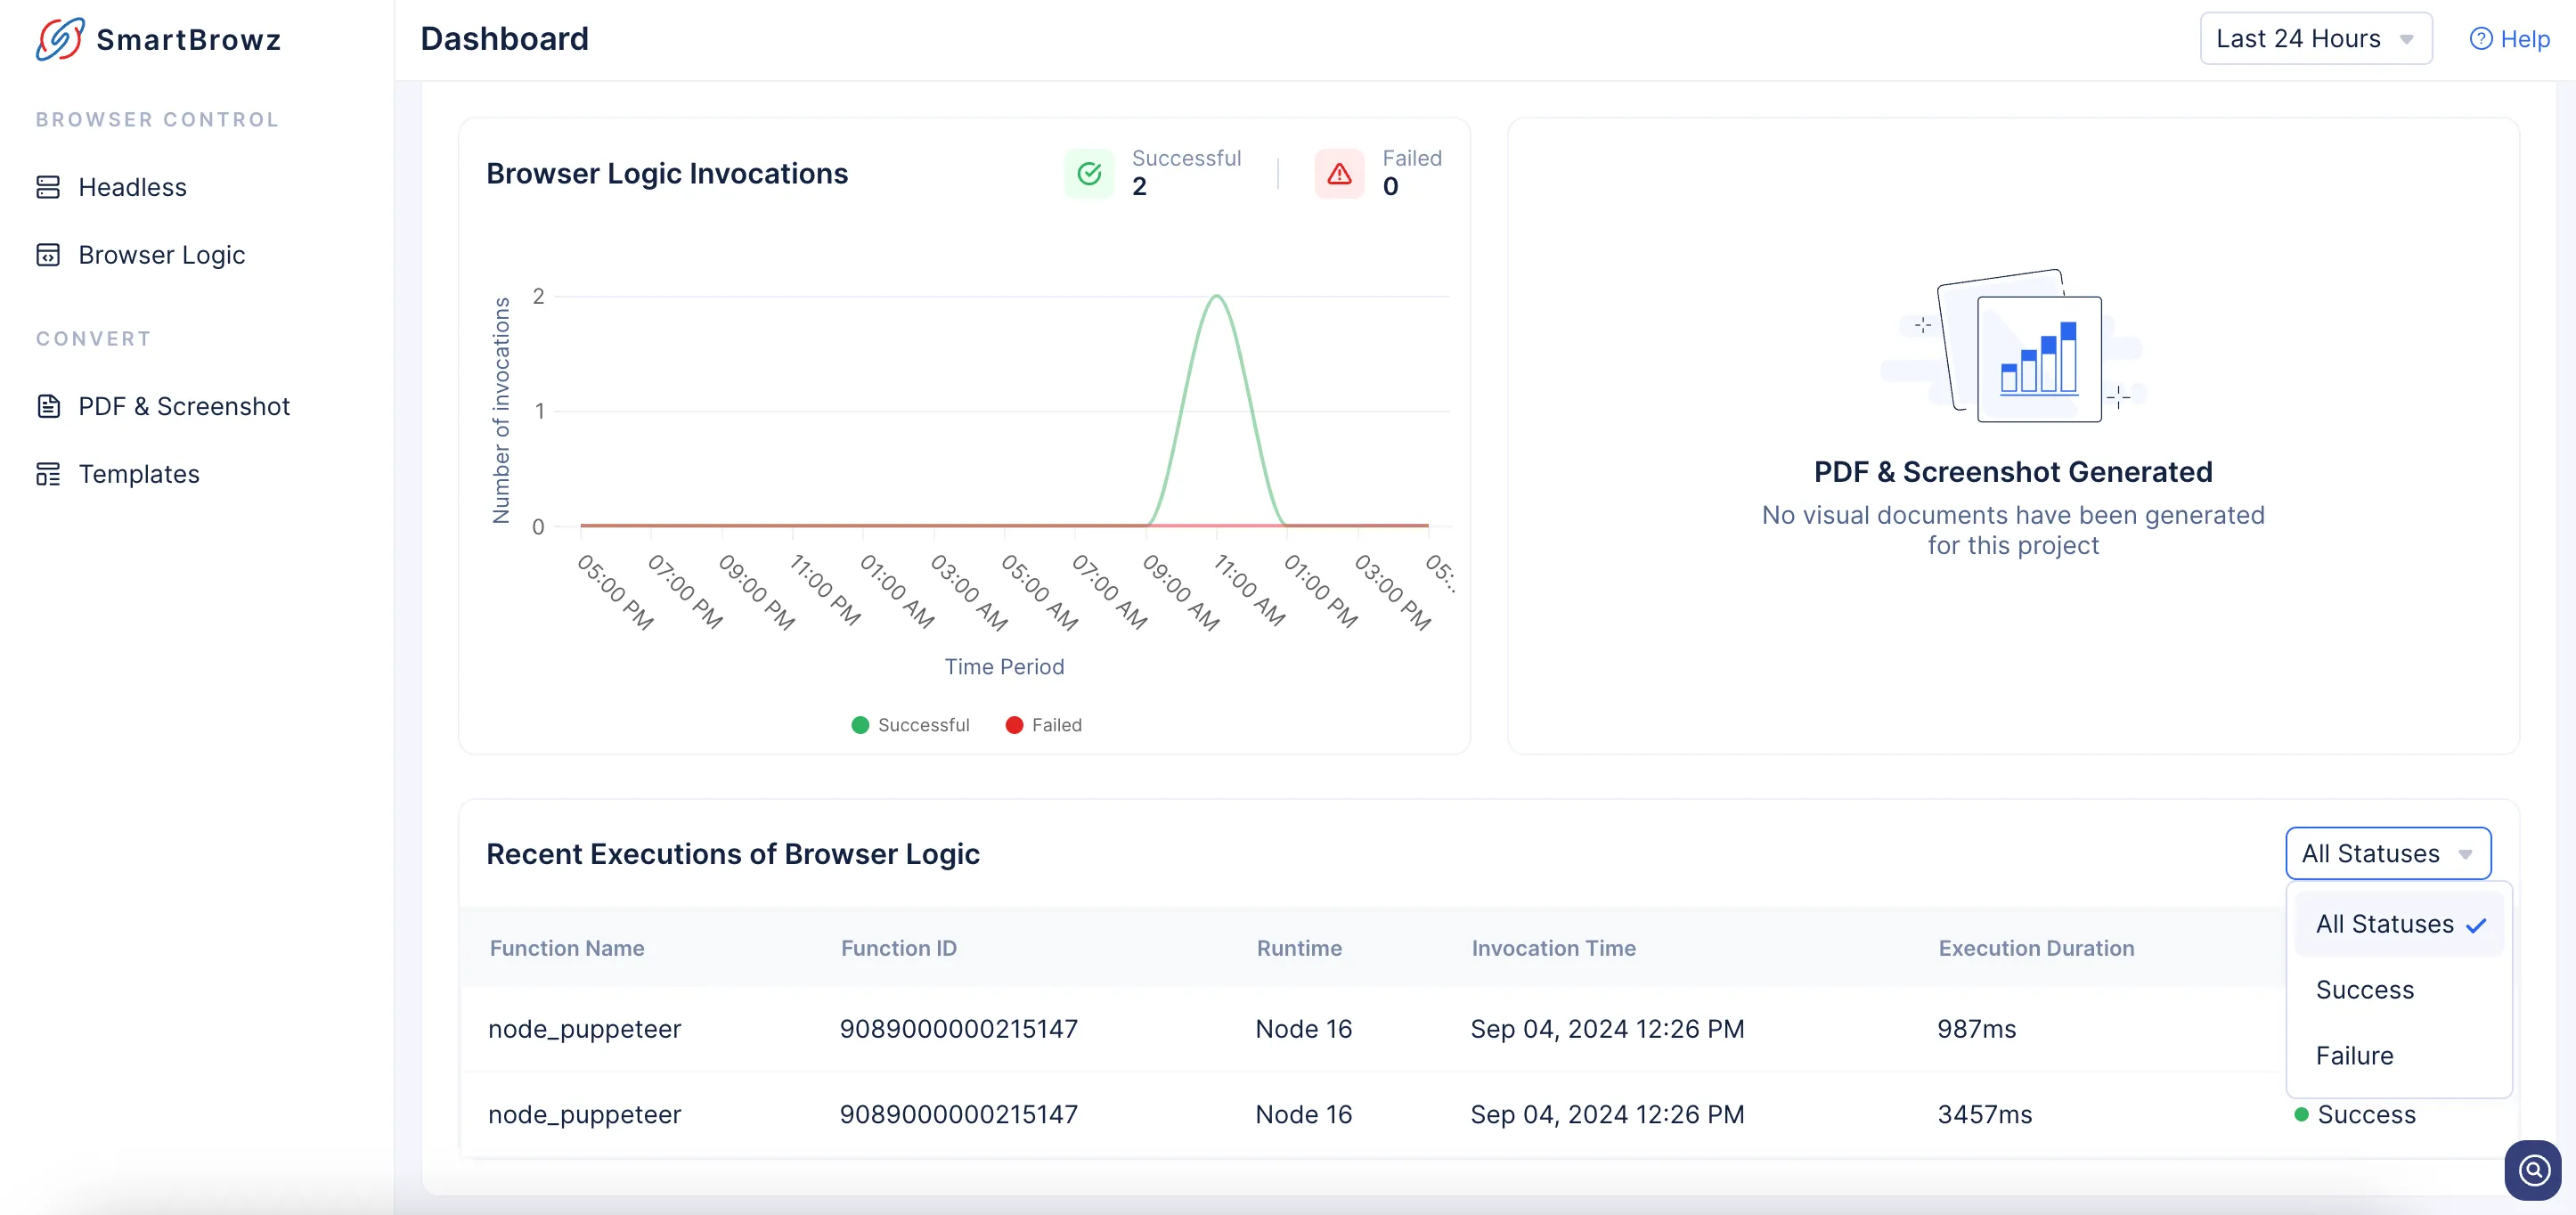
The dashboard also offers you a complete list of Browser Logic functions that were executed recently. You can also filter this list to view only Failed, Successful, or All Status executions.
-
You can also filter all the graphs in the dashboard based on time period using the filter present on the left side of the console.
Last Updated 2025-08-28 12:01:44 +0530 IST
Yes
No
Send your feedback to us