Explore Browser Grid Dashboard
Info: This feature is currently only available in Early Access. To test out this feature, you can email your requirement to Catalyst Support at support@zohocatalyst.com
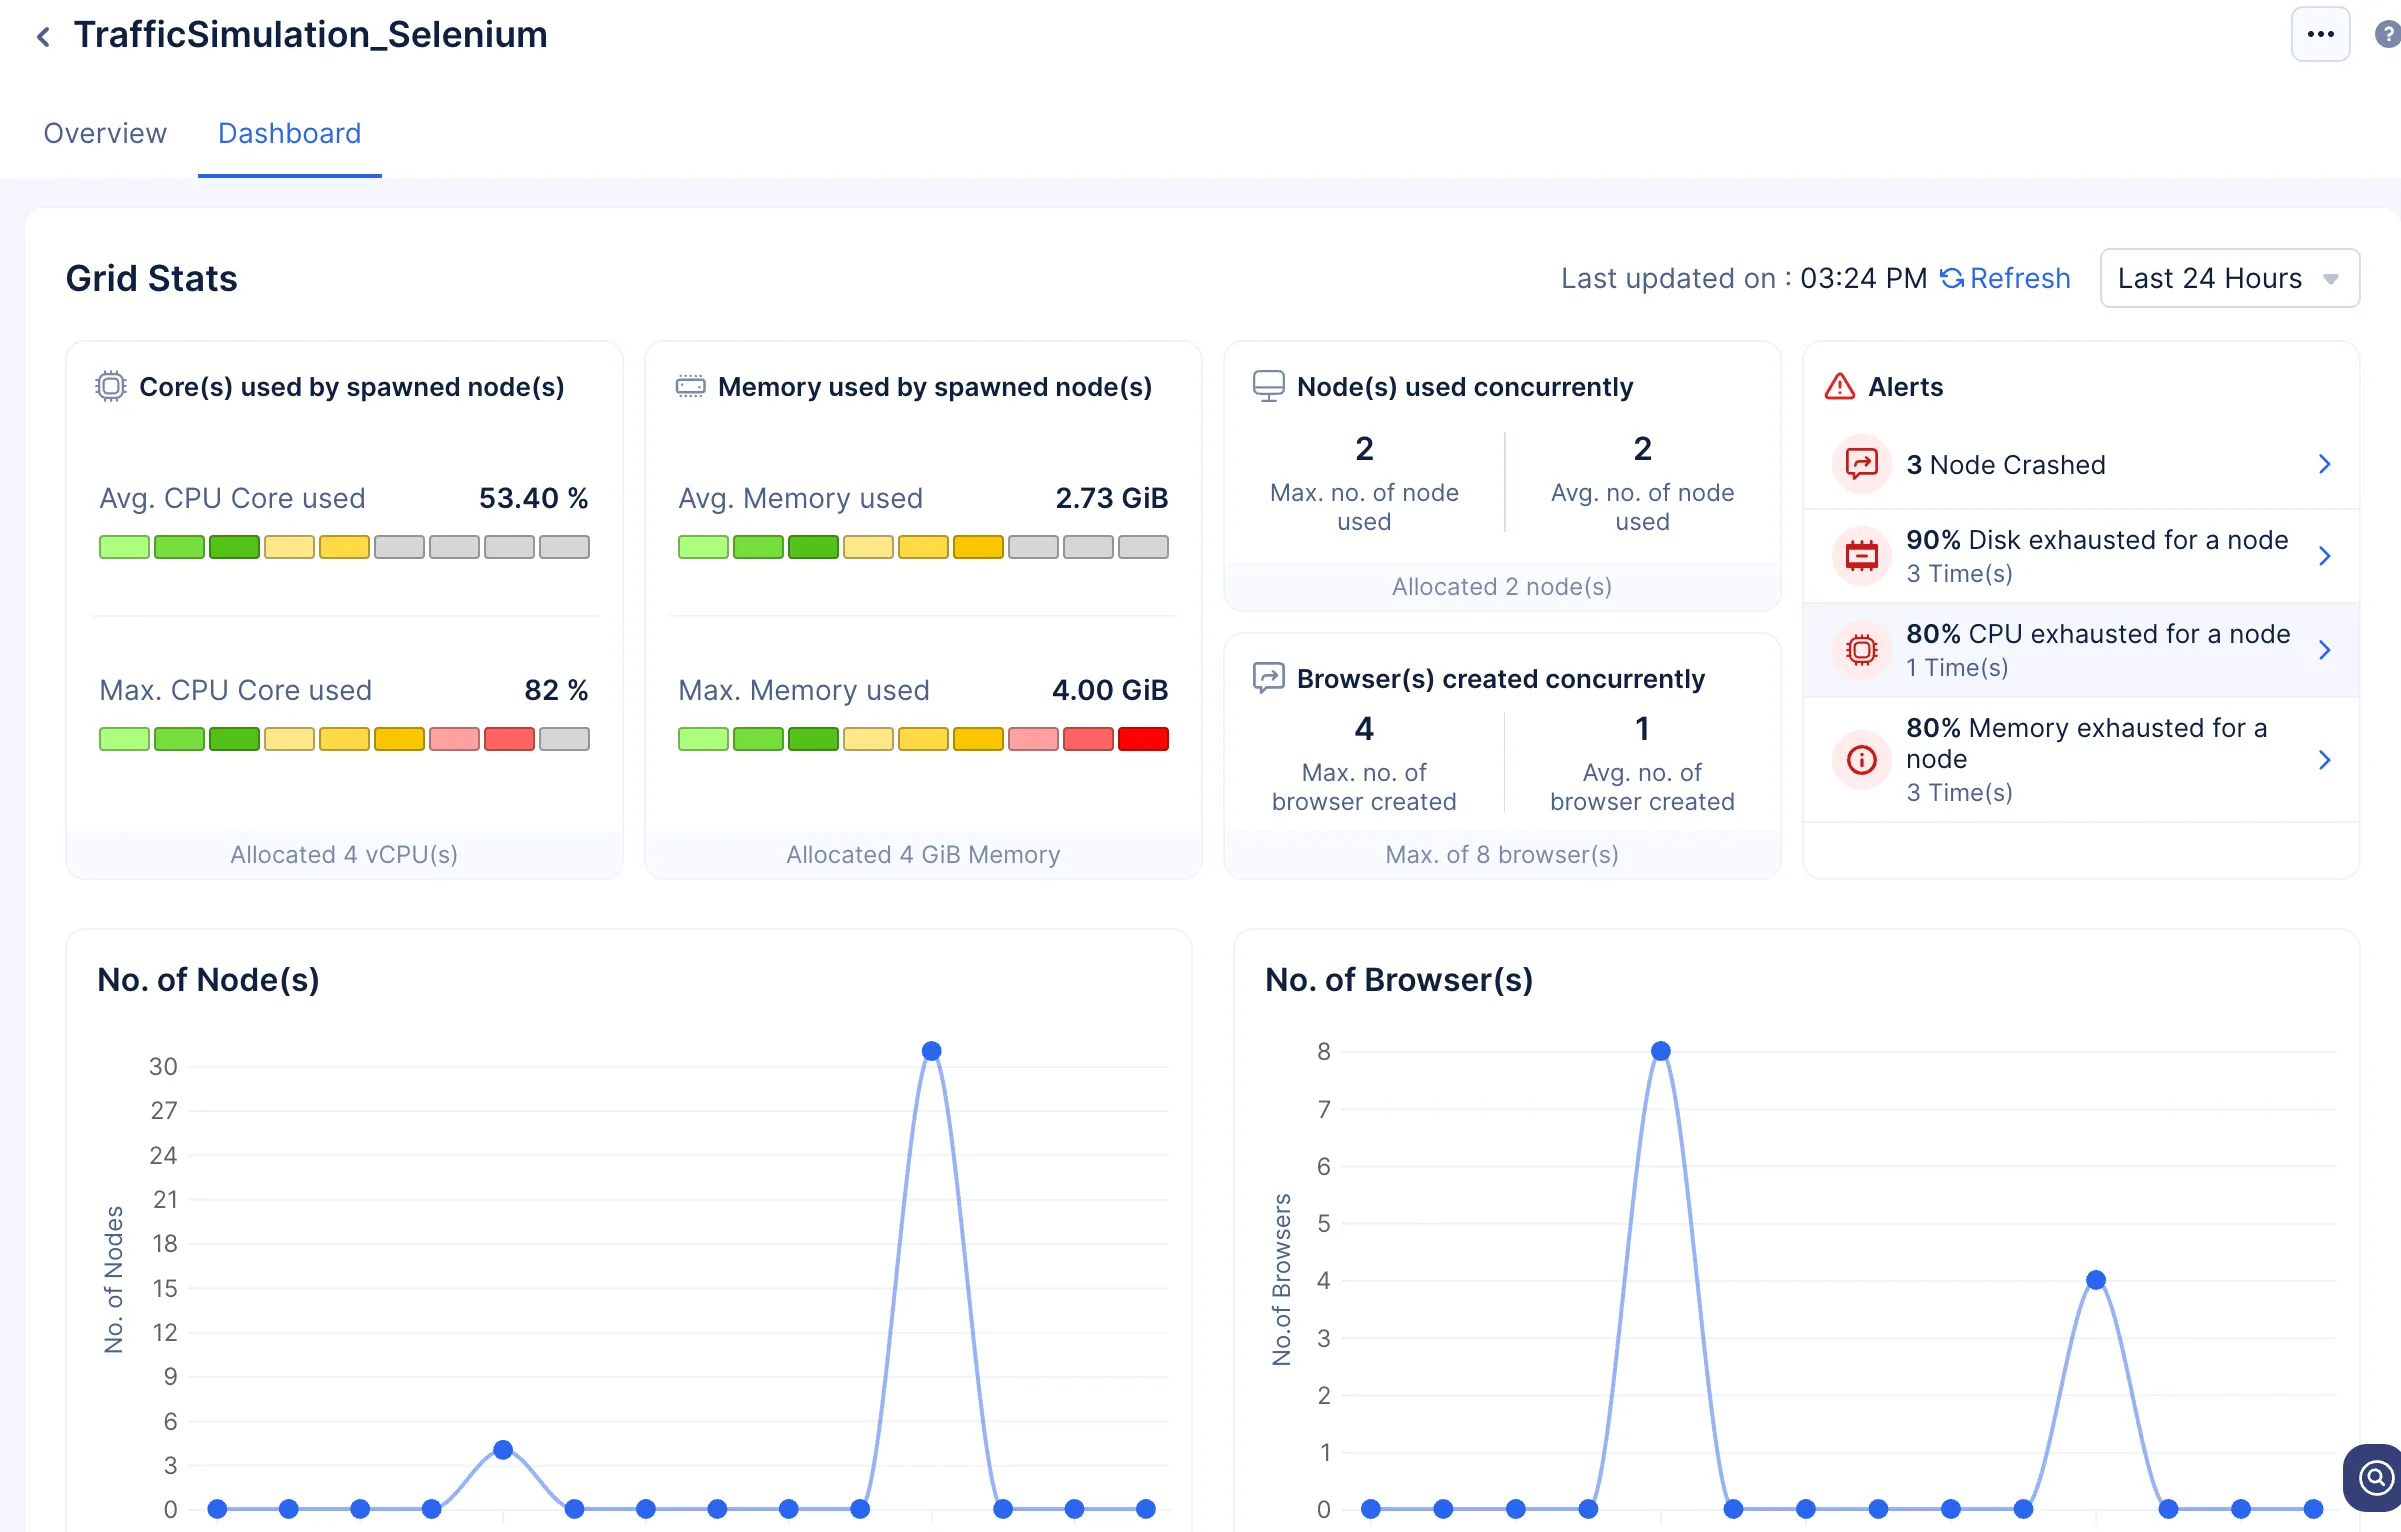
Once you create your browser grid, you will have access to the Dashboard. The dashboard will be populated once you connect to the remote browser in the grid through your code. The browser grid dashboard displays real-time stats of the following:

- The maximum and average percent of cores being used by spawned nodes.
- The maximum and average percent of memory being used by nodes.
- The number of nodes and browsers that are being run concurrently.
- Complete list of the alerts that have been raised by the Browser Grid at the event where a request has been killed, or if the grid has encountered any errors.
Note: Always click the Refresh button present in the console to ensure the dashboard renders the latest stats.
Performance Graphs
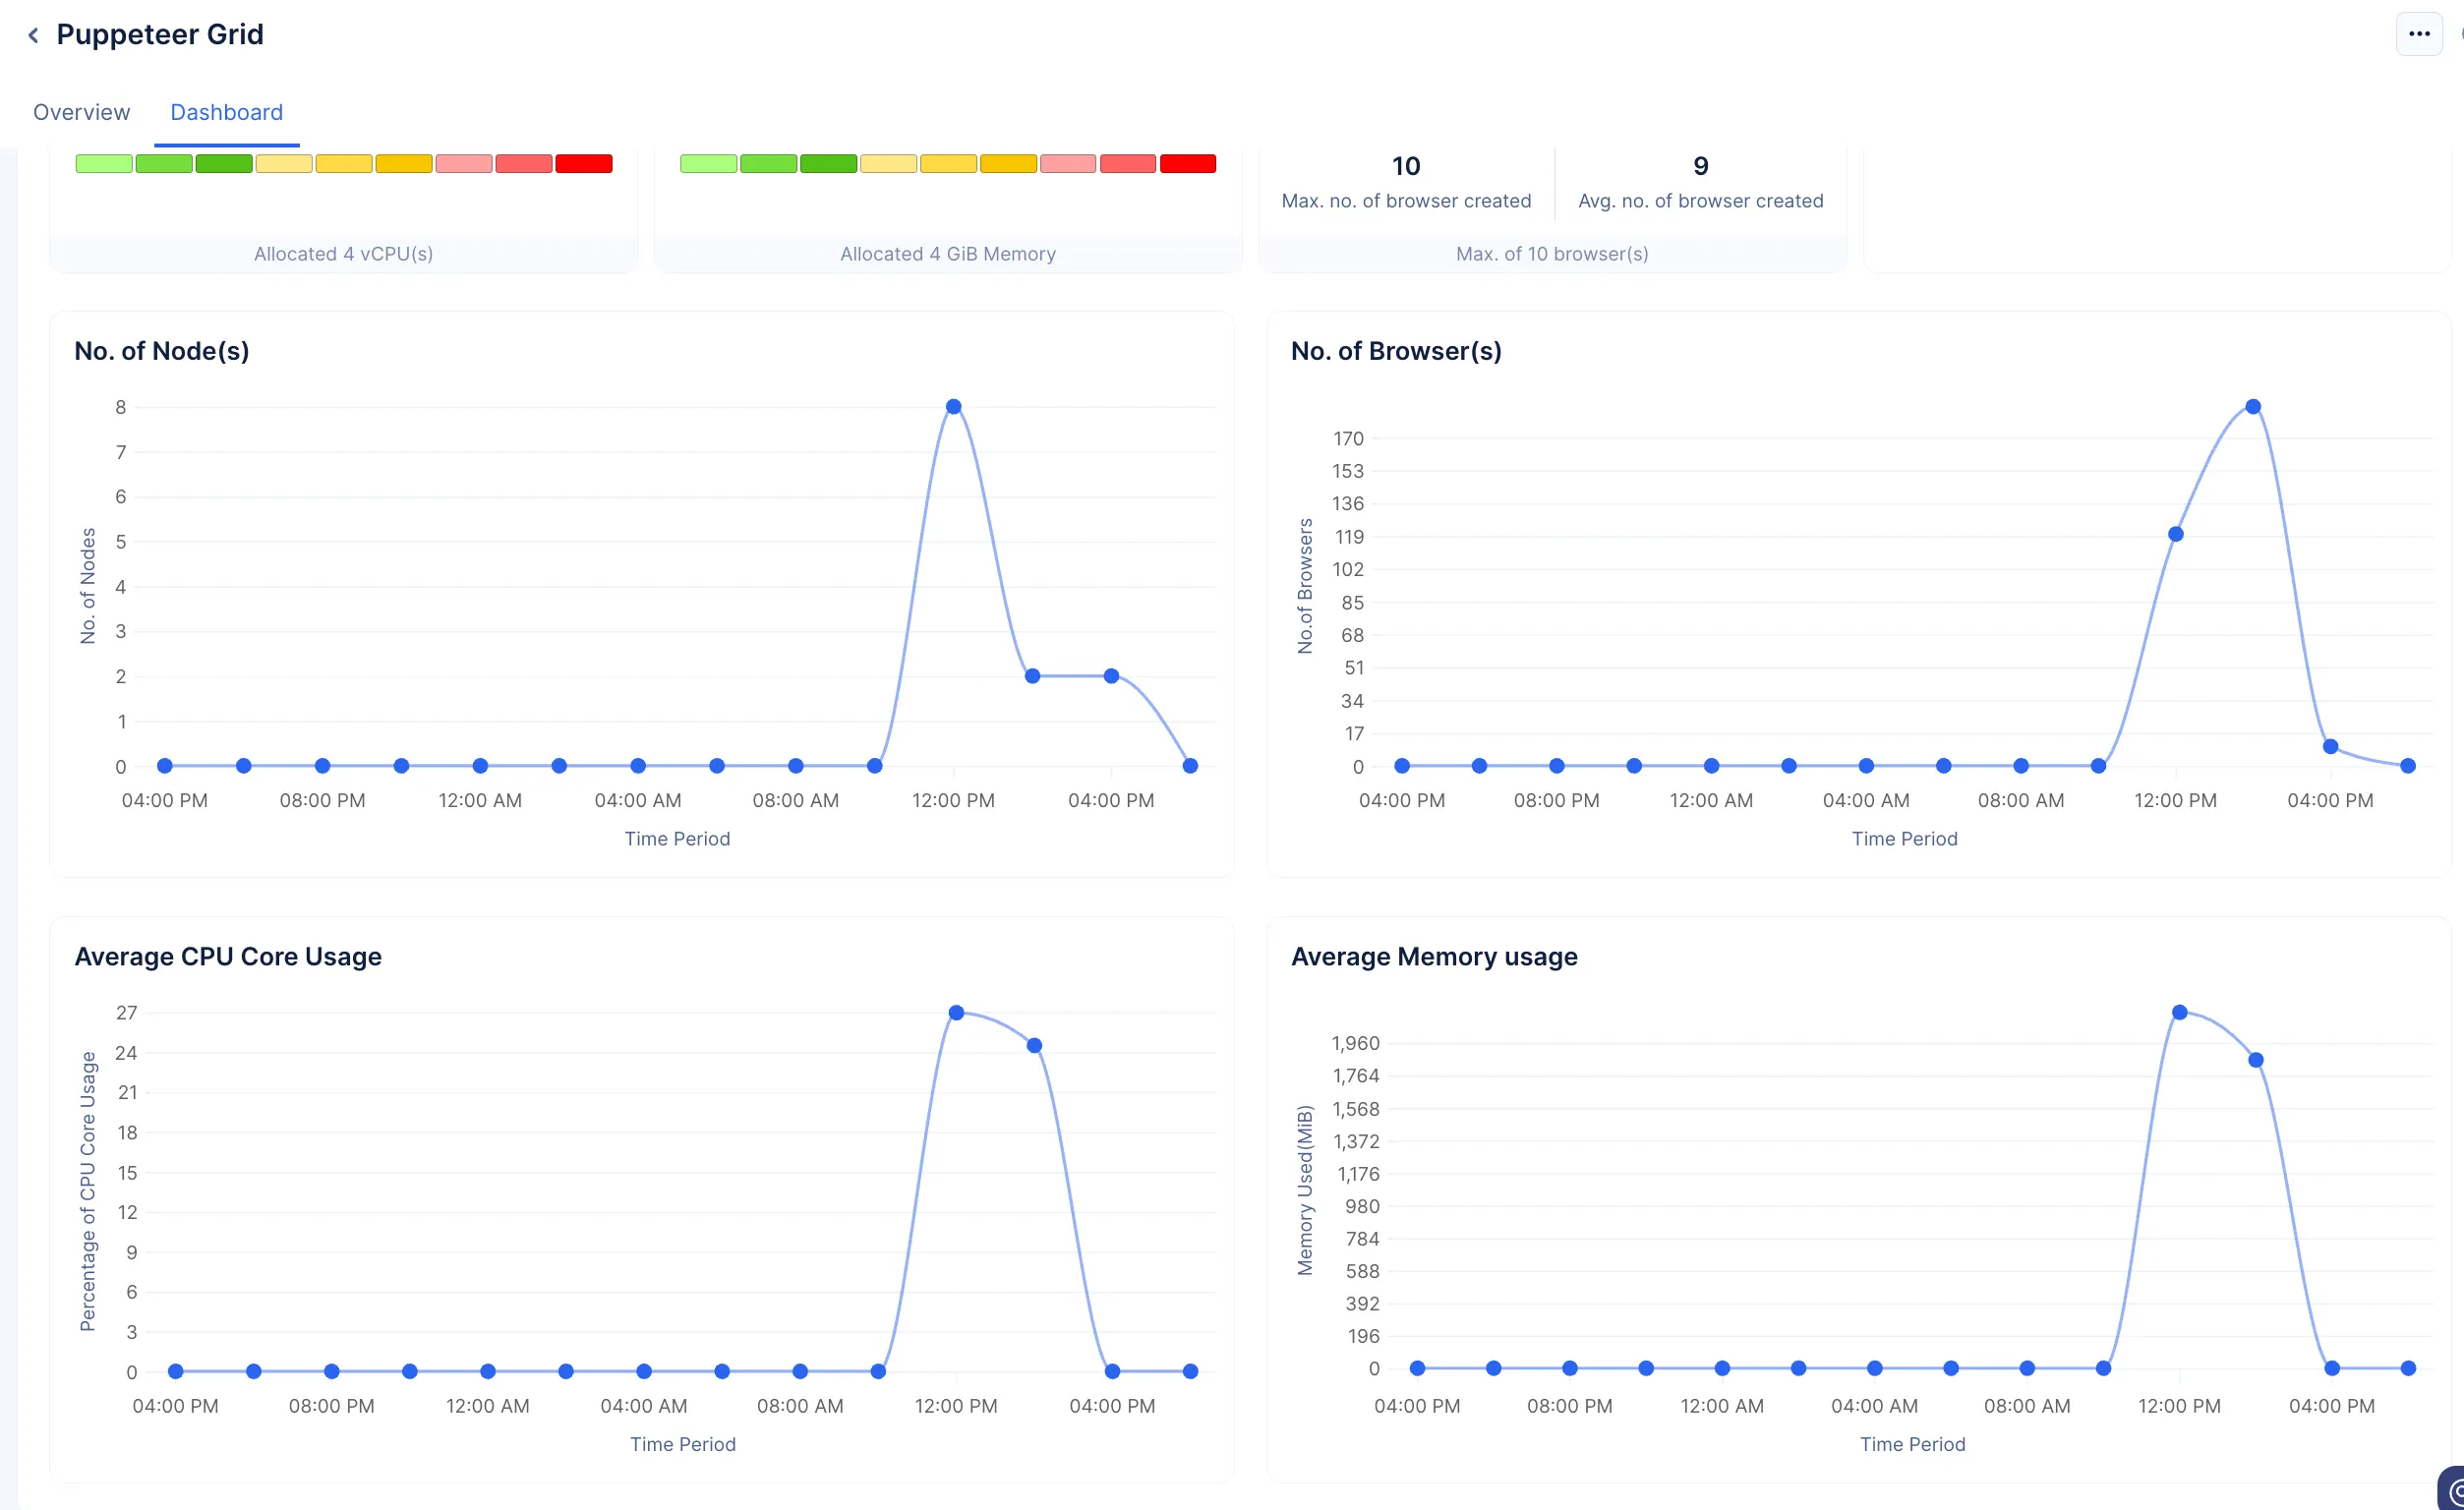
In the Browser Grid Dashboard, you will be able to view four graphs that illustrate various performance statistics of the grid.

The graphs project the following operations:
- The performance of the nodes and data on when they were created.
- The performance of the spawned browsers and the duration they were spawned and operating.
- The average CPU core usage and average memory usage.
Notice: Any Browser action or operation that you code using the Browser Logic function, or any browser automation or web scraping task that you perform using any component of Catalyst SmartBrowz is at your own risk. We strongly recommend you use the SmartBrowz components to perform operations on domains that permit such actions, or with proper approval.Additionally, while Catalyst does provide a secure infrastructure to code your functions, any consequence of the logic you code using Catalyst functions is yours alone.
Last Updated 2025-12-19 11:24:47 +0530 IST
Yes
No
Send your feedback to us
Skip
Submit