Debug AppSail Services
This section contains examples to debug sample AppSail services built on specific frameworks on popular IDEs. Depending on the programming environment and the framework, appropriate IDEs are used to demonstrate the steps.
Java
Debug a Spring MVC application in Visual Studio Code
Follow the steps provided in this section to debug and test a Java application built on the Spring MVC framework in the Visual Studio Code environment.
Prerequisites: A Spring MVC application created and available in VSCode
-
Open the Spring application project in your VSCode IDE.
-
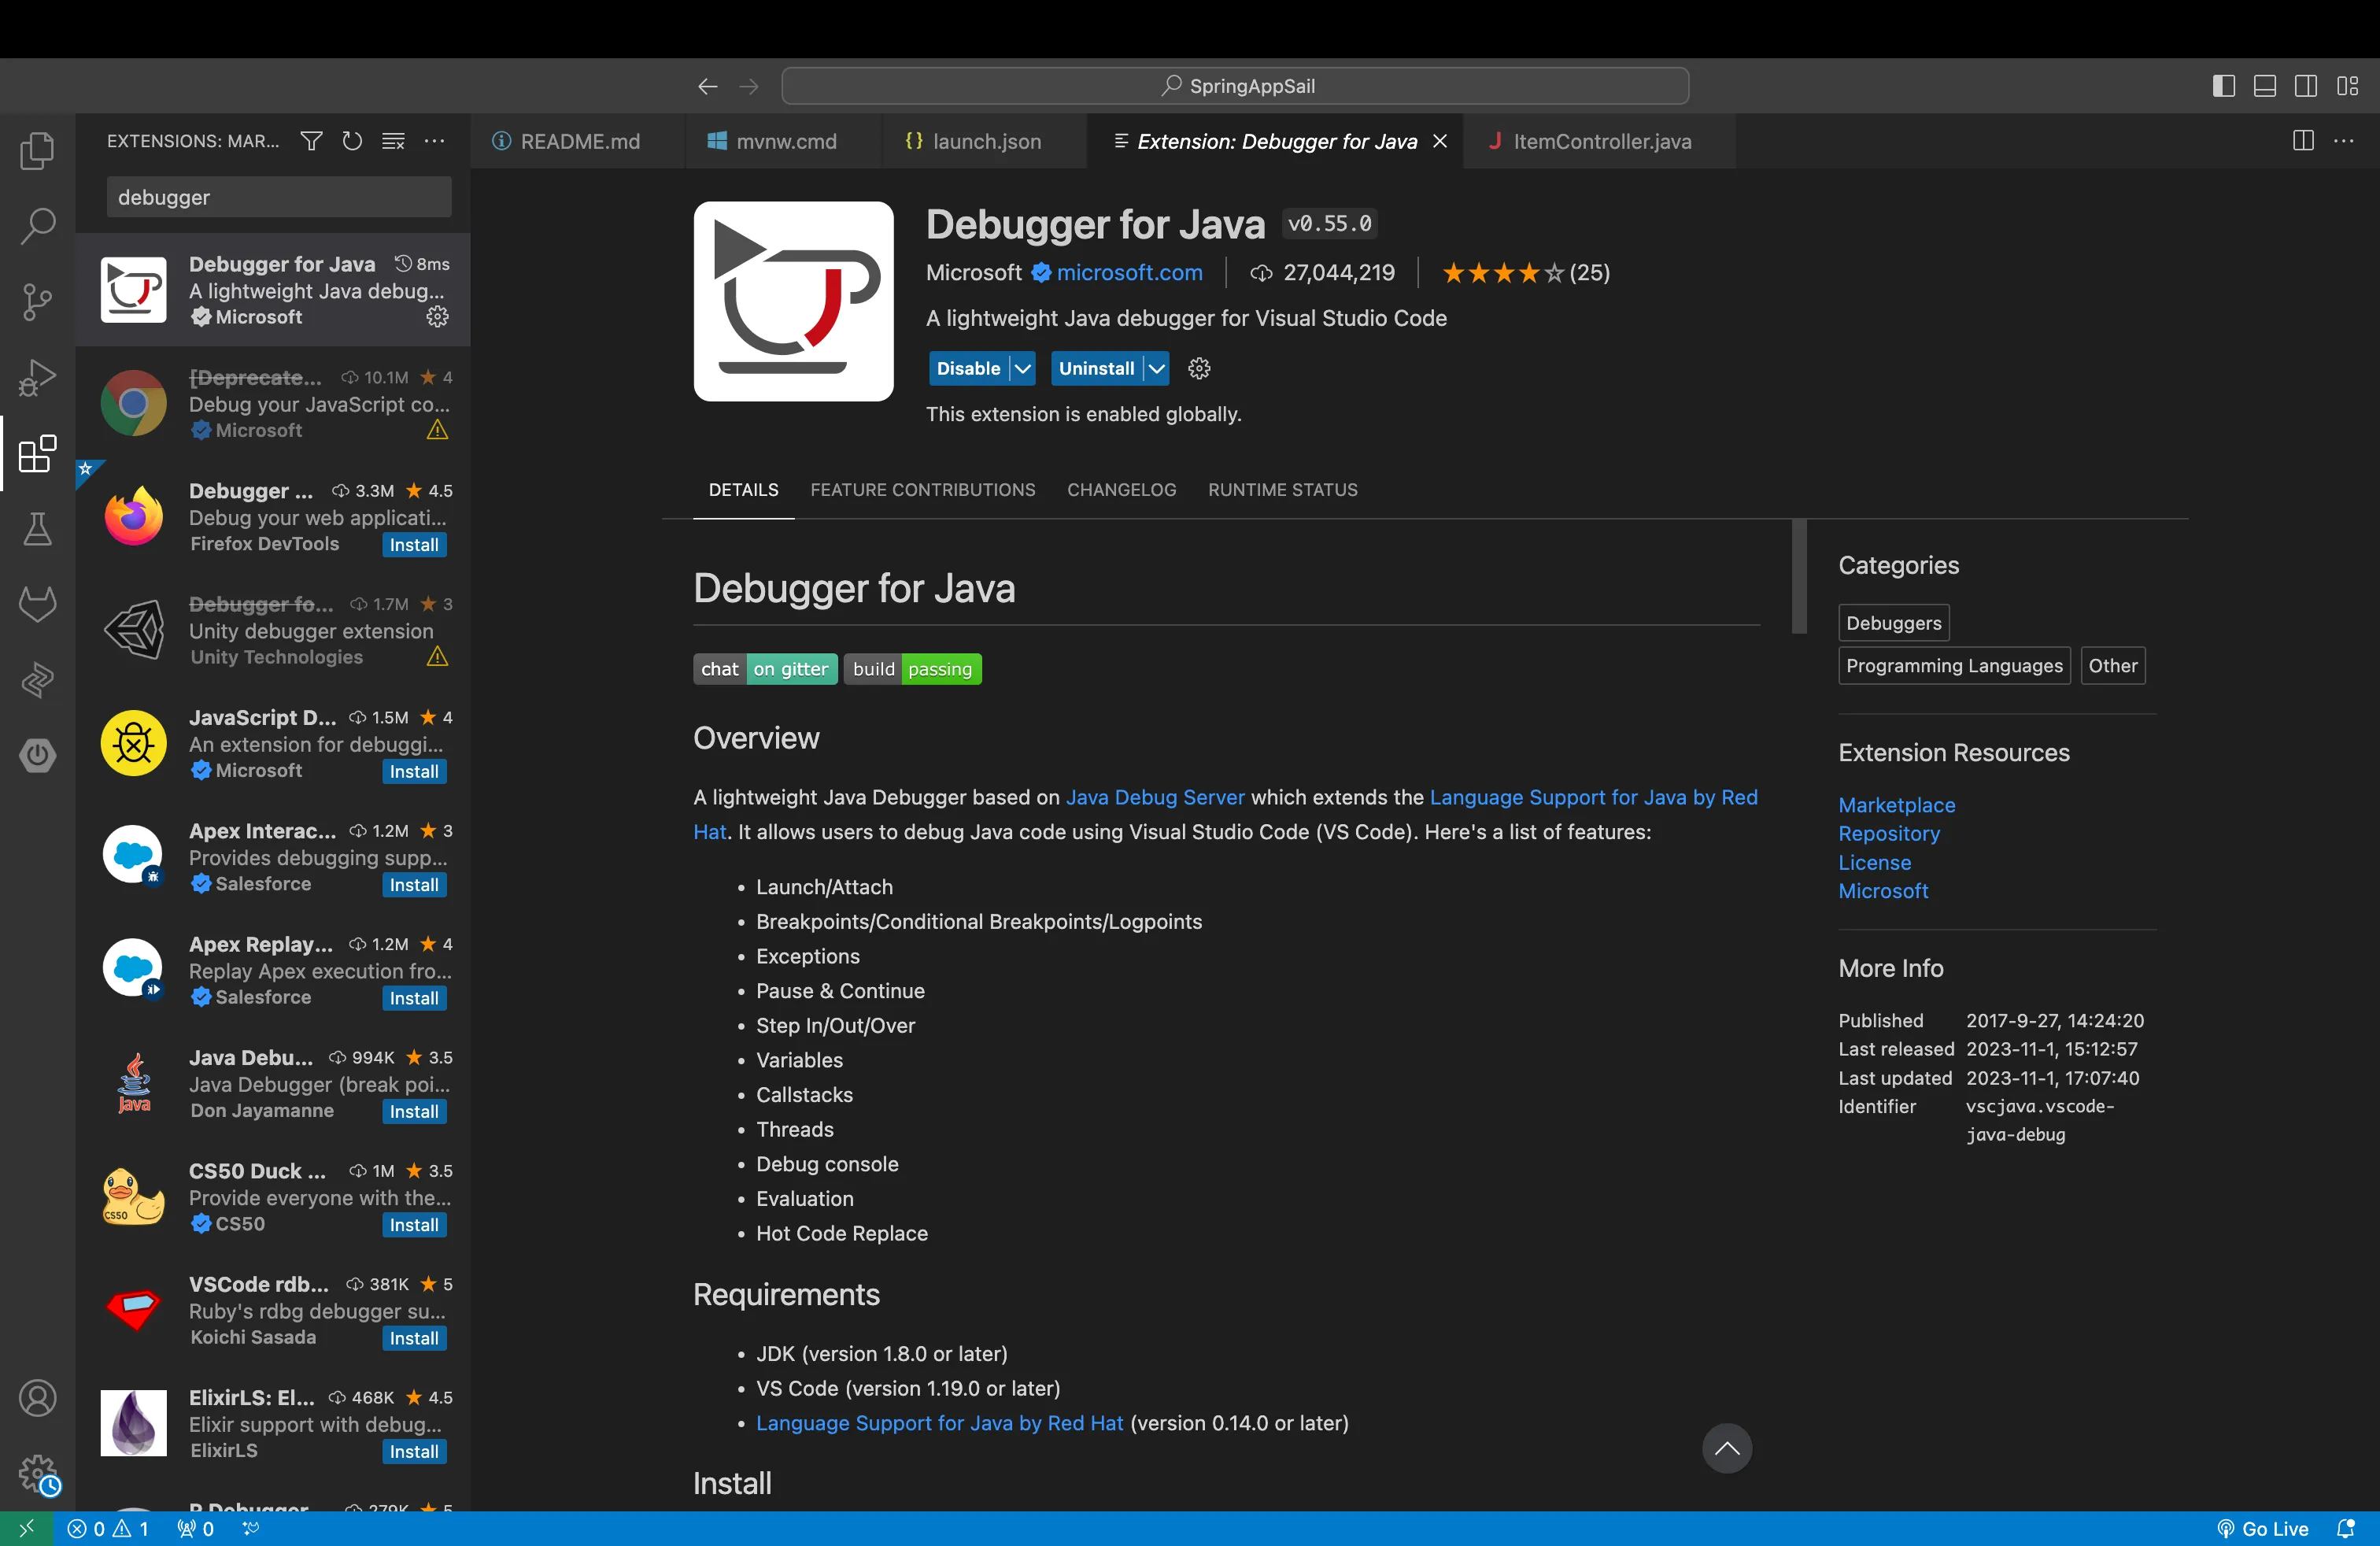
Install the following extension in your VSCode: Debugger for Java.
- After the extension is installed, click on Run, then Add Configuration… Select Java from the tool bar.
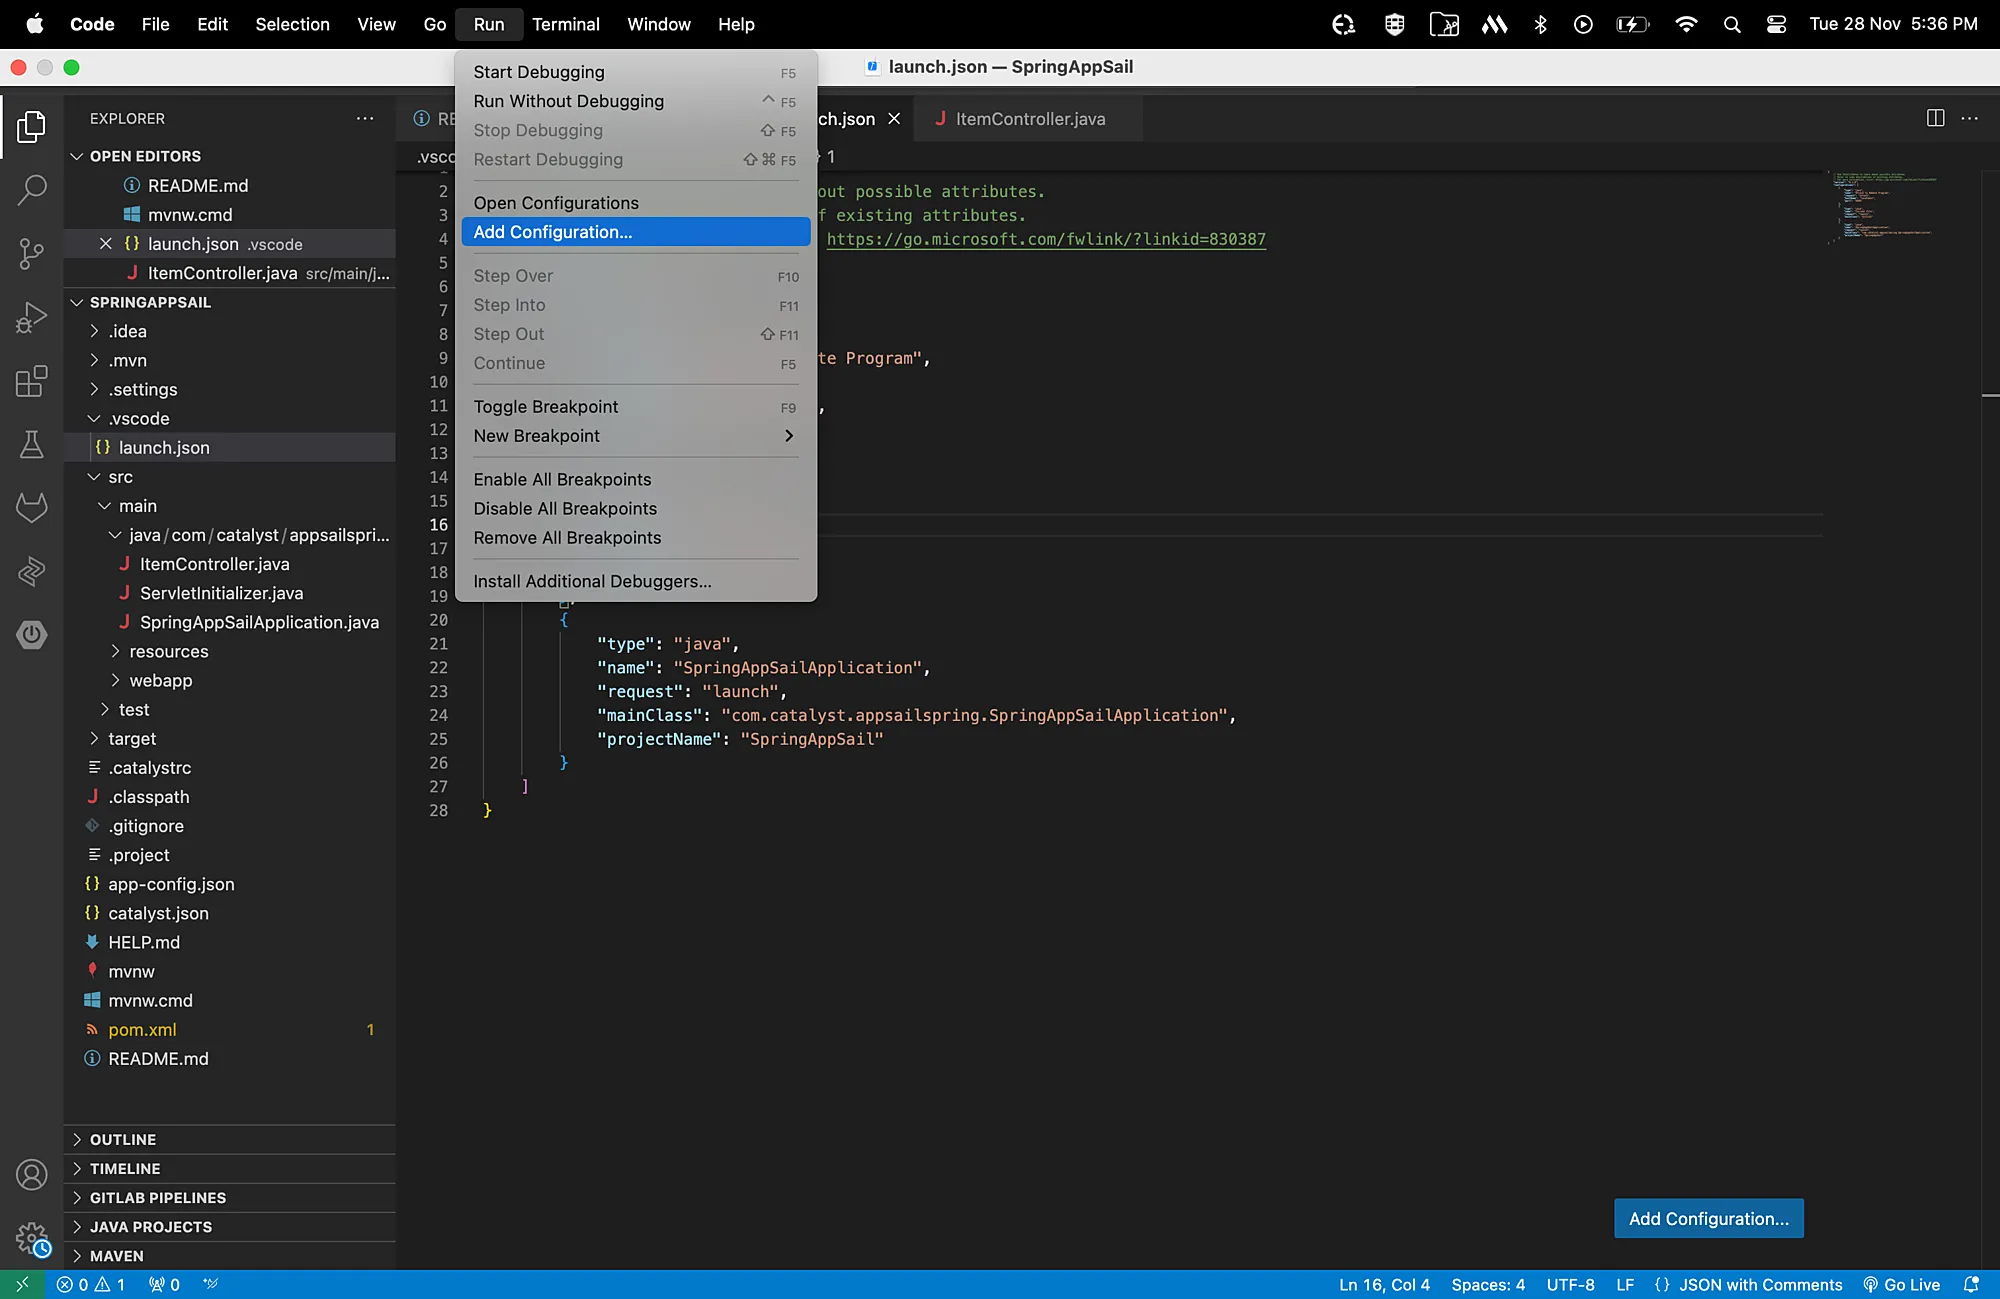
This will open the launch.json file.
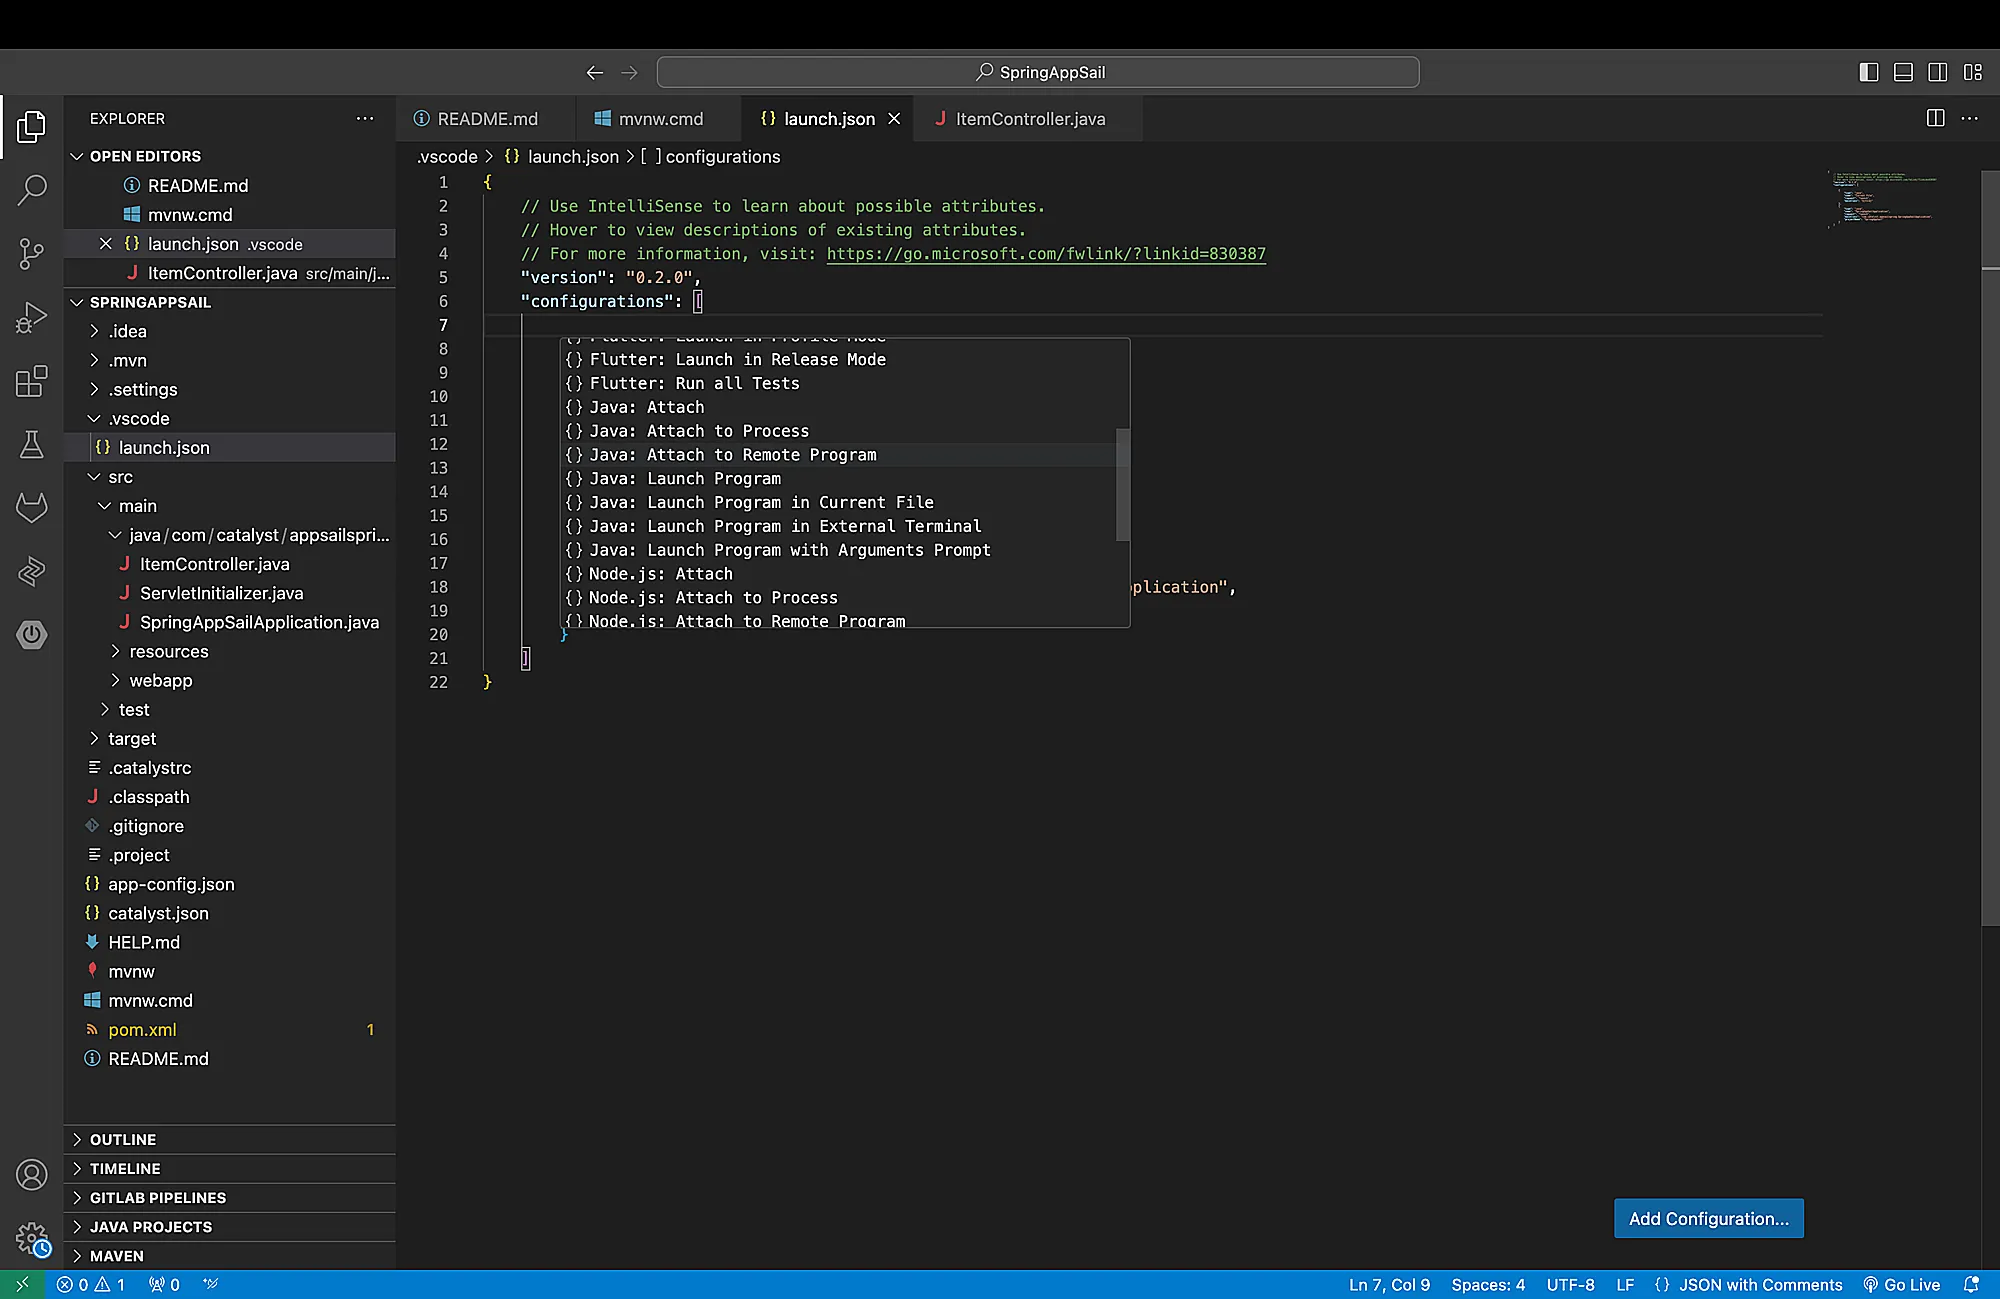
- Now click on Add Configuration… shown in the file and select the Java: Attach to Remote Program option.
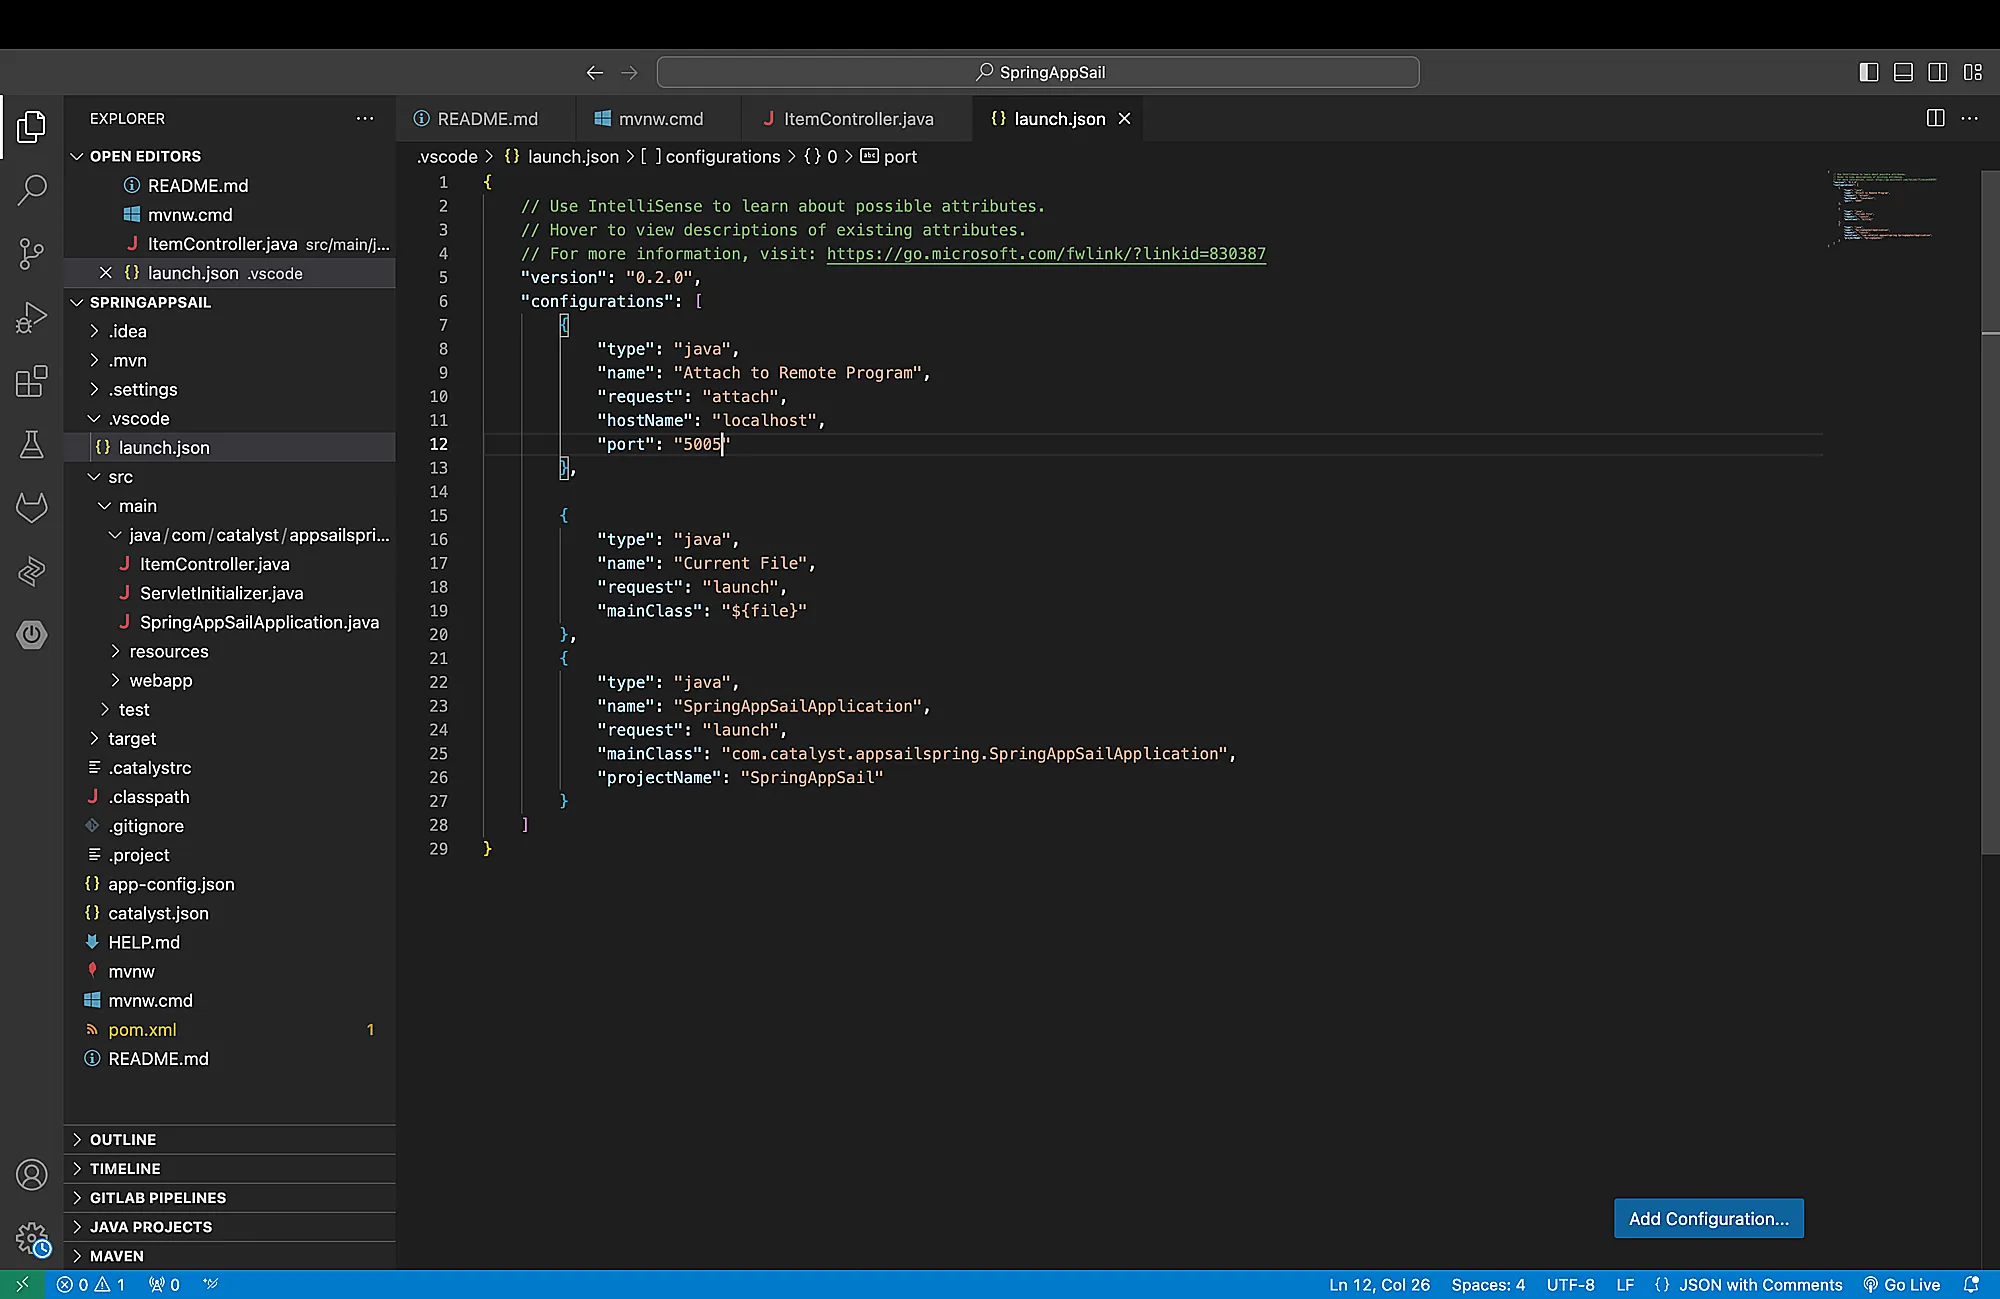
- Update the value of the “hostName” key as “localhost”. Then update the value of the “port” key as “5005”.
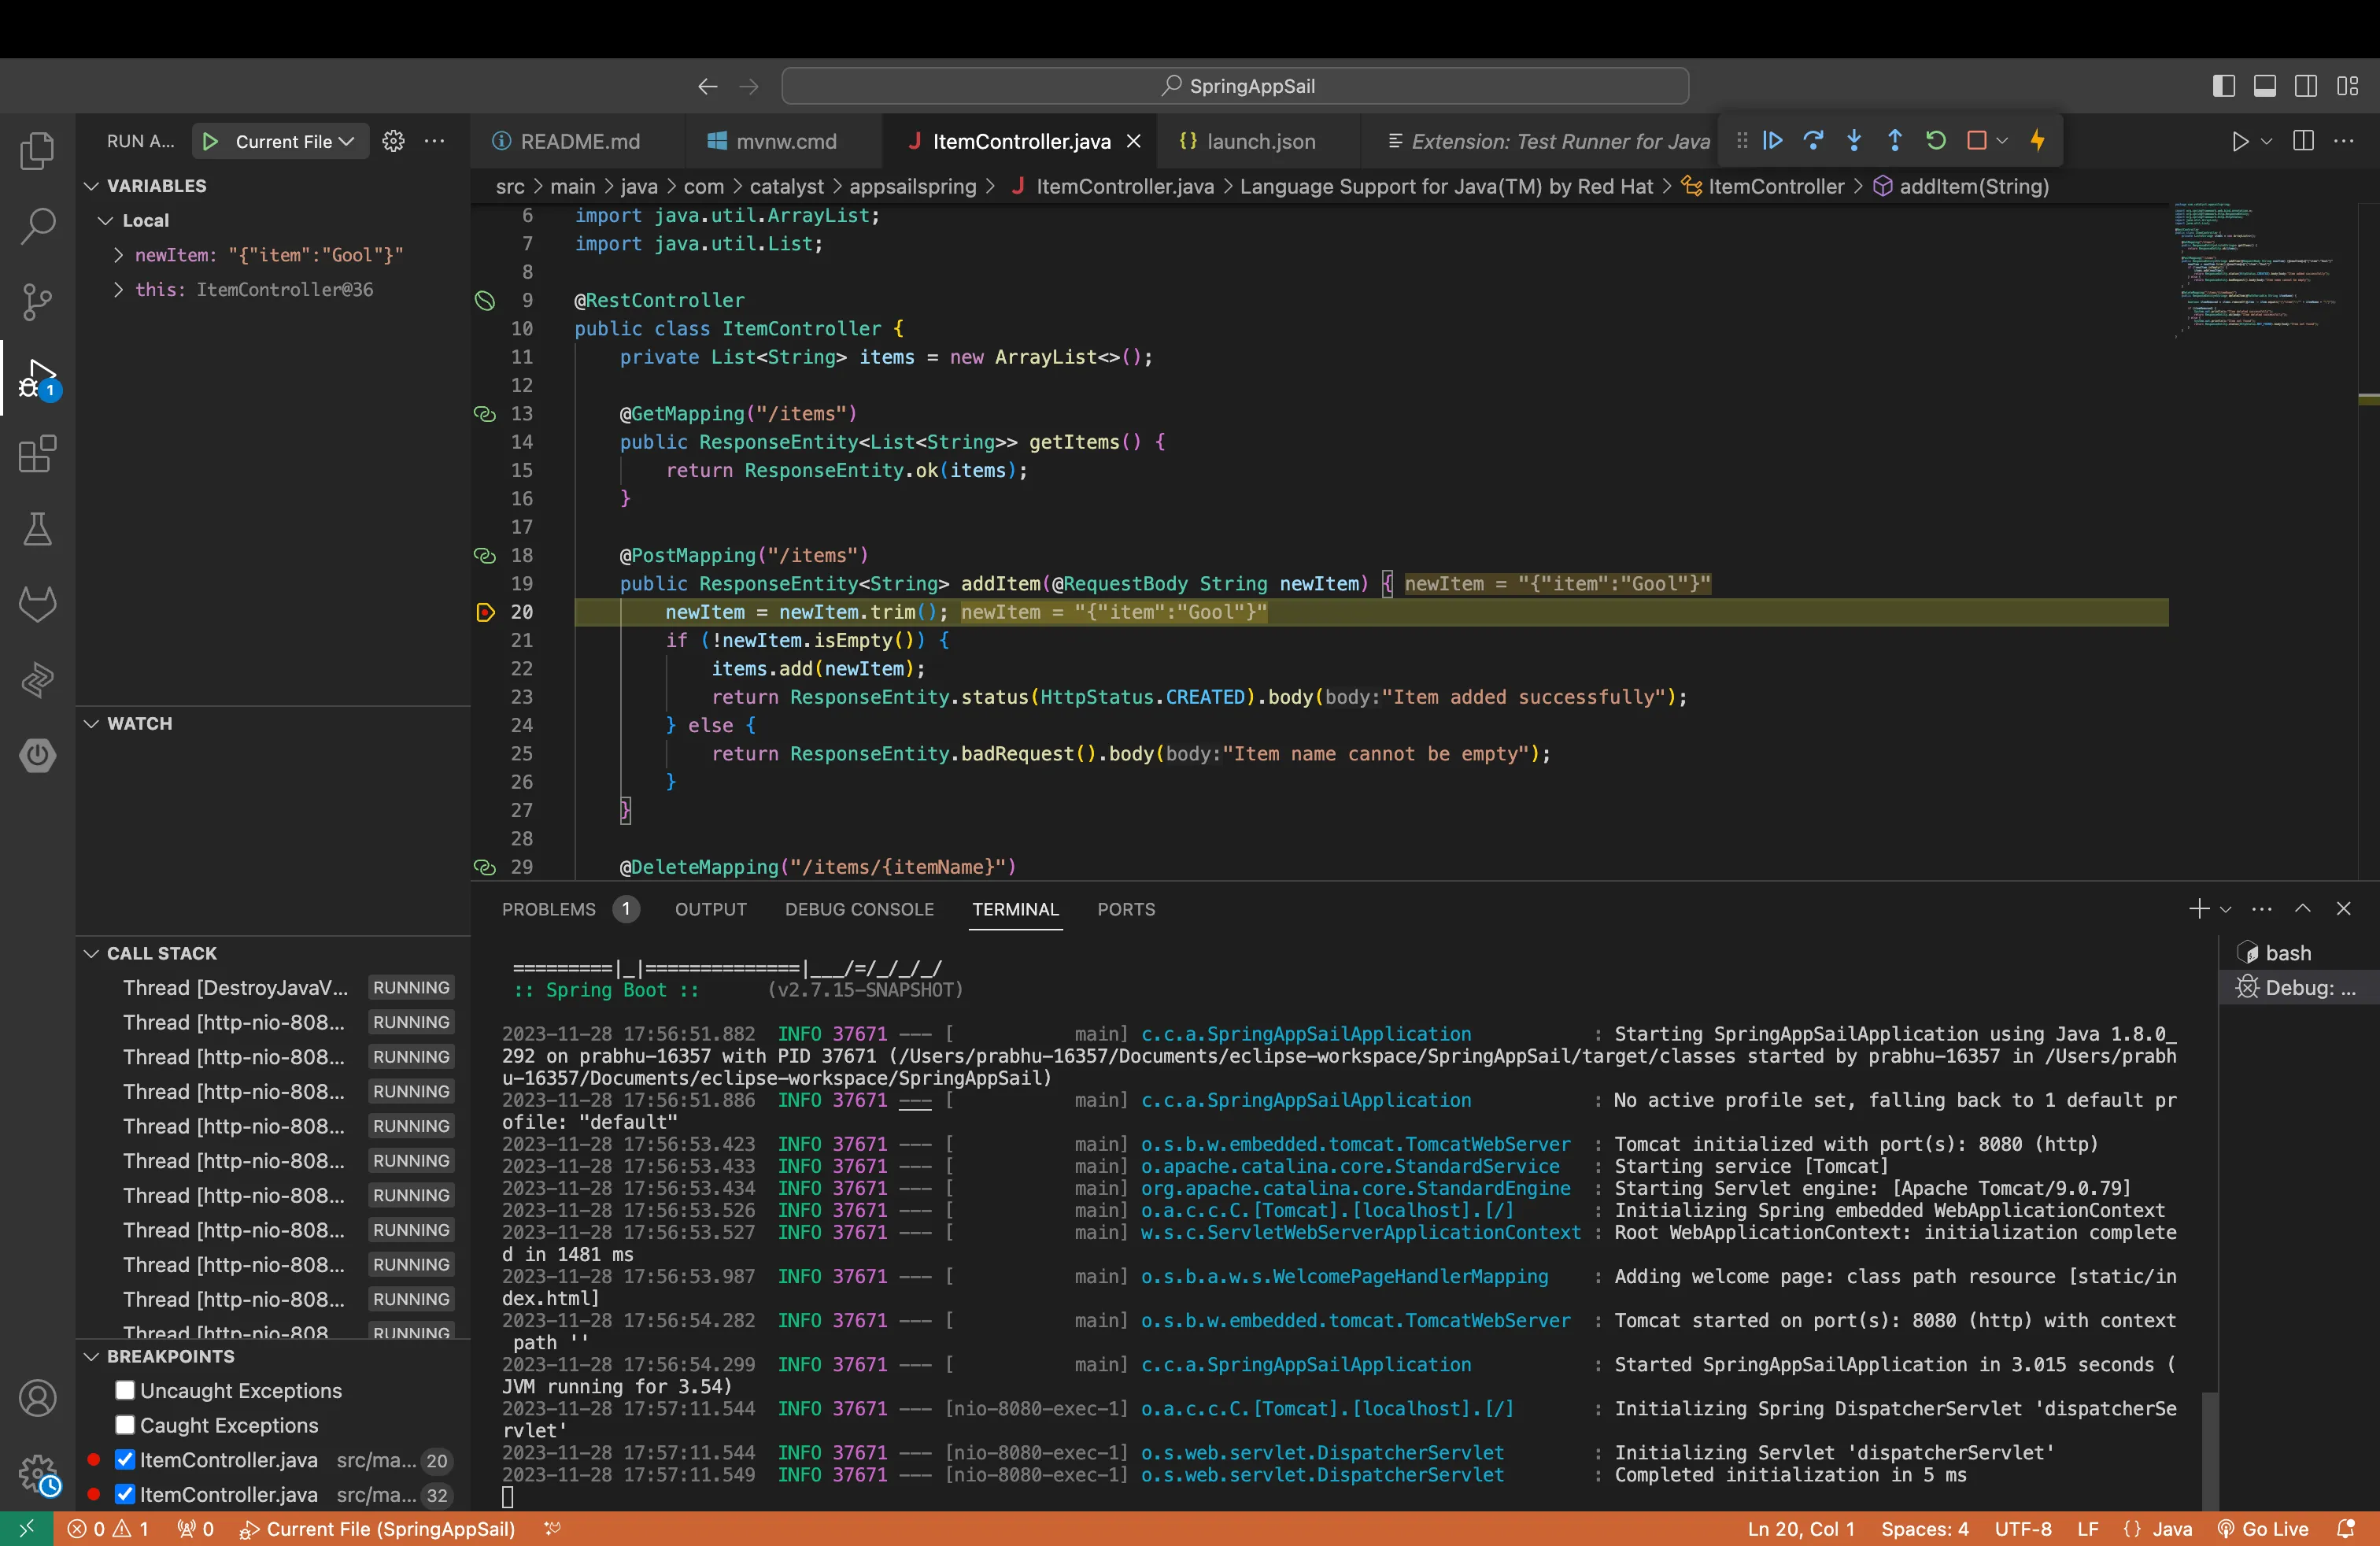
- Now navigate to Run from the toolbar and click Start Debugging to debug your application.
Debug a Spring MVC application in IntelliJ IDEA
Follow the steps provided in this section to debug and test a Java application built on the Spring MVC framework in the IntelliJ IDEA environment.
Prerequisites: A Spring MVC application created and available in IntelliJ IDEA
-
Open the Spring application project in your IntelliJ IDEA.
-
Run the Spring application using the following command in the IDE’s terminal:
        copy


         mvn spring-boot:run -Dspring-boot.run.jvmArguments="-Xdebug -Xrunjdwp:transport=dt_socket,server=y,suspend=n,address=5005"
- Right click on the Run option in the toolbar and click Debug.
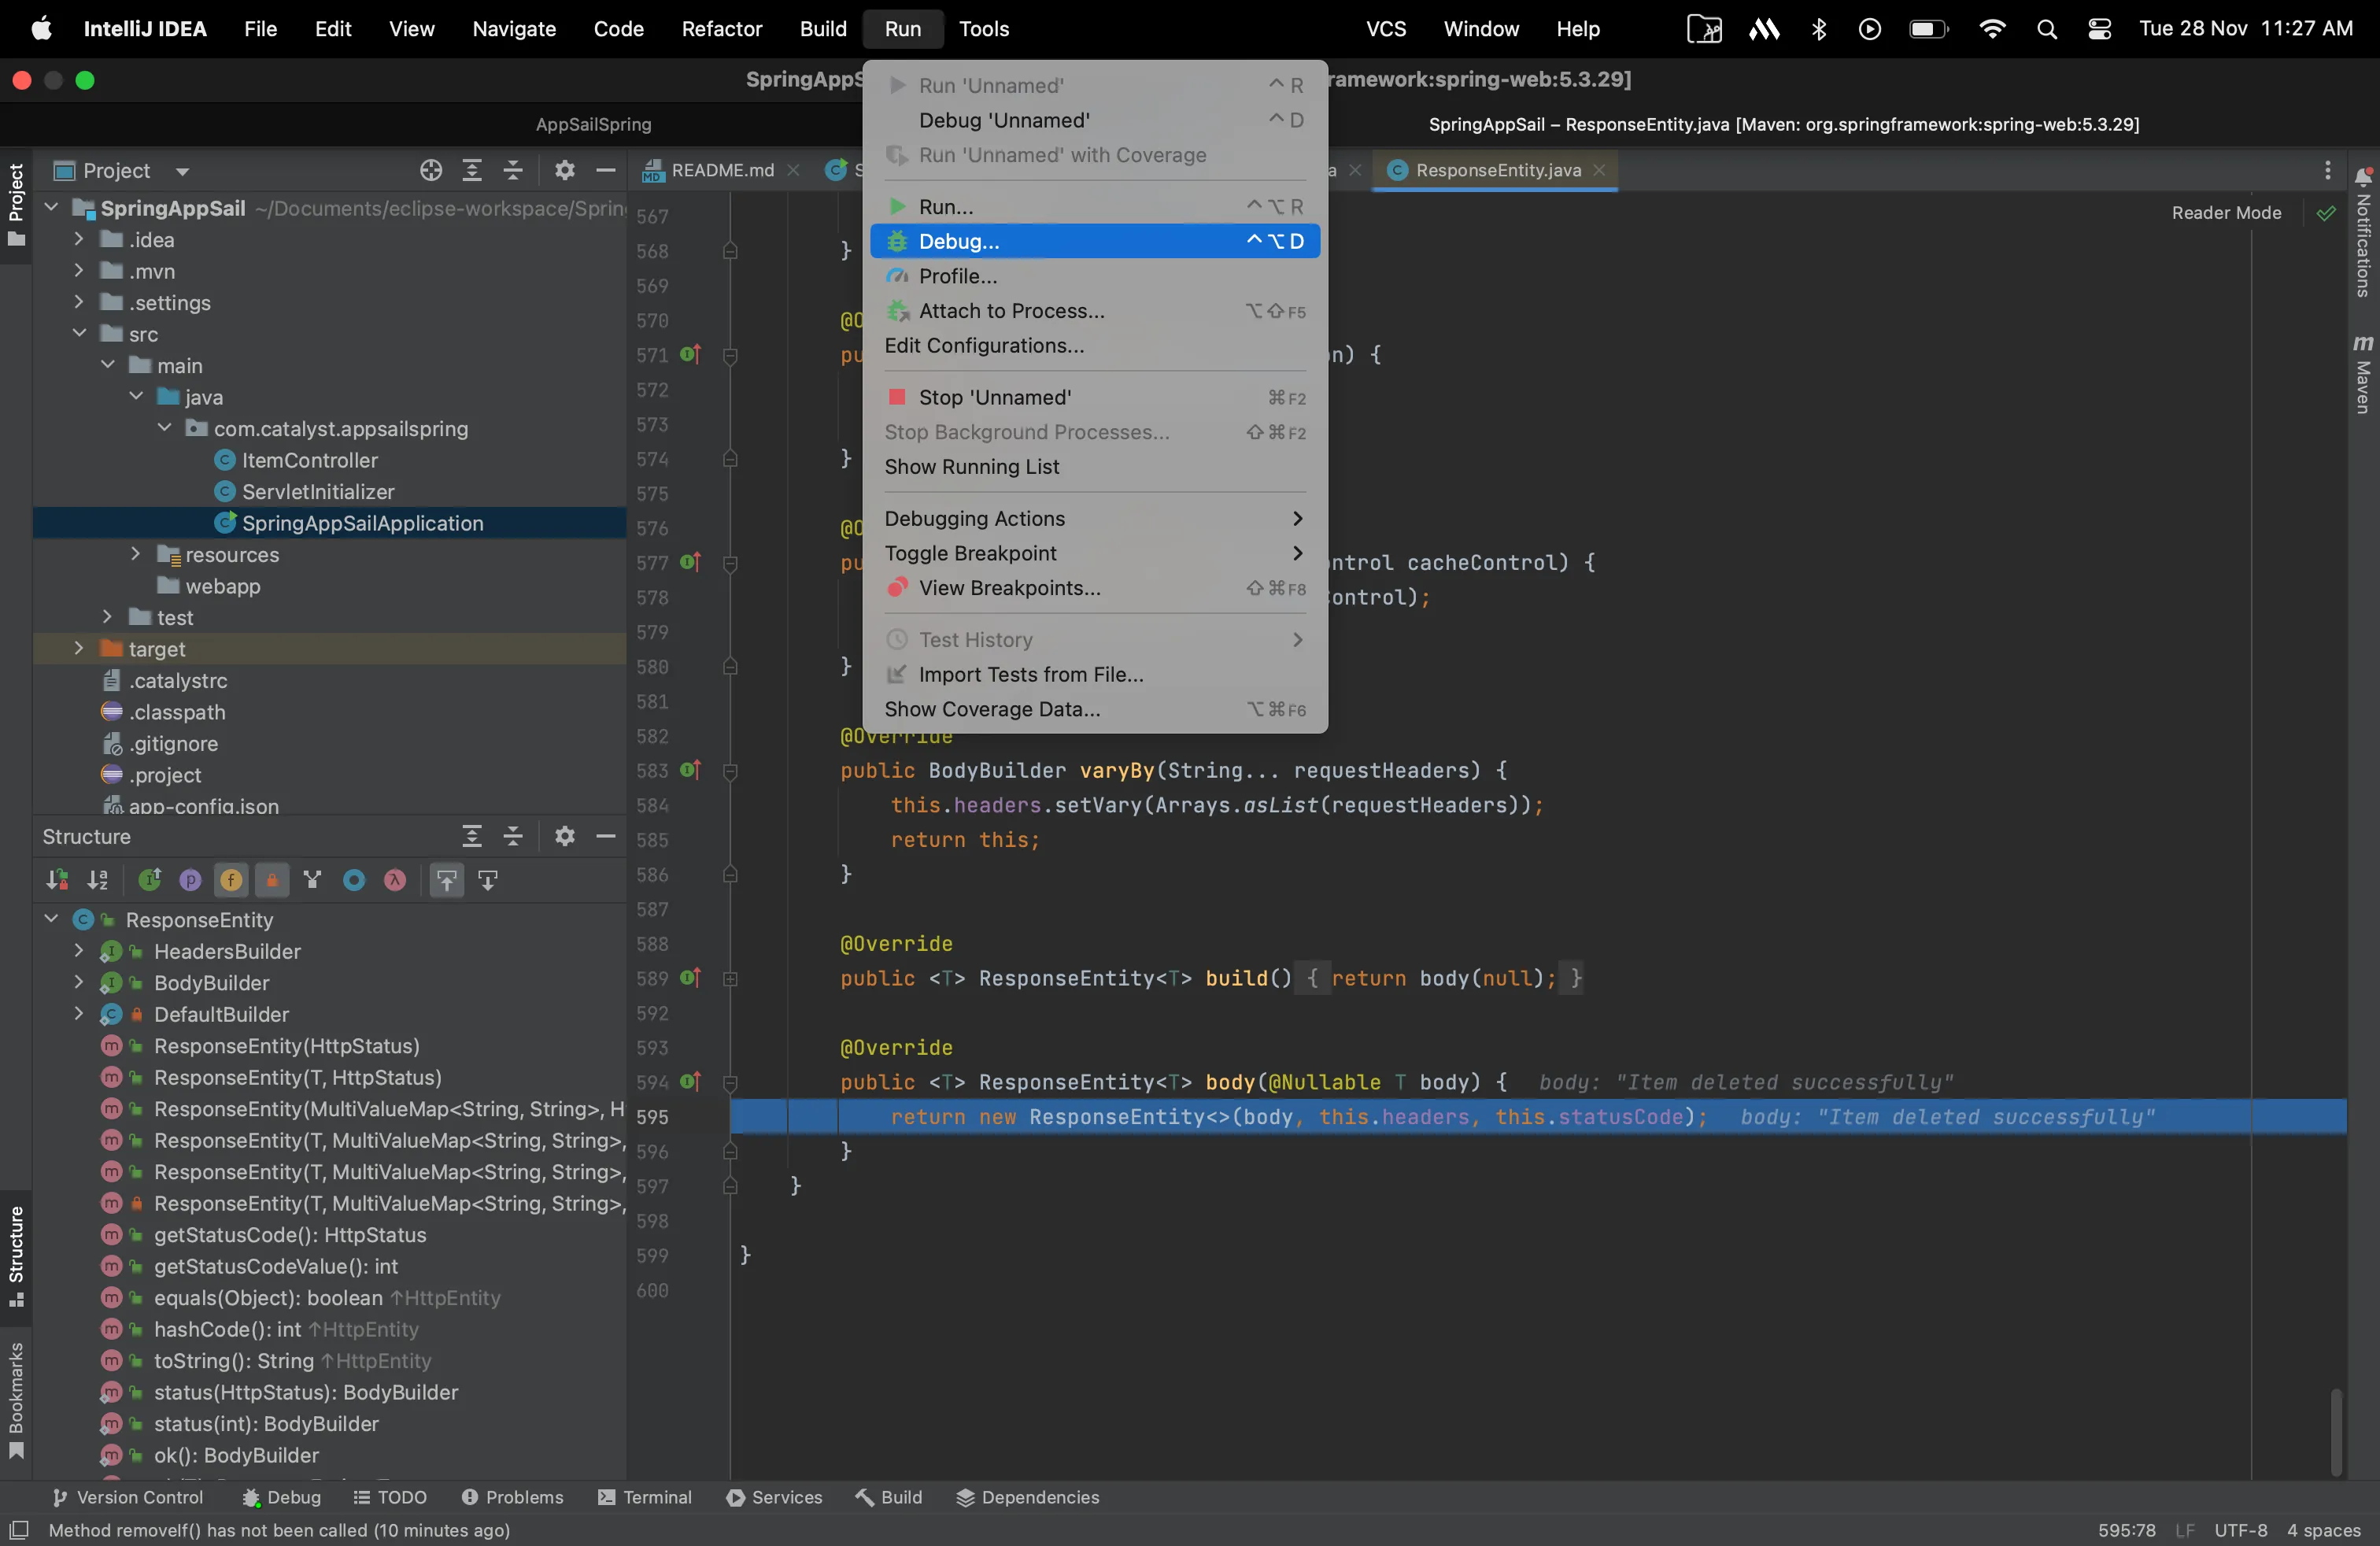
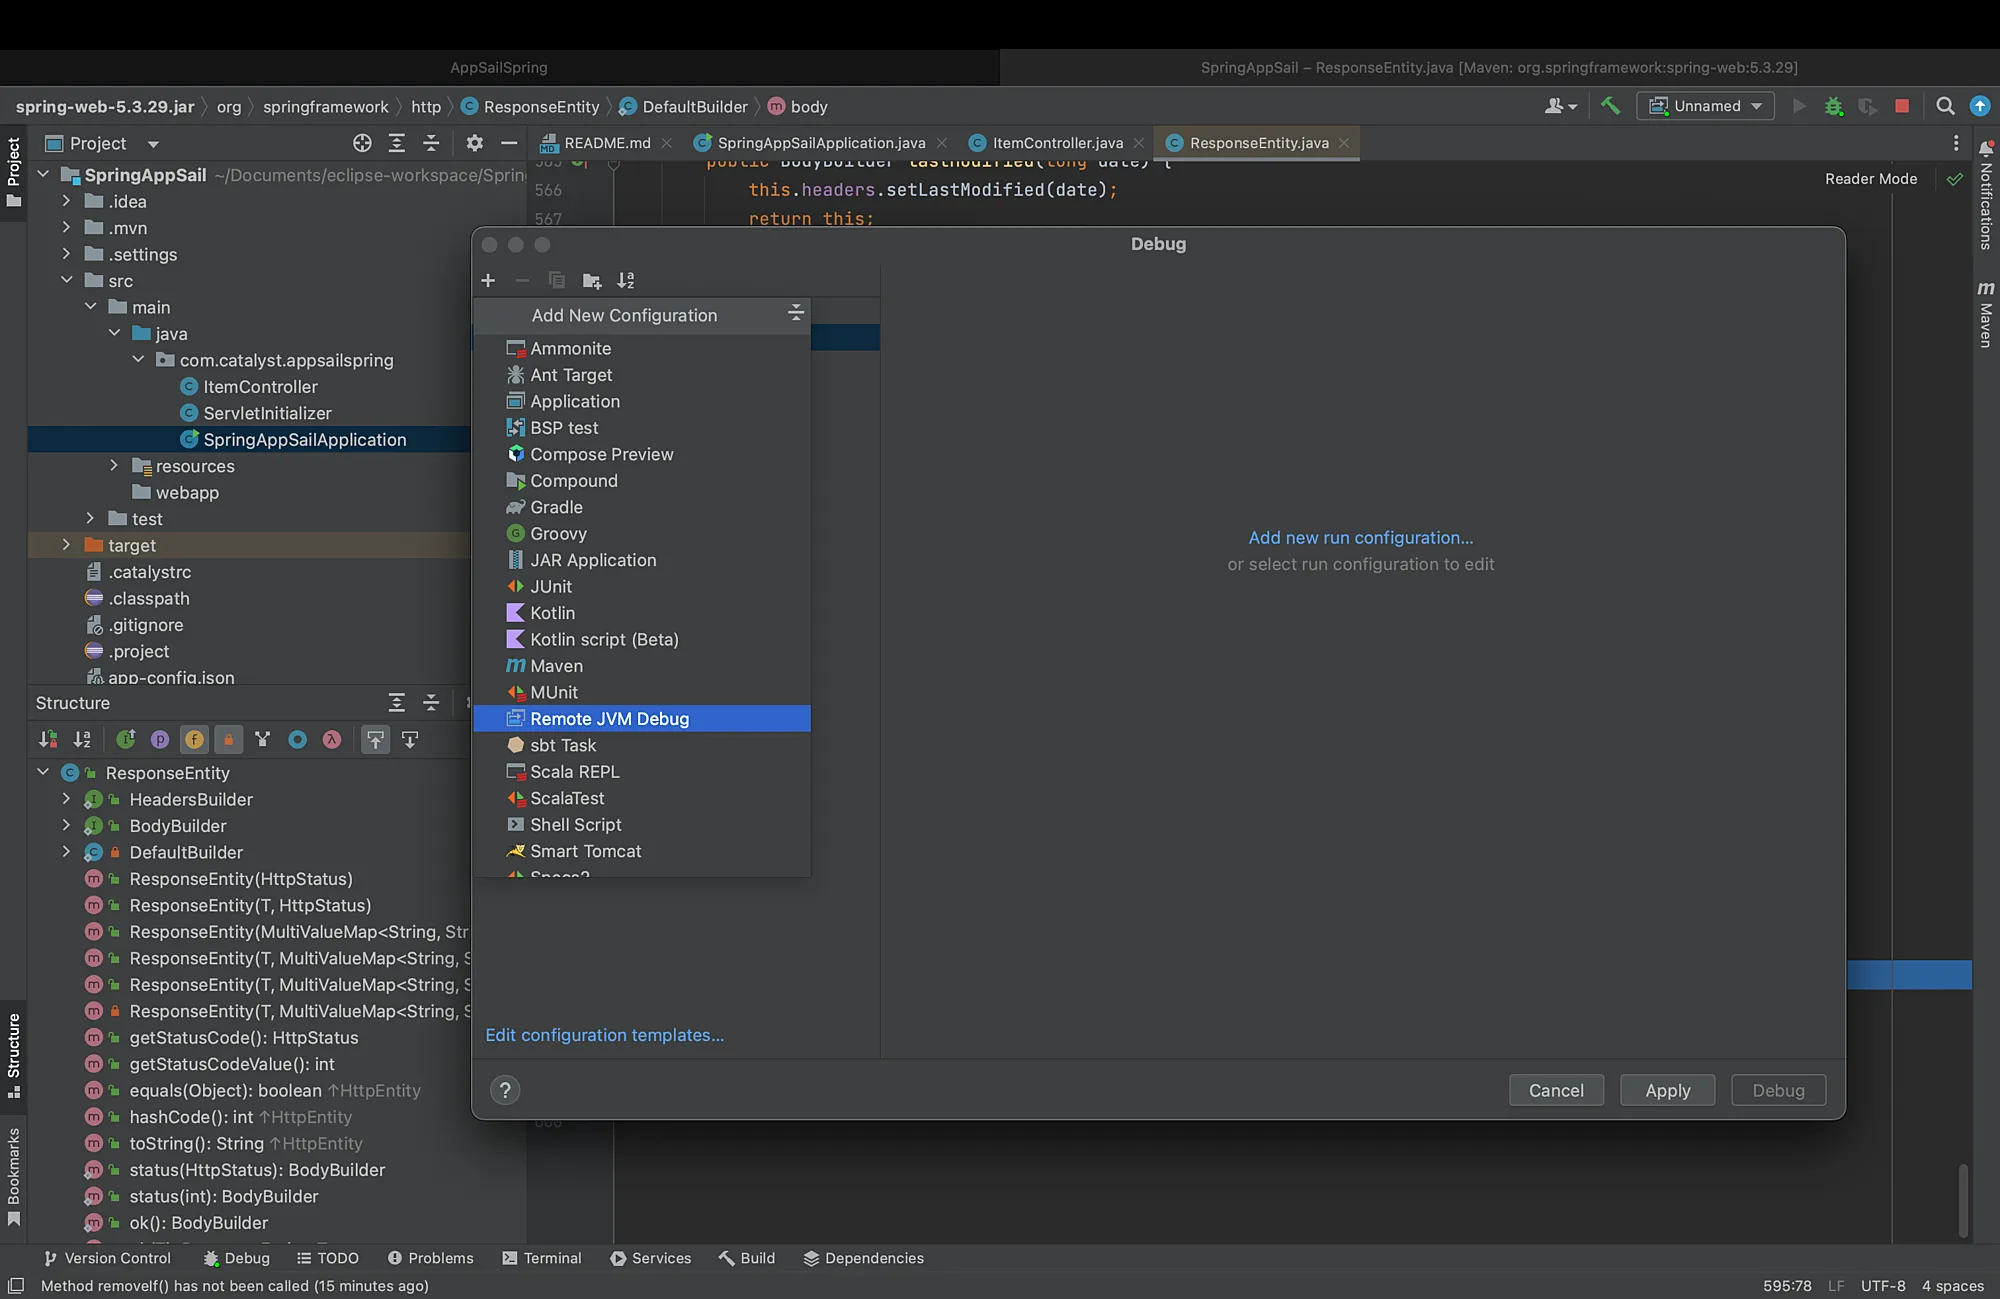
- Now either click Edit Configurations and click on the + icon to create a new configuration, or click Add New Configuration and click Remote JVM Debug.
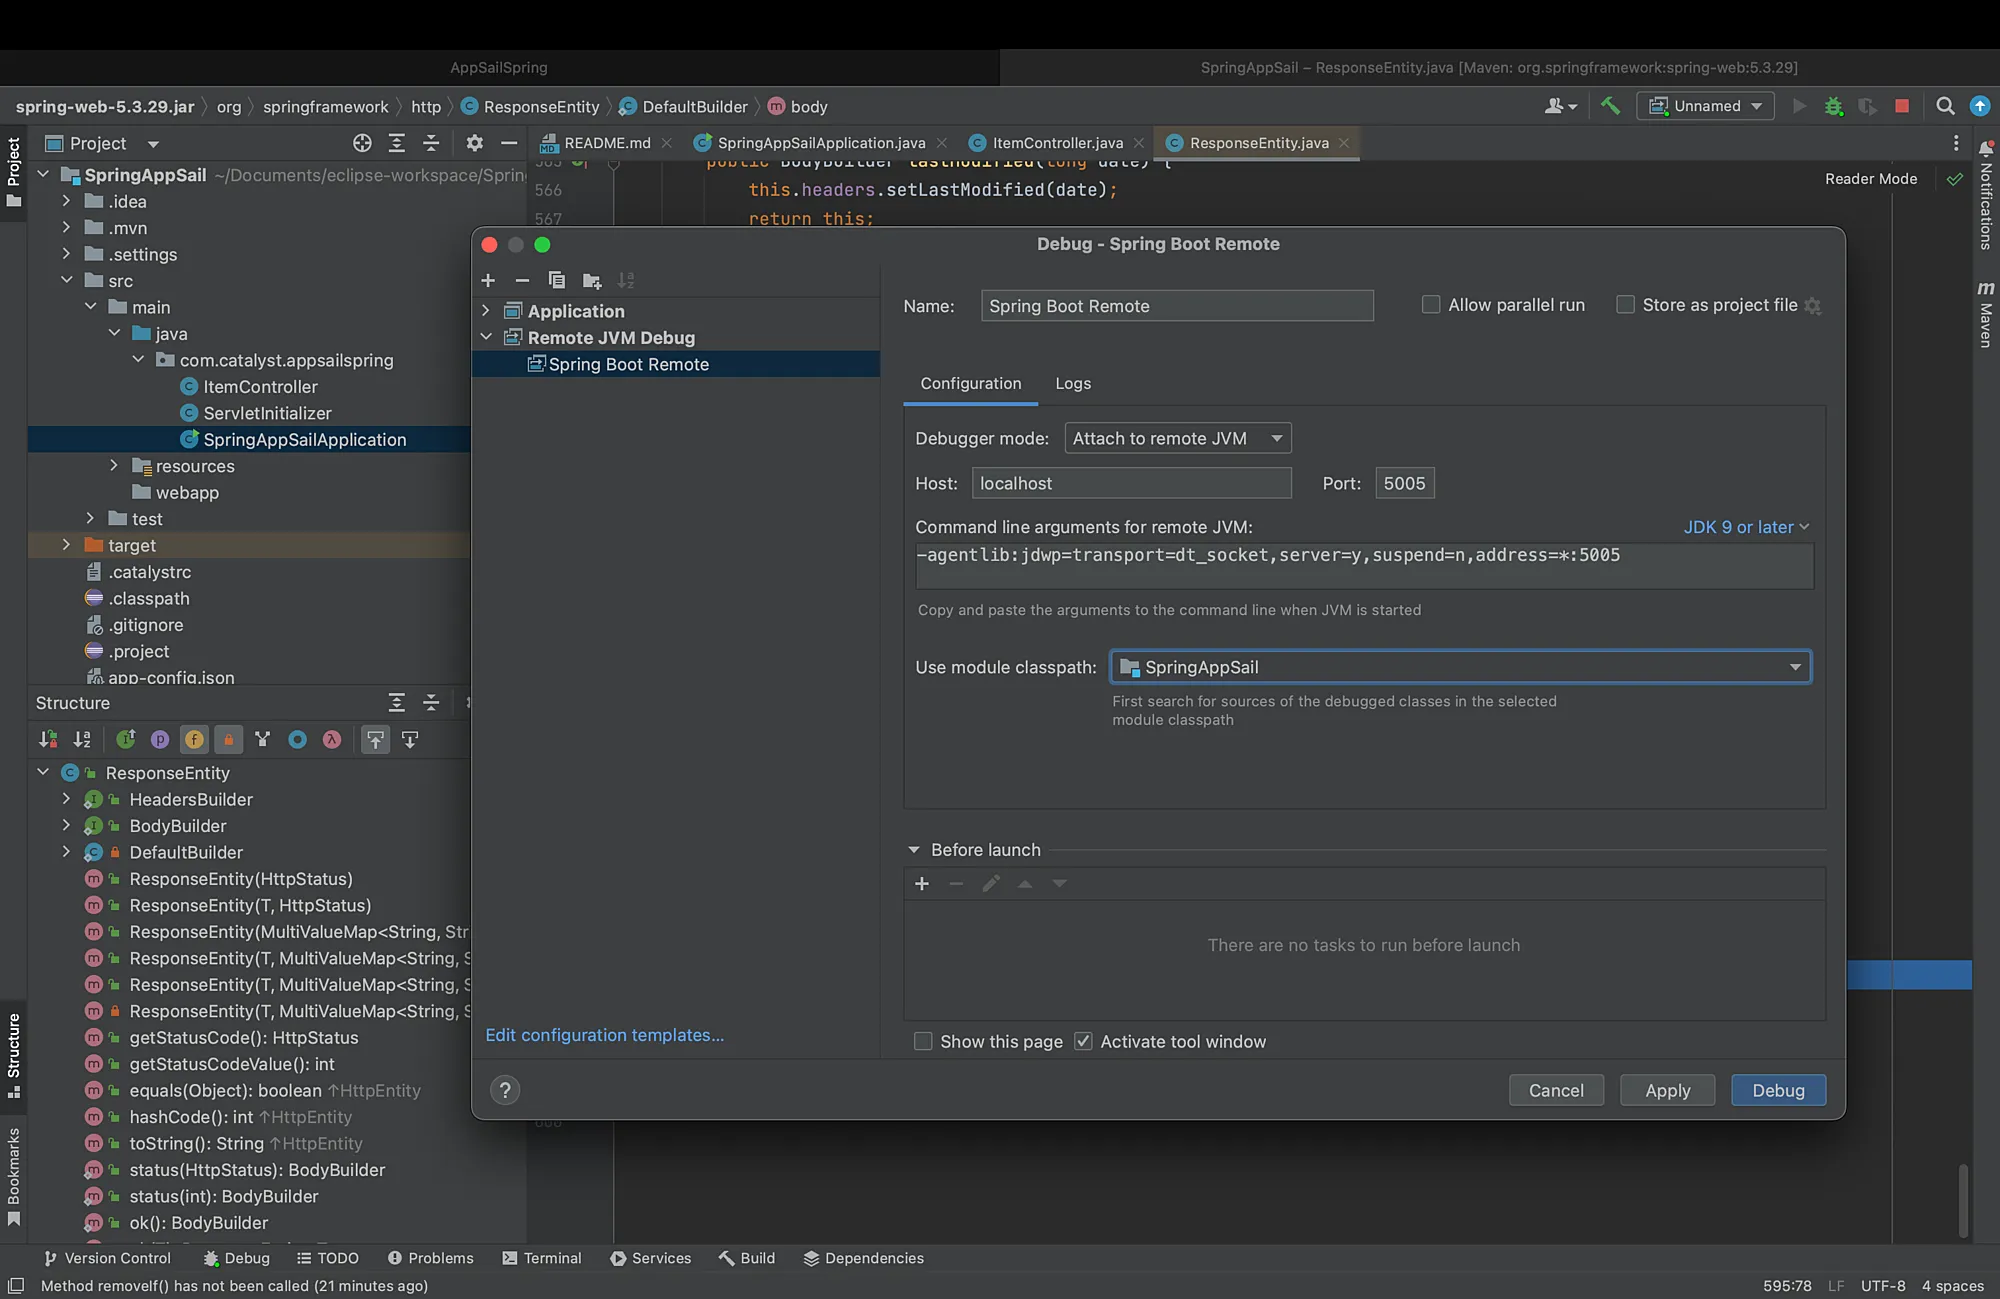
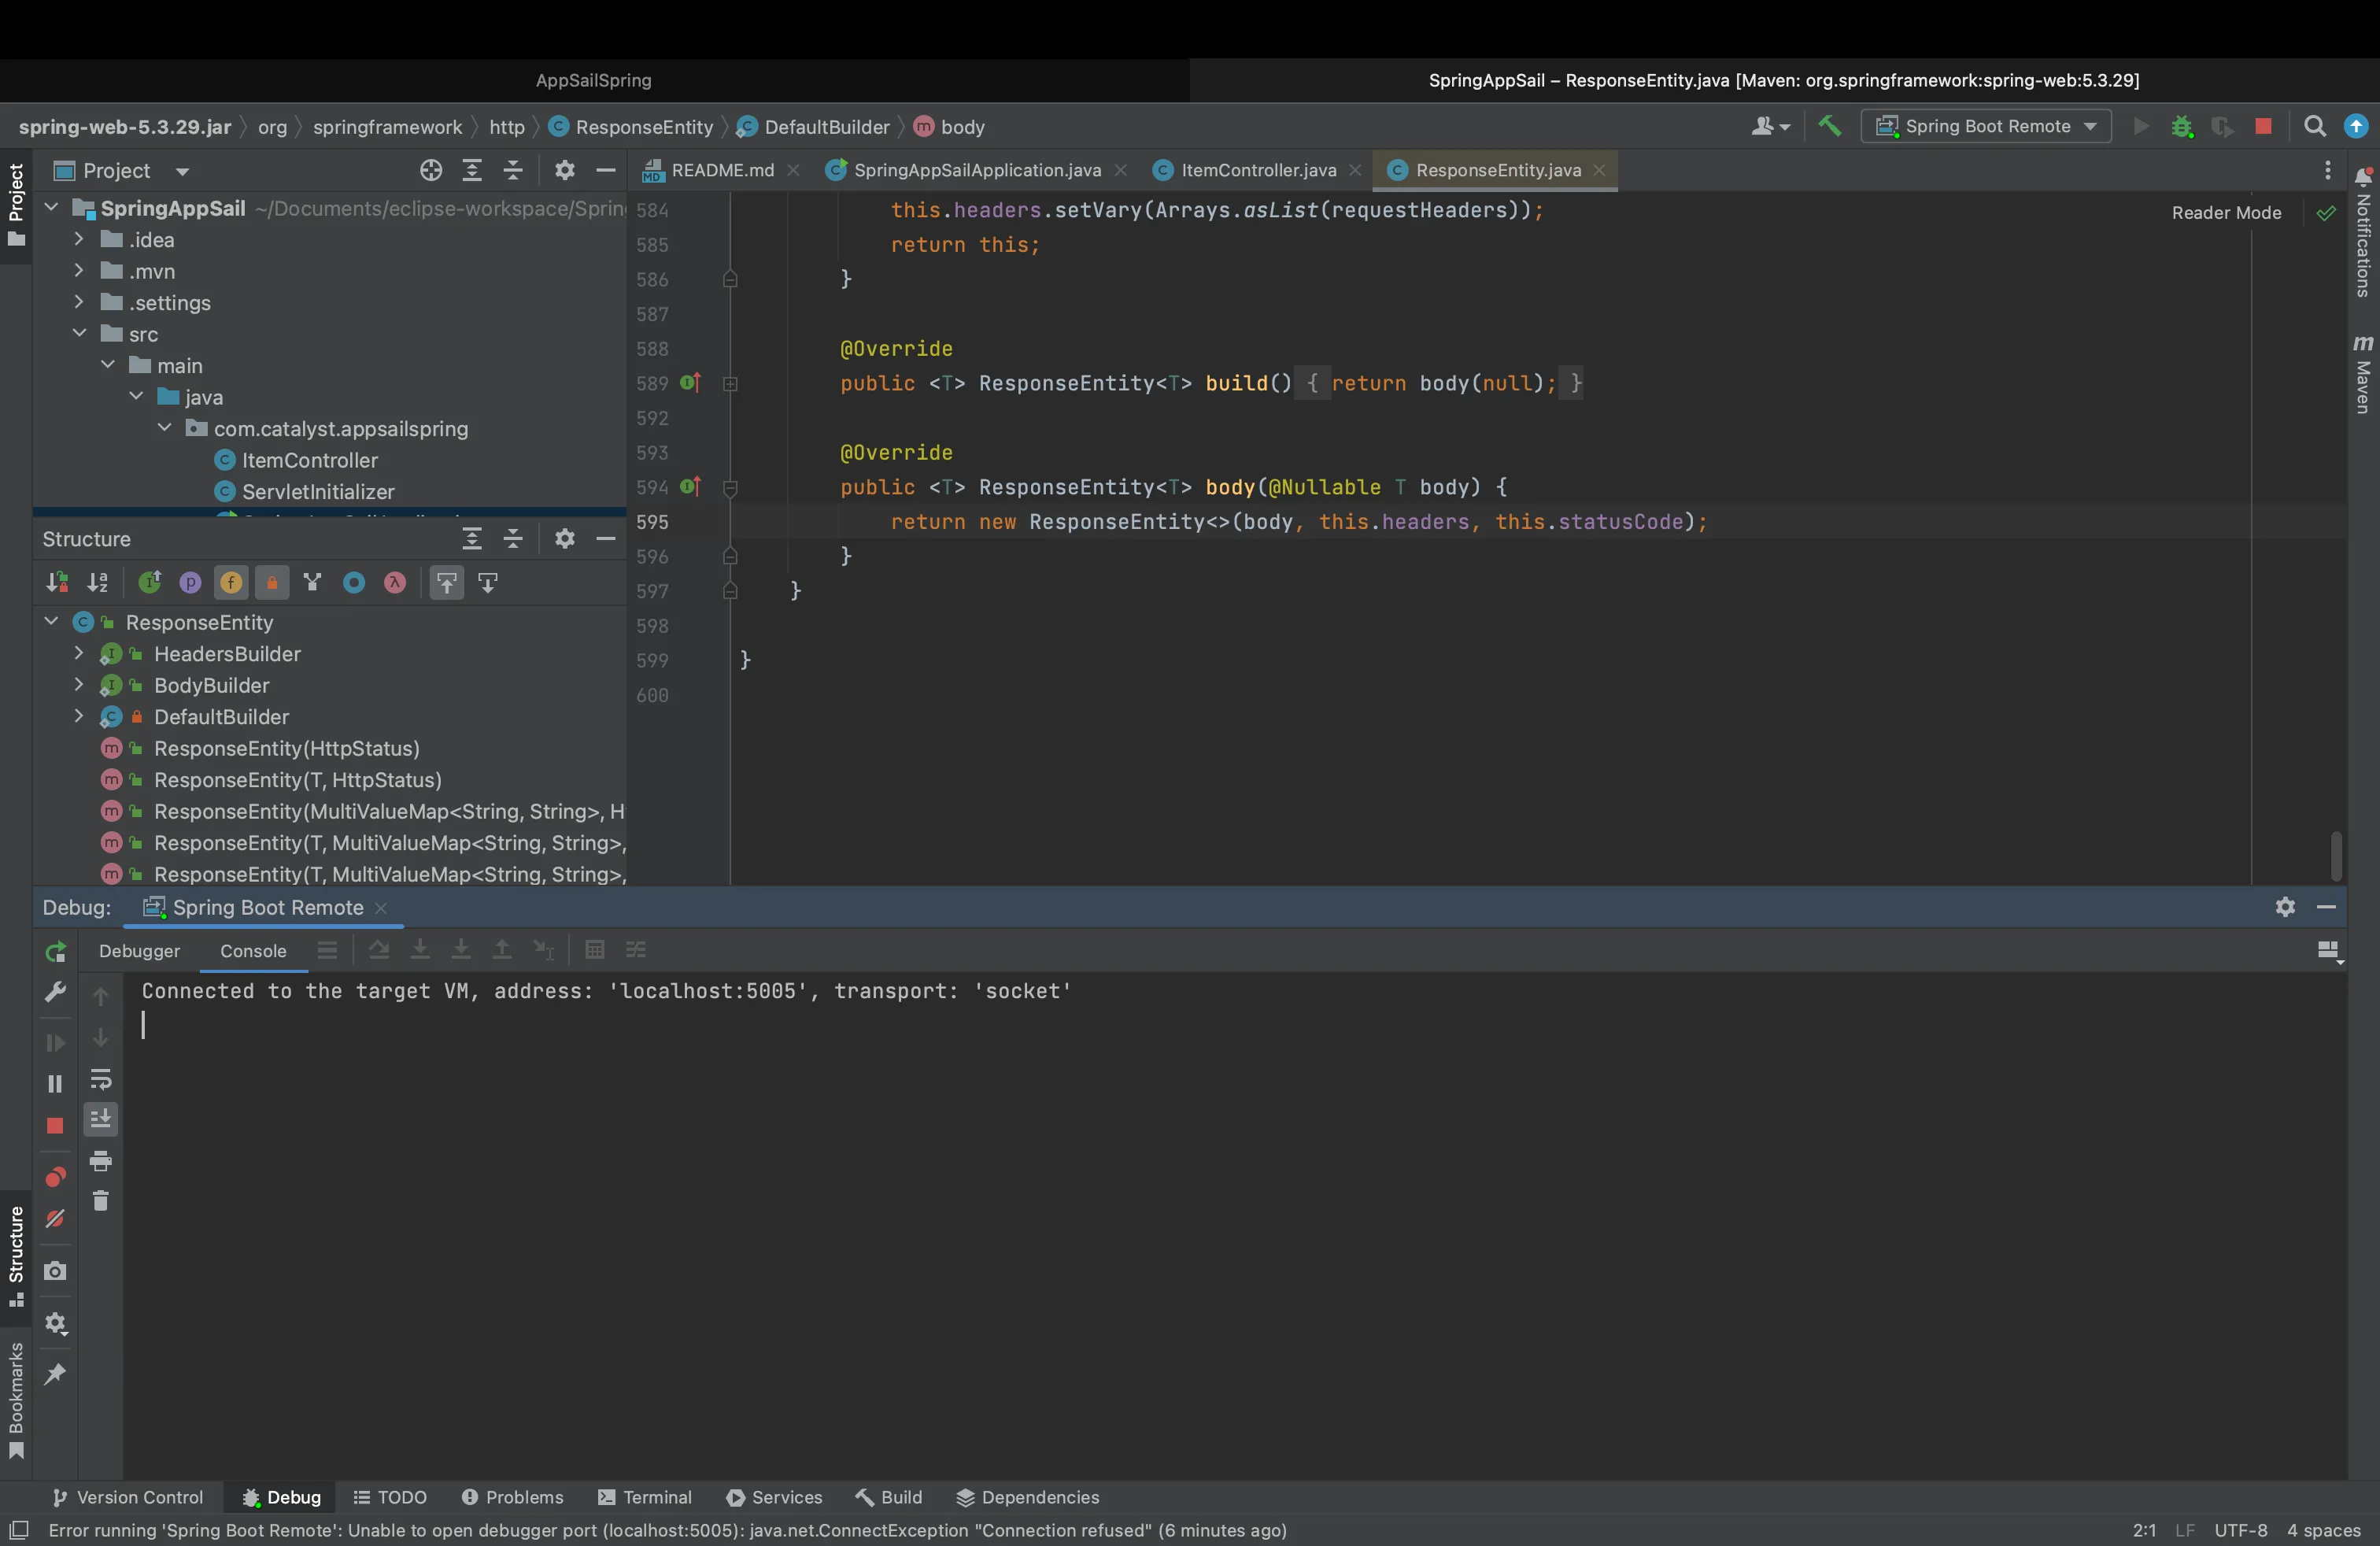
- You can change the port number as per your requirements. In this example, we will port “5005”. Now verify that the “Use module classpath” points to your Spring application, then click Debug.
- Verify if the Debug Console displays the following: “Connected to the target VM, address: ’localhost:5005’, transport: ‘socket’”
- You can now create breakpoints in your Spring application and start debugging it.
Last Updated 2025-02-19 15:51:40 +0530 +0530
Yes
No
Send your feedback to us