Model Evaluation
The Model Details page contains evaluation metrics that help y ou understand model performance during the training and validation process, clustering visualizations to view the customer dispersion between clusters , and model versioning details.
Model versions are typically used to track the improvement or degradation of the performance with selected metrics as evaluation criteria for frequent model trainings.
Evaluation metrics
Clustering metrics are derived by the performance of the model during the training and validation process , similar to any machine learning model .
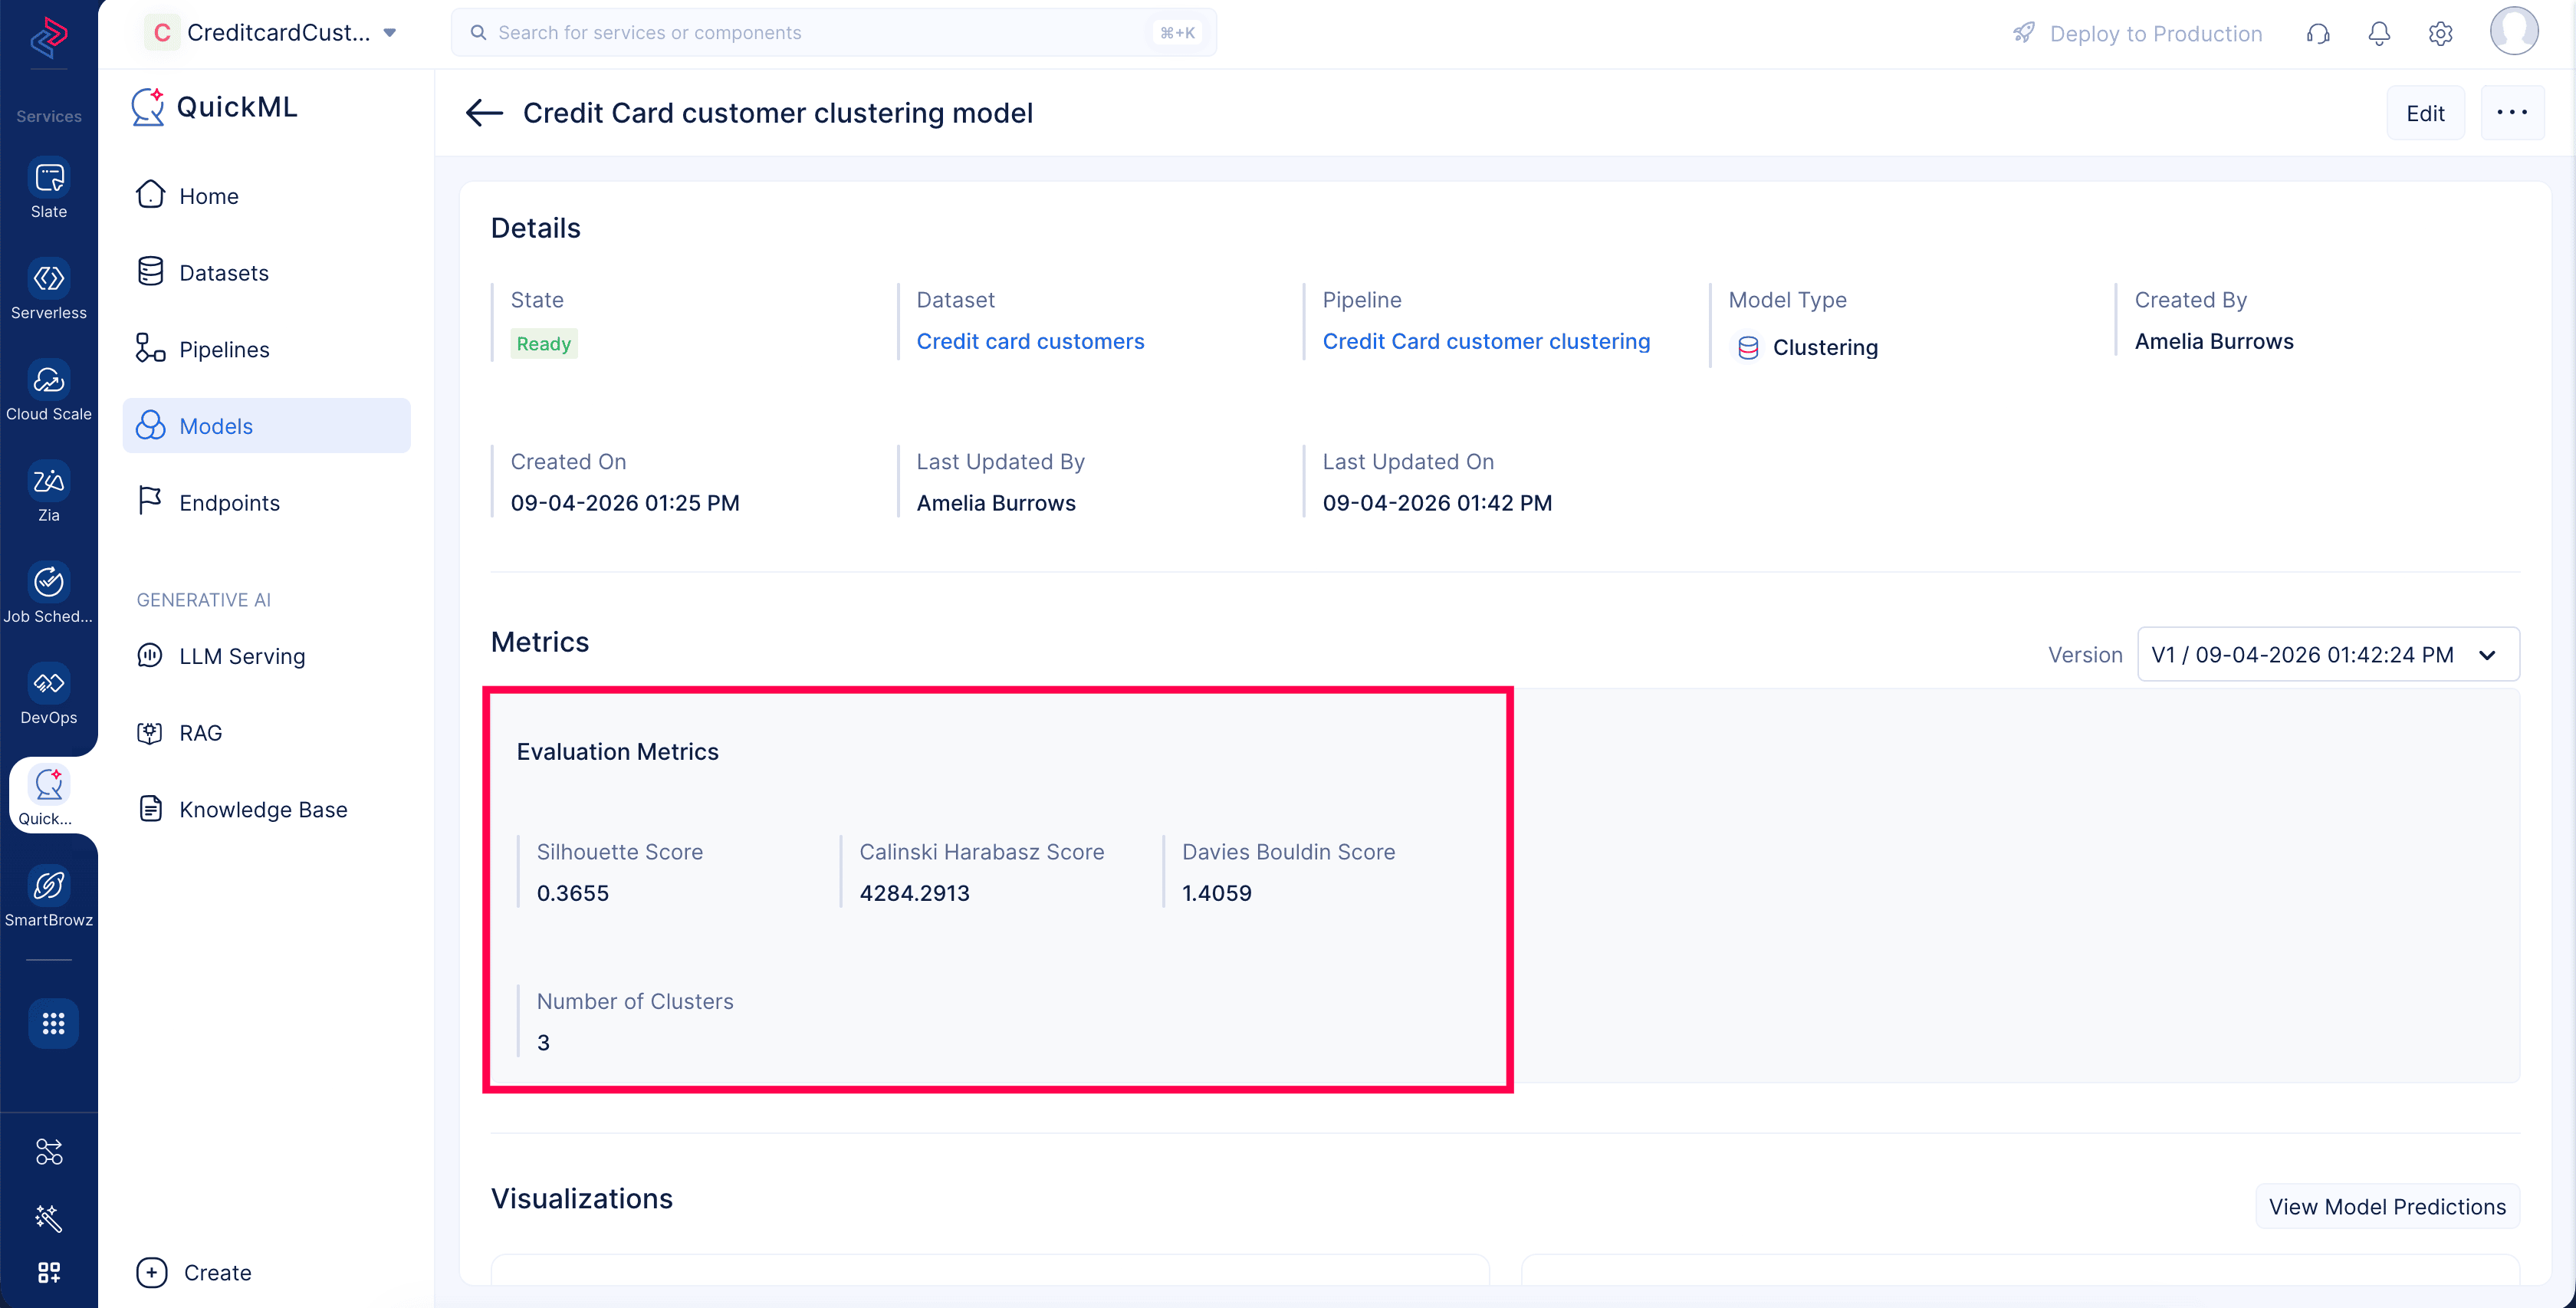
Learn more about model evaluation metrics in our documentation .
Visualizations
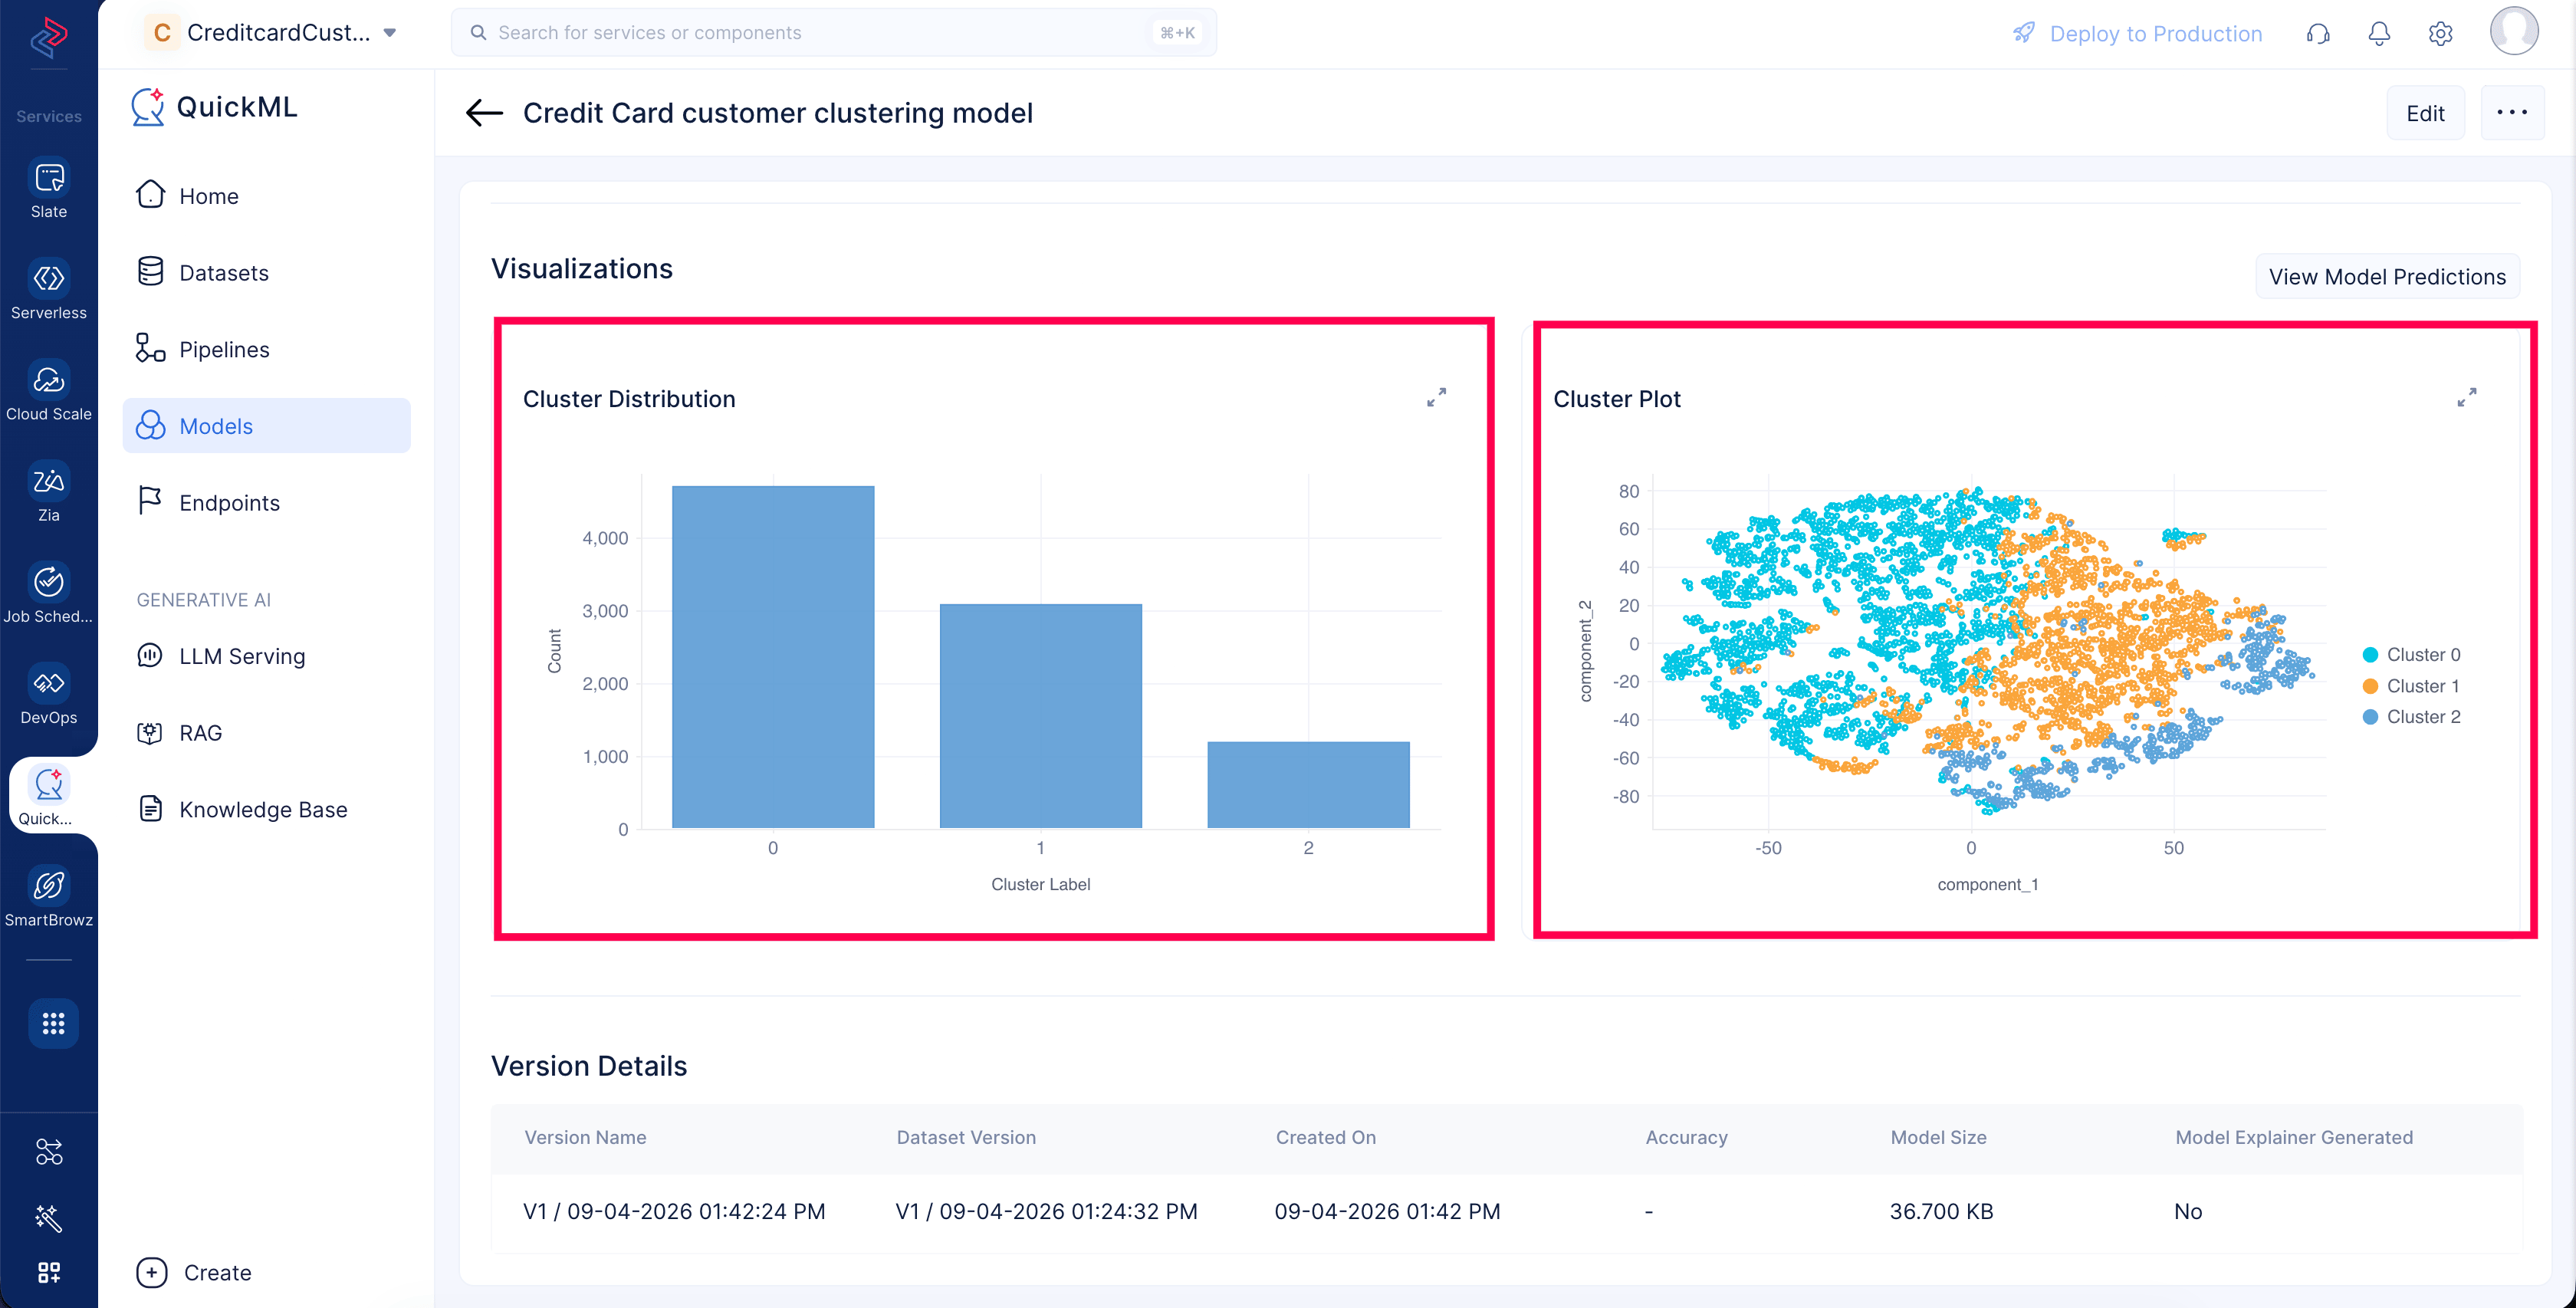
To evaluate the dispersion of records into clusters, QuickML can generate a couple of visualizations to assist in analysis .
-
Cluster distribution_ shows how many data points fall into each cluster .
-
Cluster plot highlights how clusters are separated in a lower-dimensional space.
Learn more about the cluster visualizations in our documentation .
View model predictions
On top of the model evaluation metrics and model visualizations, QuickML also provides a model predictions dataset. The original training dataset is equipped with a column called Cluster . This column contains the cluster information of each customer , which you can find using cust_id. It specifies a customer can belong to only one of the clusters .
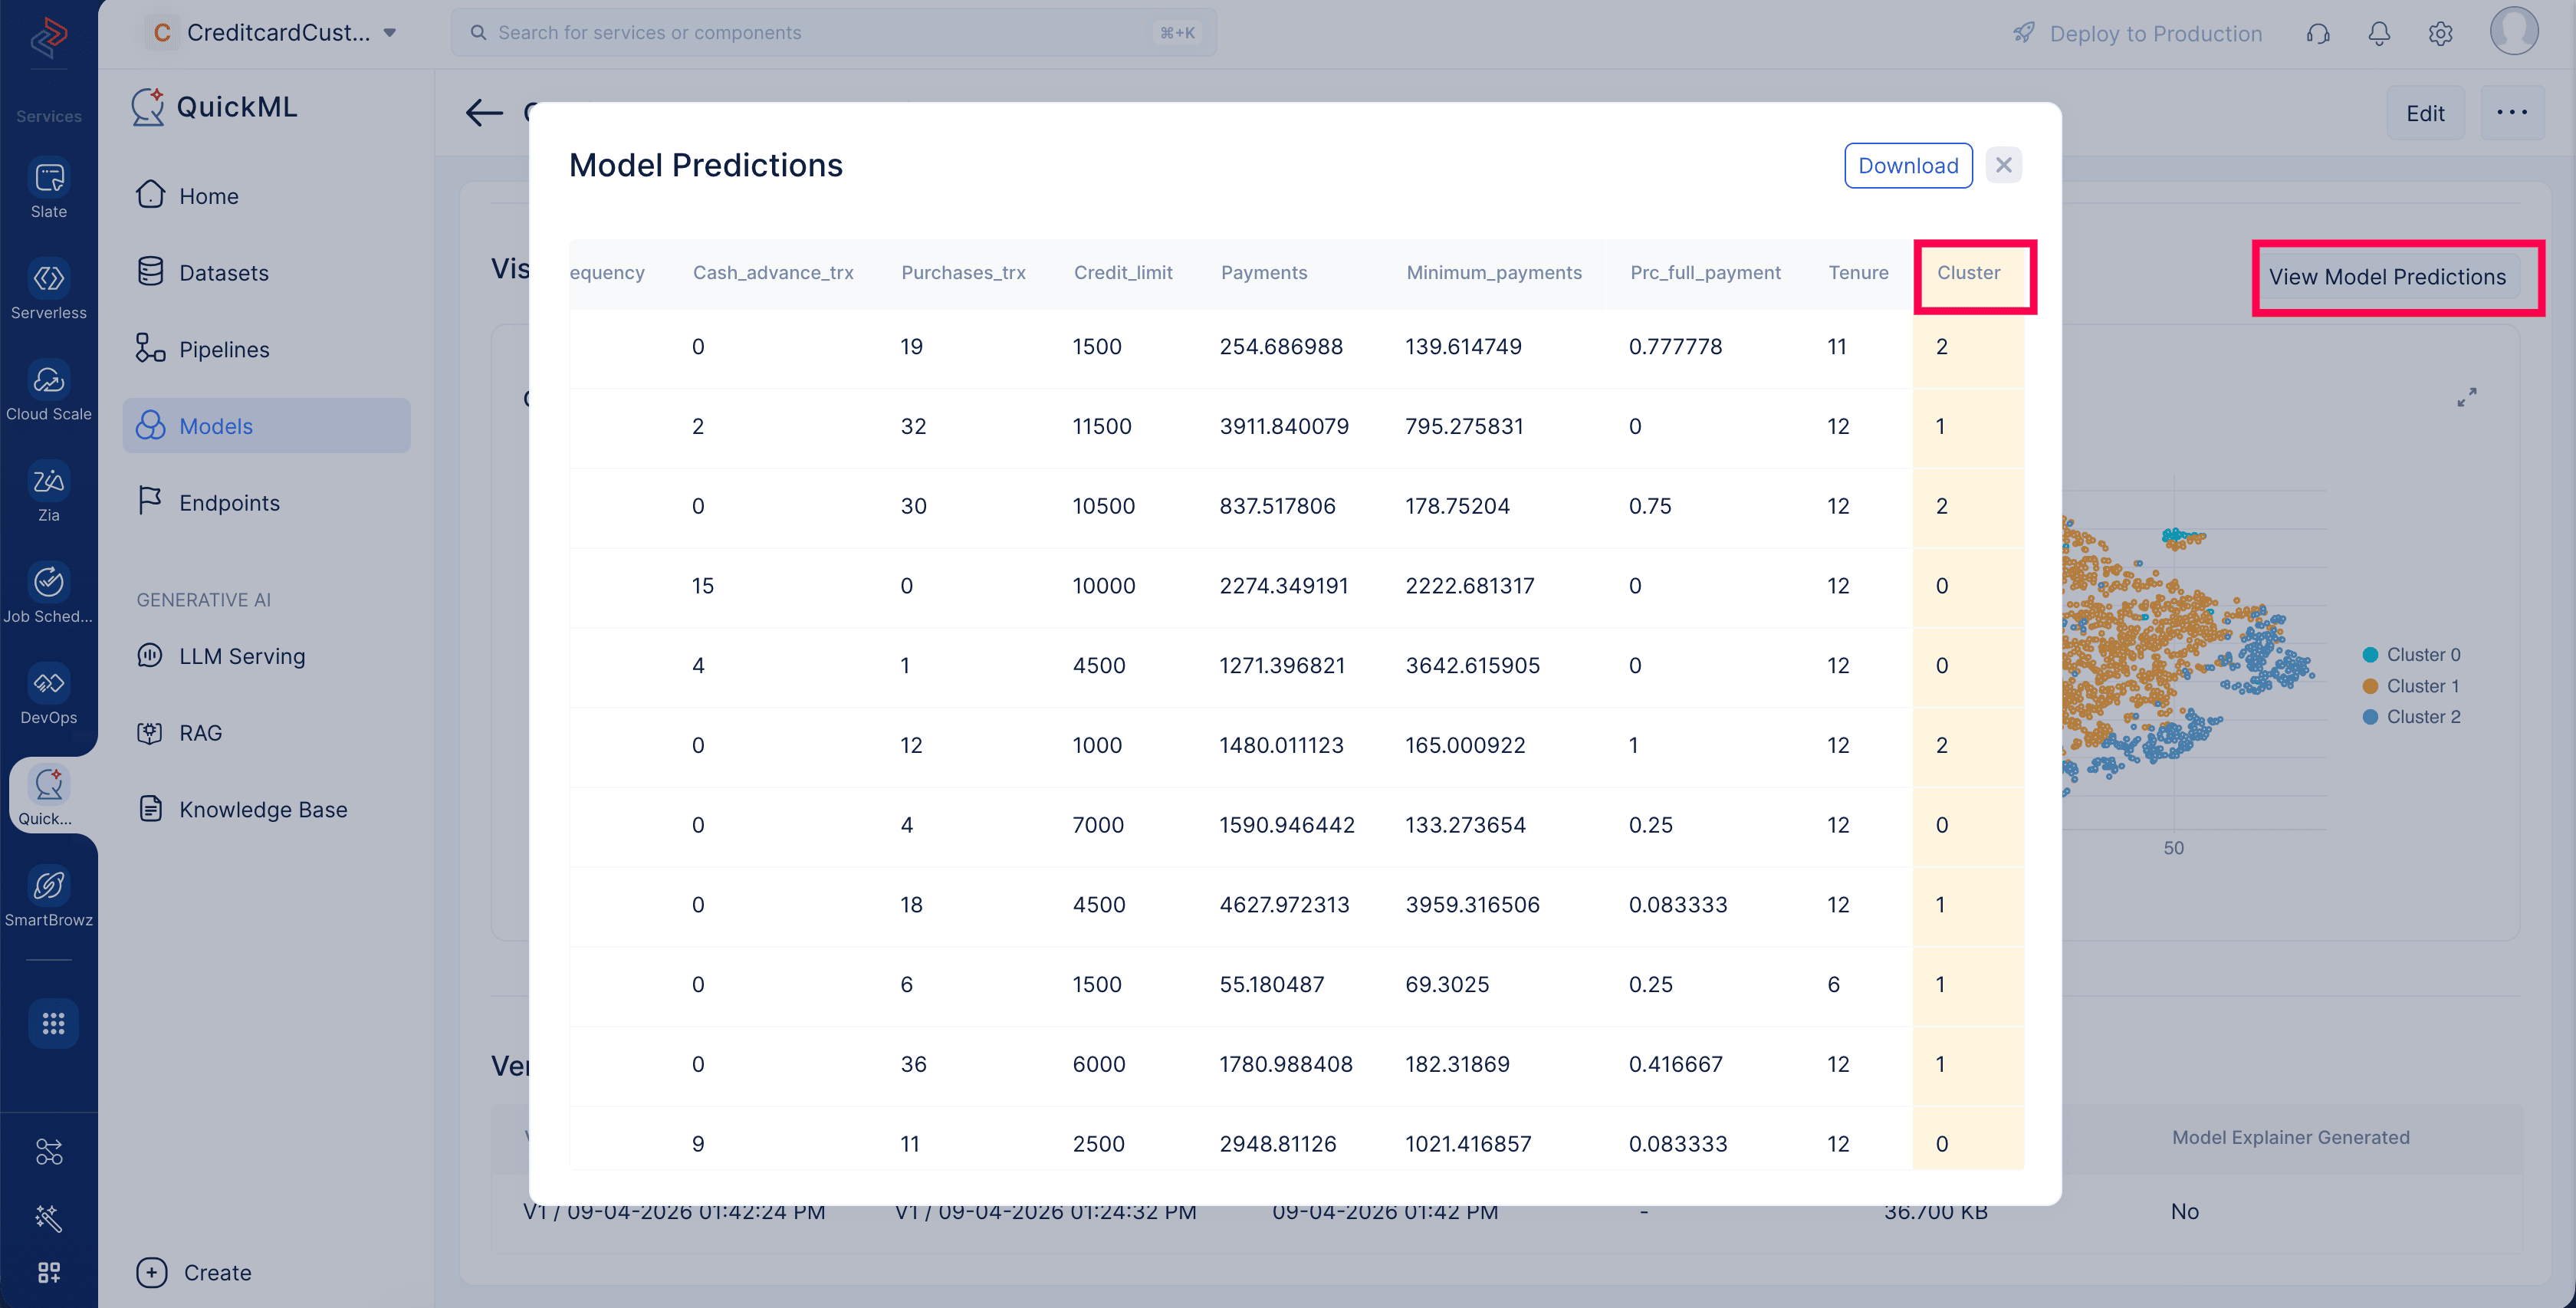
The model predictions dataset generated by the model can be downloaded locally and used for further analysis of each customer segment .
Last Updated 2026-08-20 12:42:54 +0530 IST