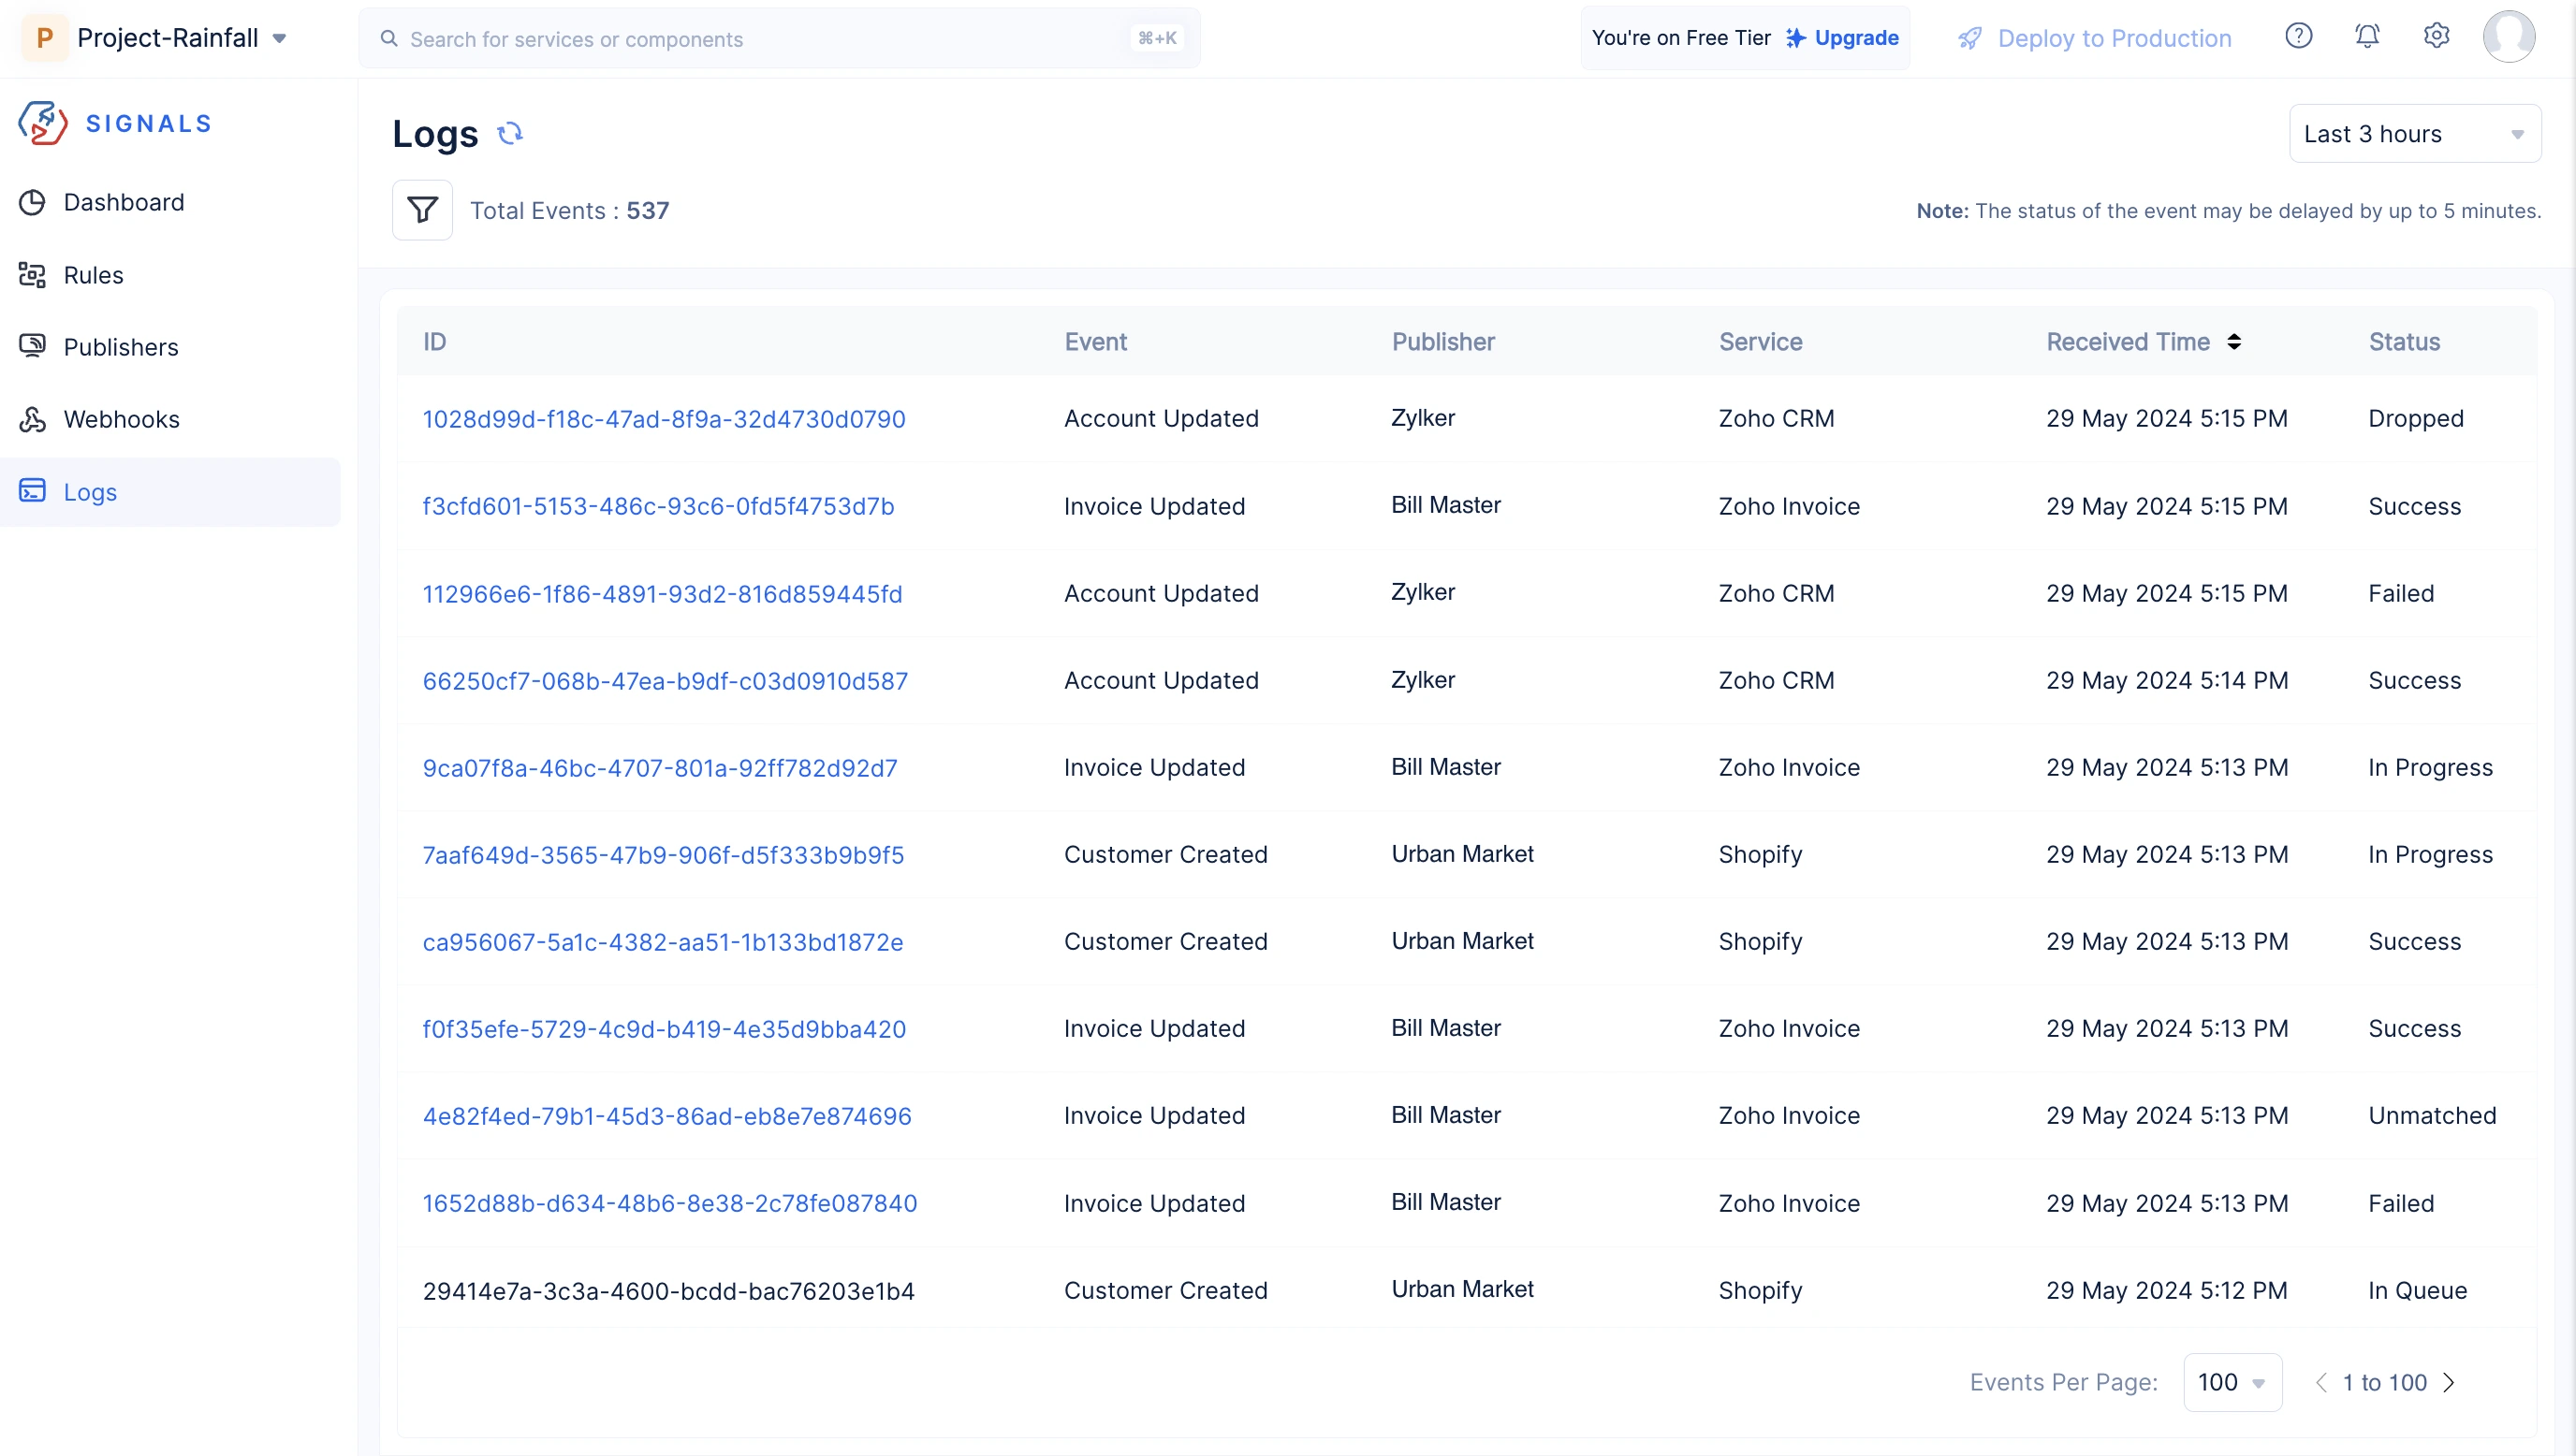
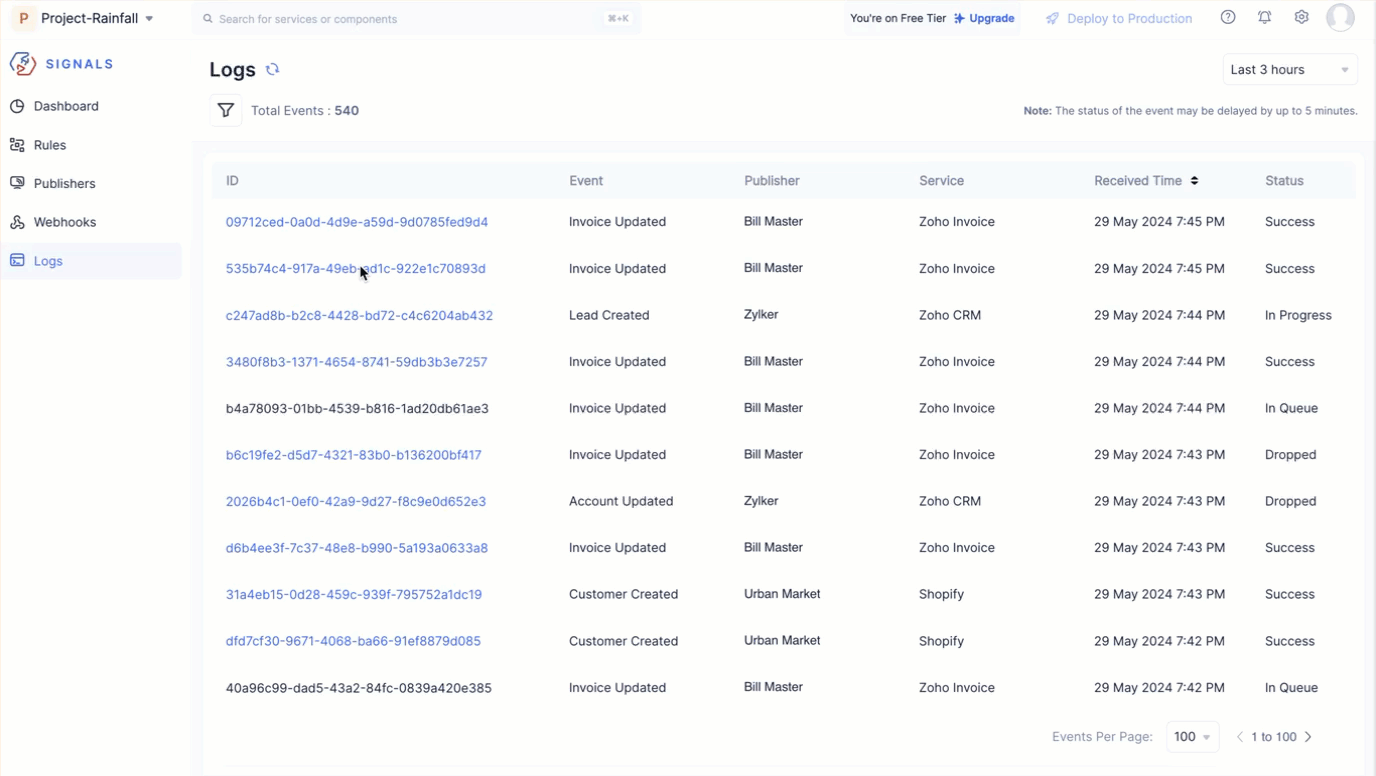
Logs
Event logs provide a comprehensive record of all the events processed within the Signals. Each time a subscribed event occurs in the publisher system, a unique ID is generated and logged here with the time stamp, status, and other relevant details. It acts as a valuable source of insight which the managements can use to monitor, analyze, and effectively troubleshoot their event rules.
Key Aspects
Log Details
Event logs capture details about each event processed within the system, including event source, timestamp, status, dispatch type, and the number of attempts taken to reach the target in the details view page. Refer to the Event Statuses help page to learn more about each status. This data enables organizations to gain visibility into event flows and track the lifecycle of individual events.
Comprehensive Event Capture
Signals offers a Log Details View of an event that has been deployed in multiple rules and targets to achieve certain business requirements. Within the log page, you can track a particular event’s performance across different rules and targets to help you analyze its flow and performance metrics. Following are the list of event execution statuses used for it,
- In Queue - The event has been processed according to the rule configurations and is now queued for delivery to the target.
- In Progress - Events that are currently being delivered to the target.
- Success - The event has been successfully delivered to the target specified in the rule.
- Failed - The event was either not delivered to the specified target in the rule or the target failed to respond to the received event.
- Dropped - The event is linked to a target or rule that has been deleted or disabled.
- Batching - The event is part of a batch that will be delivered to the target according to the selected dispatch policy.
- Scheduled - The event has been received by Signals and is set to be delivered to the target at a scheduled time.
- Retry Scheduled - When an event failed to reach the target, this denotes that a retry has been scheduled based on the configured retry policy.
Each event is assigned an overall Event Status, which summarizes its delivery outcome across all associated targets. This status is influenced by the Event Execution Statuses.
- The overall Event Status follow this priority order: Failed > Dropped > Success.
- If any execution is marked as Failed or Dropped, the event status will also be marked as Failed or Dropped.
- If both Failed and Dropped execution statuses exist for an event, the overall event status will be marked as Failed, since it takes higher priority.
Log filters
The filter icon on the top-left corner of the logs’ list view page offers a range of filters that can help you locate specific events. The filters are categorized based on targets, status, rules, events and their Unique ID. In ‘Filter By Events’, you can search for events by selecting its service, publisher, and the subscribed events.
Debugging and Troubleshooting
Each event log includes the status of the event processing flow. If an event fails, you can hover over its Failed status in the details view to see the failure message. This helps you quickly analyze errors, identify root causes, and resolve issues efficiently, ensuring system reliability.
If an event is delivered to a Function or a Circuit as a target, a Logs icon appears next to it.
- For Functions, clicking the icon takes you to the Logs page in DevOps, where function logs are recorded.
- For Circuits, it redirects you to the Circuit Execution History page in the Serverless.
If the target function takes too long to respond to an event, you can terminate it using the Kill Function icon next to the Logs icon. Terminating a function moves the event to a Dropped status, and the event data cannot be recovered.
Last Updated 2025-06-10 18:26:01 +0530 IST
Yes
No
Send your feedback to us