Create Data Pipeline
Now that we have uploaded the required datasets, we will proceed with creating a data pipeline.
-
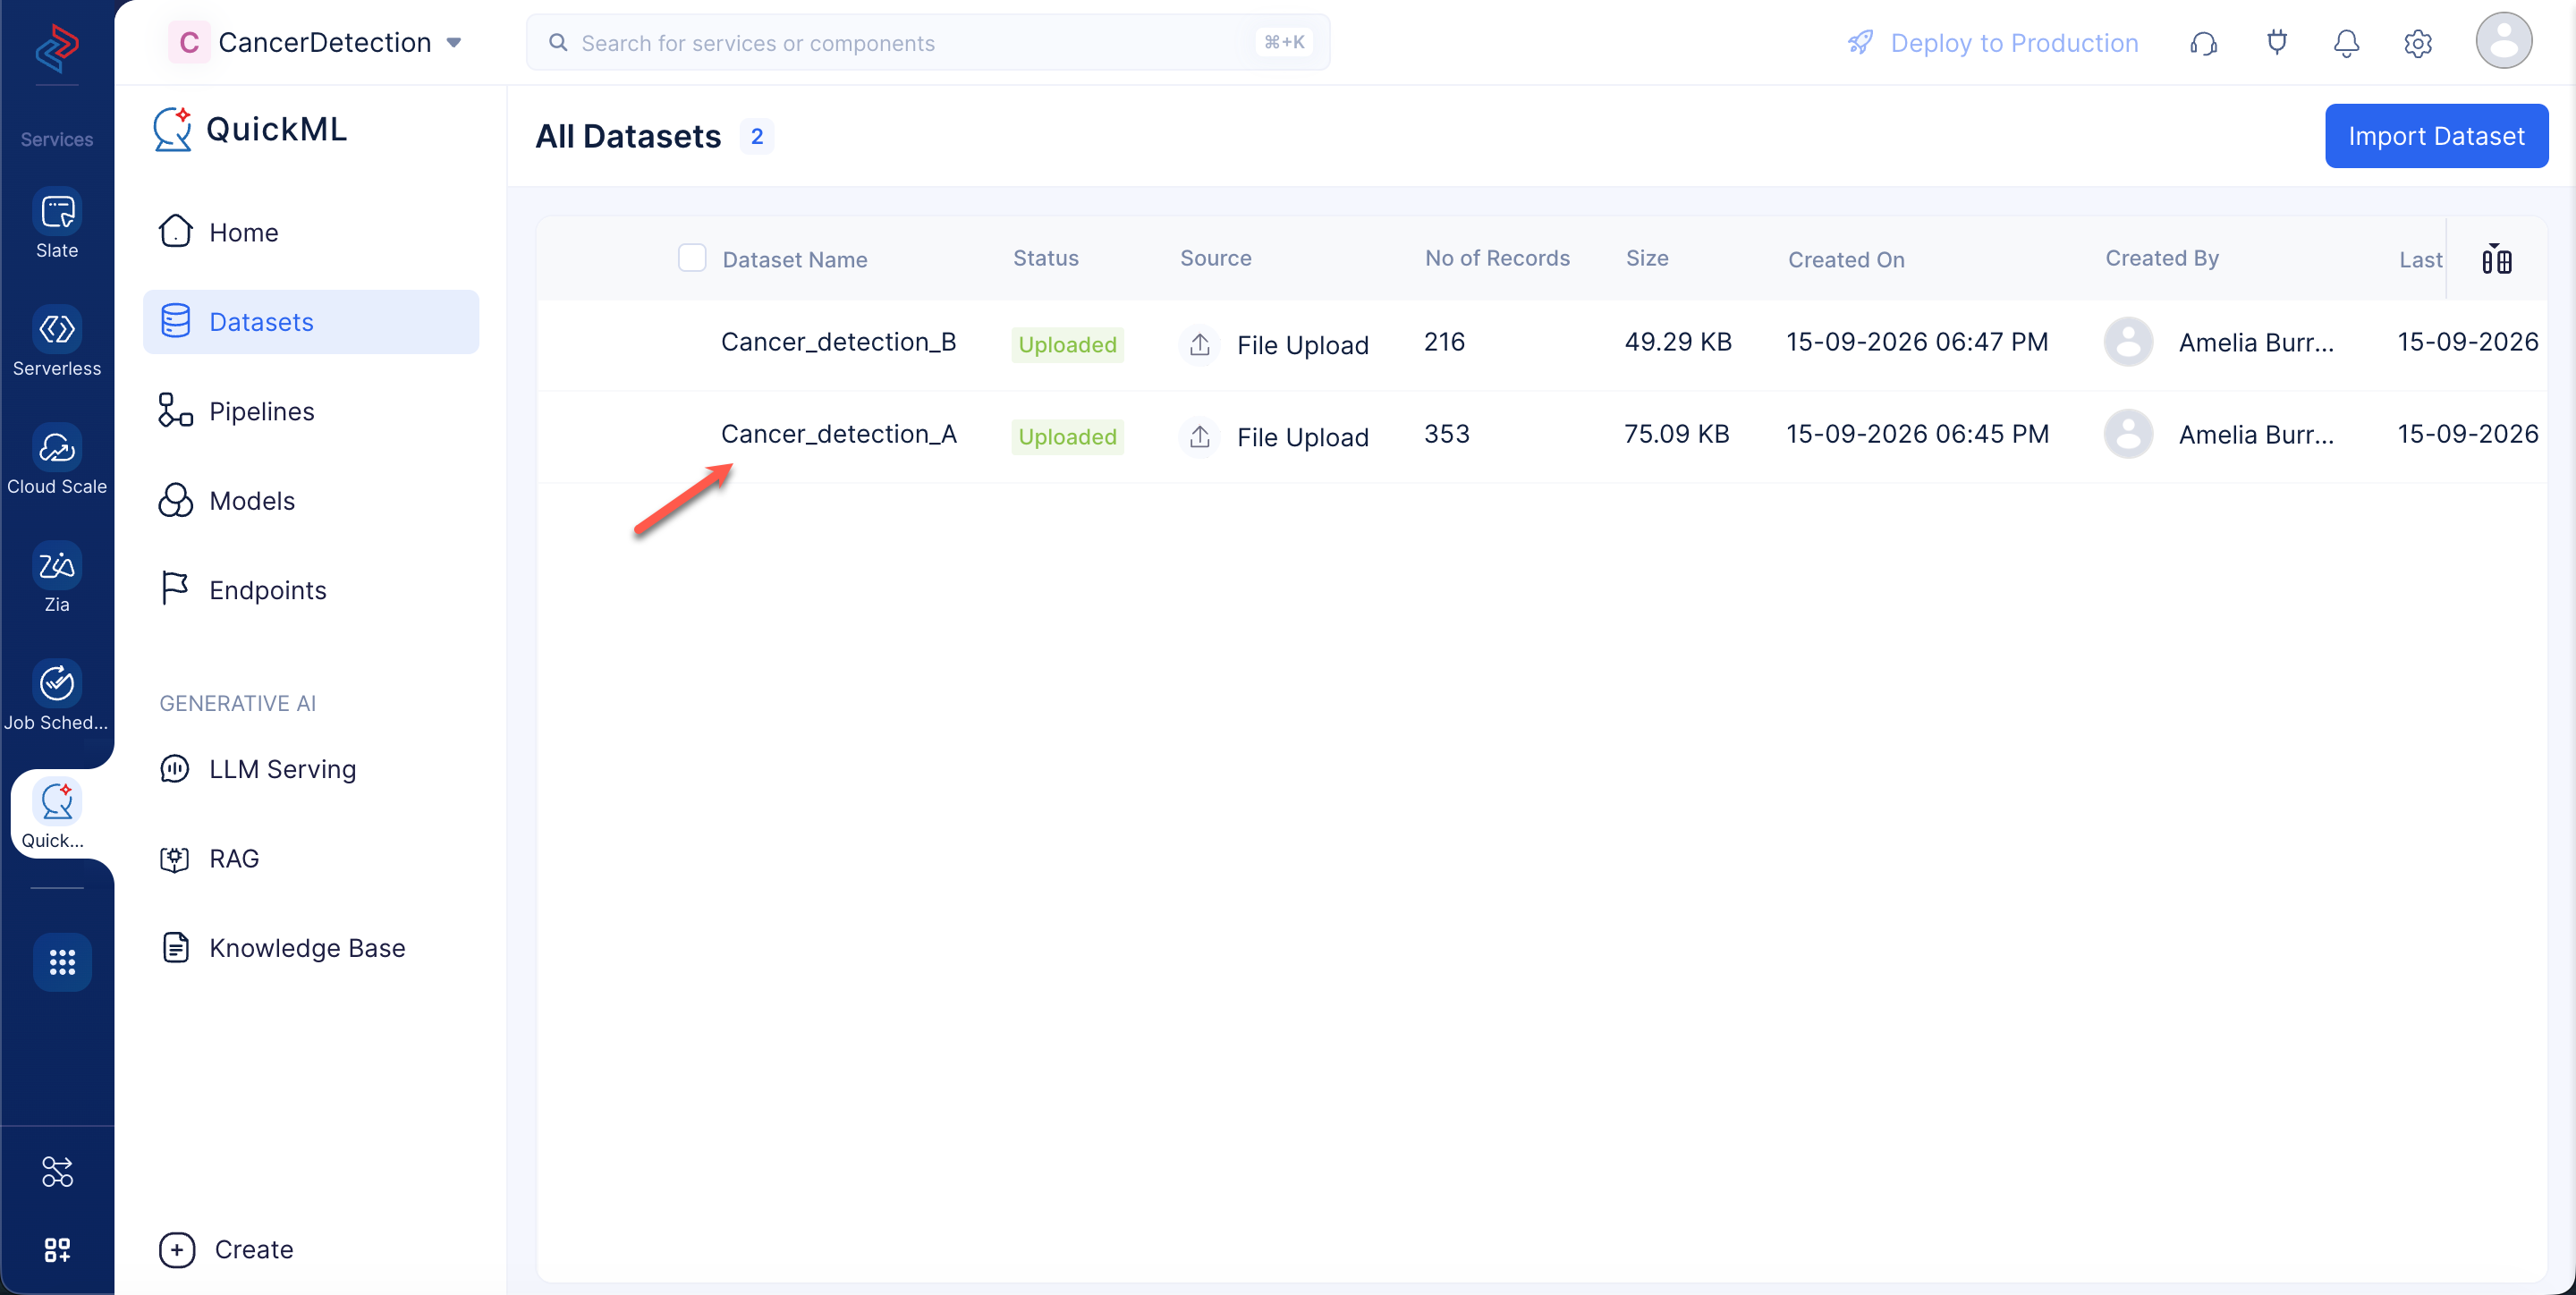
In the left panel, navigate to Datasets, and click the Cancer_detection_A dataset. The data pipeline details page will be displayed.
-
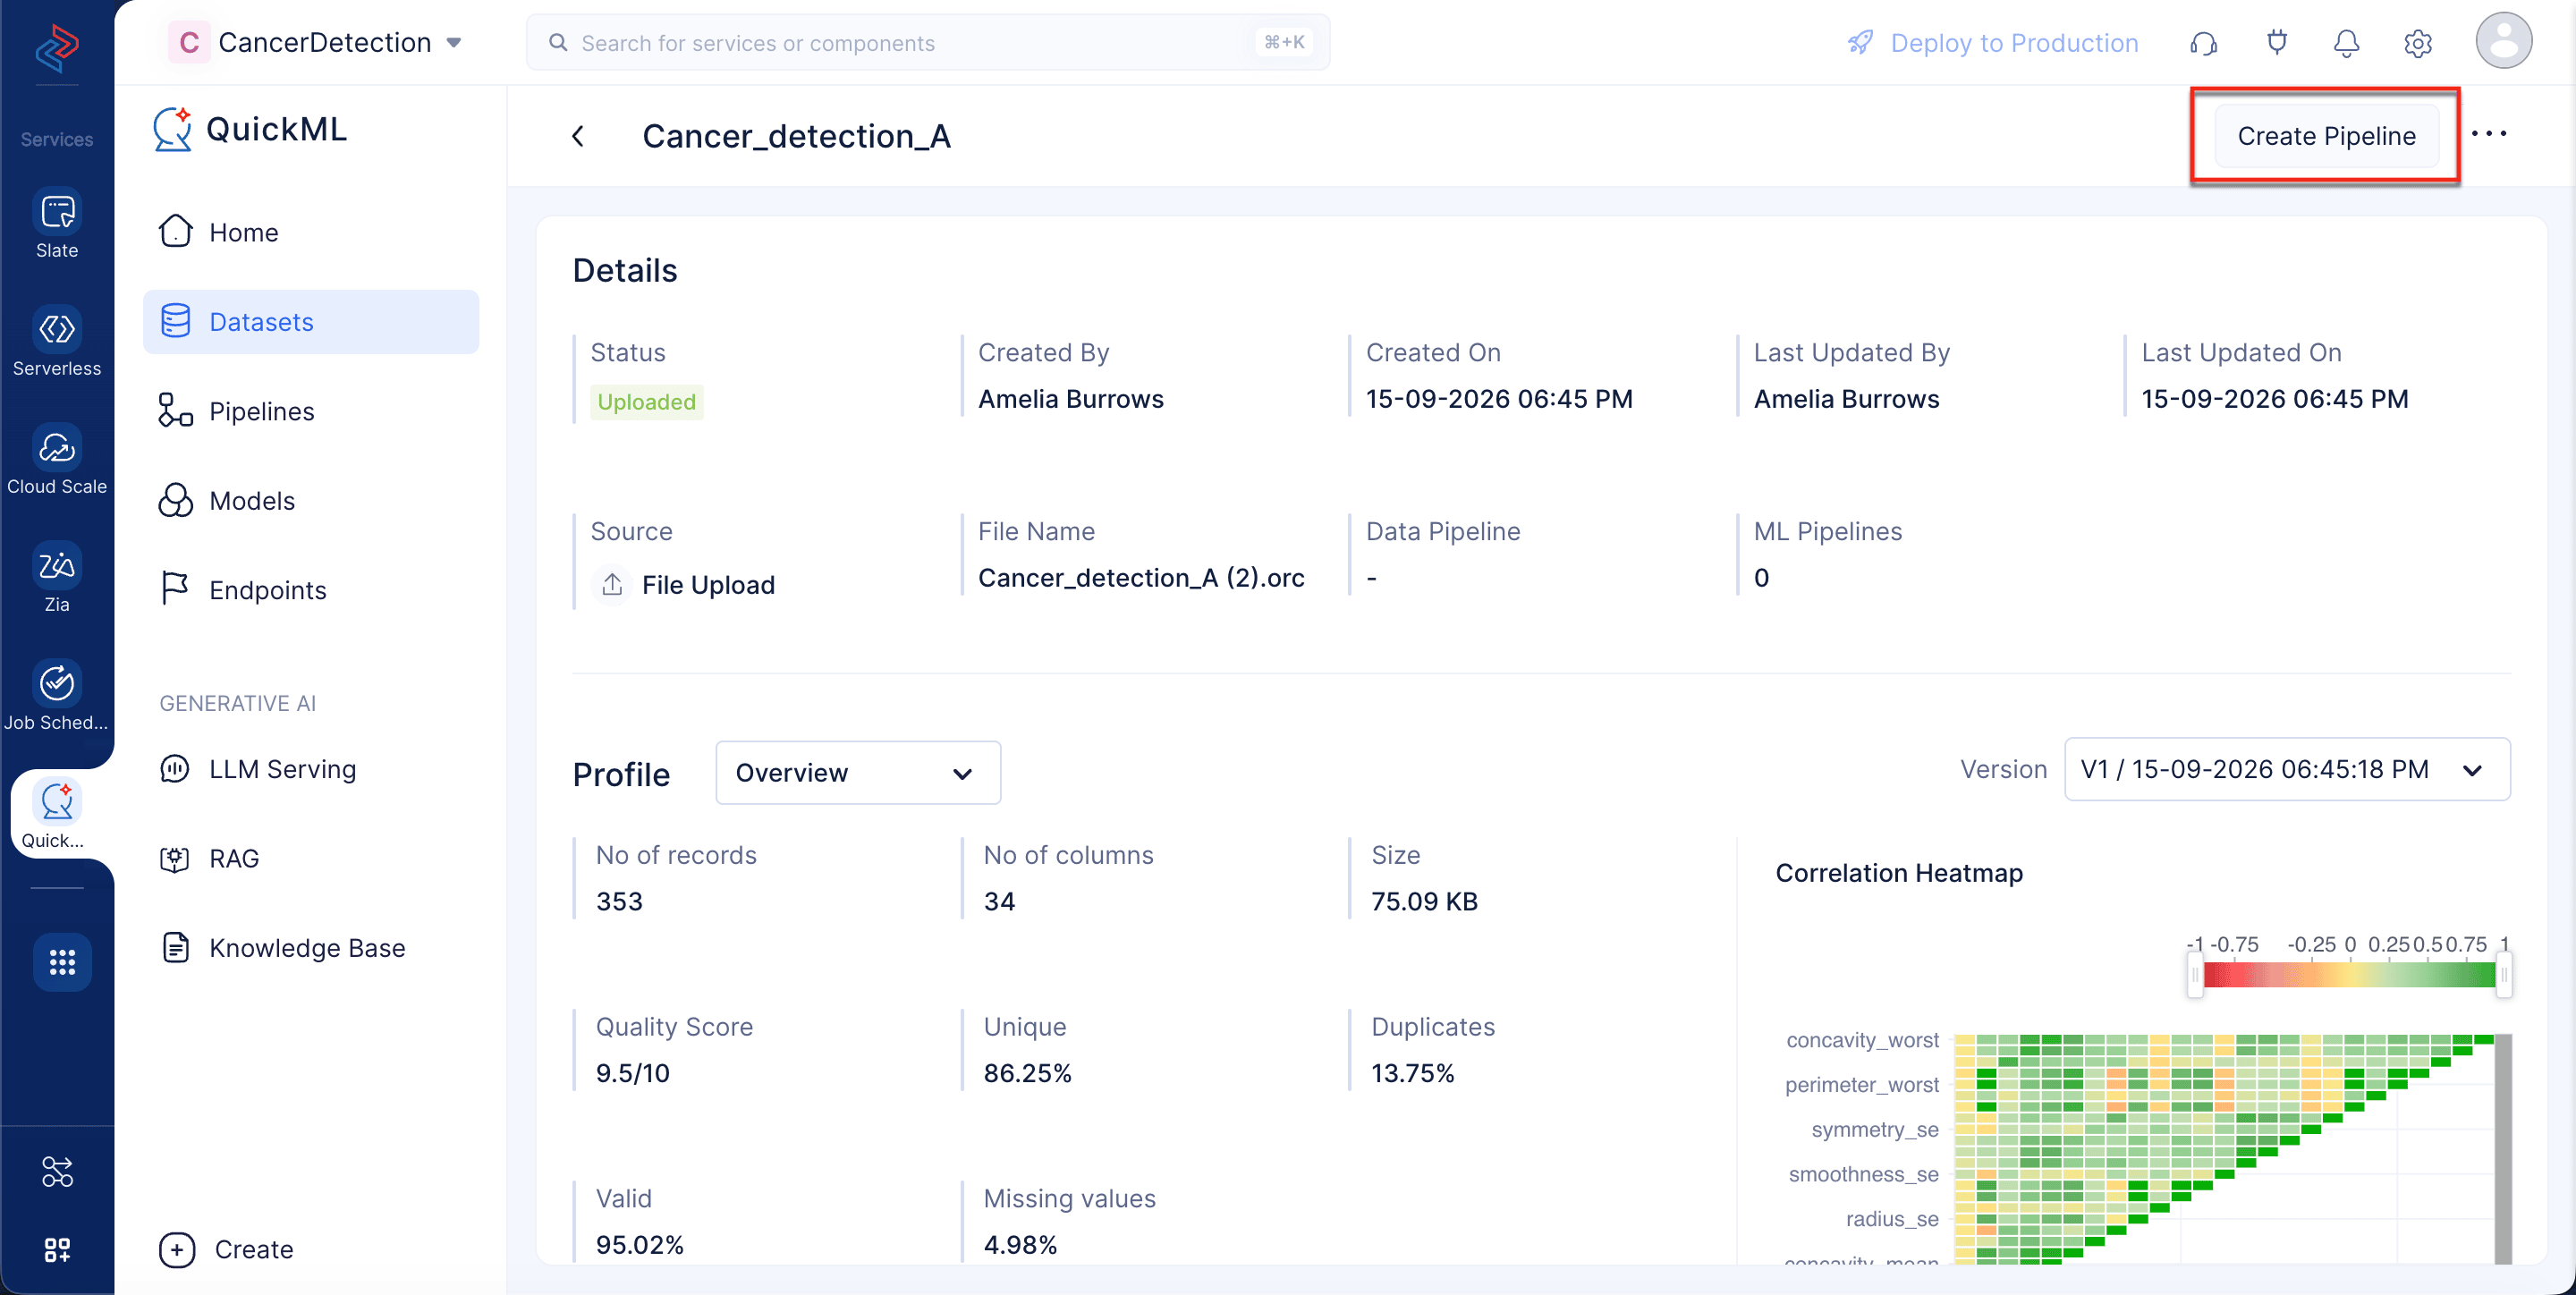
Click Create Pipeline from the top-right corner of the page.
-
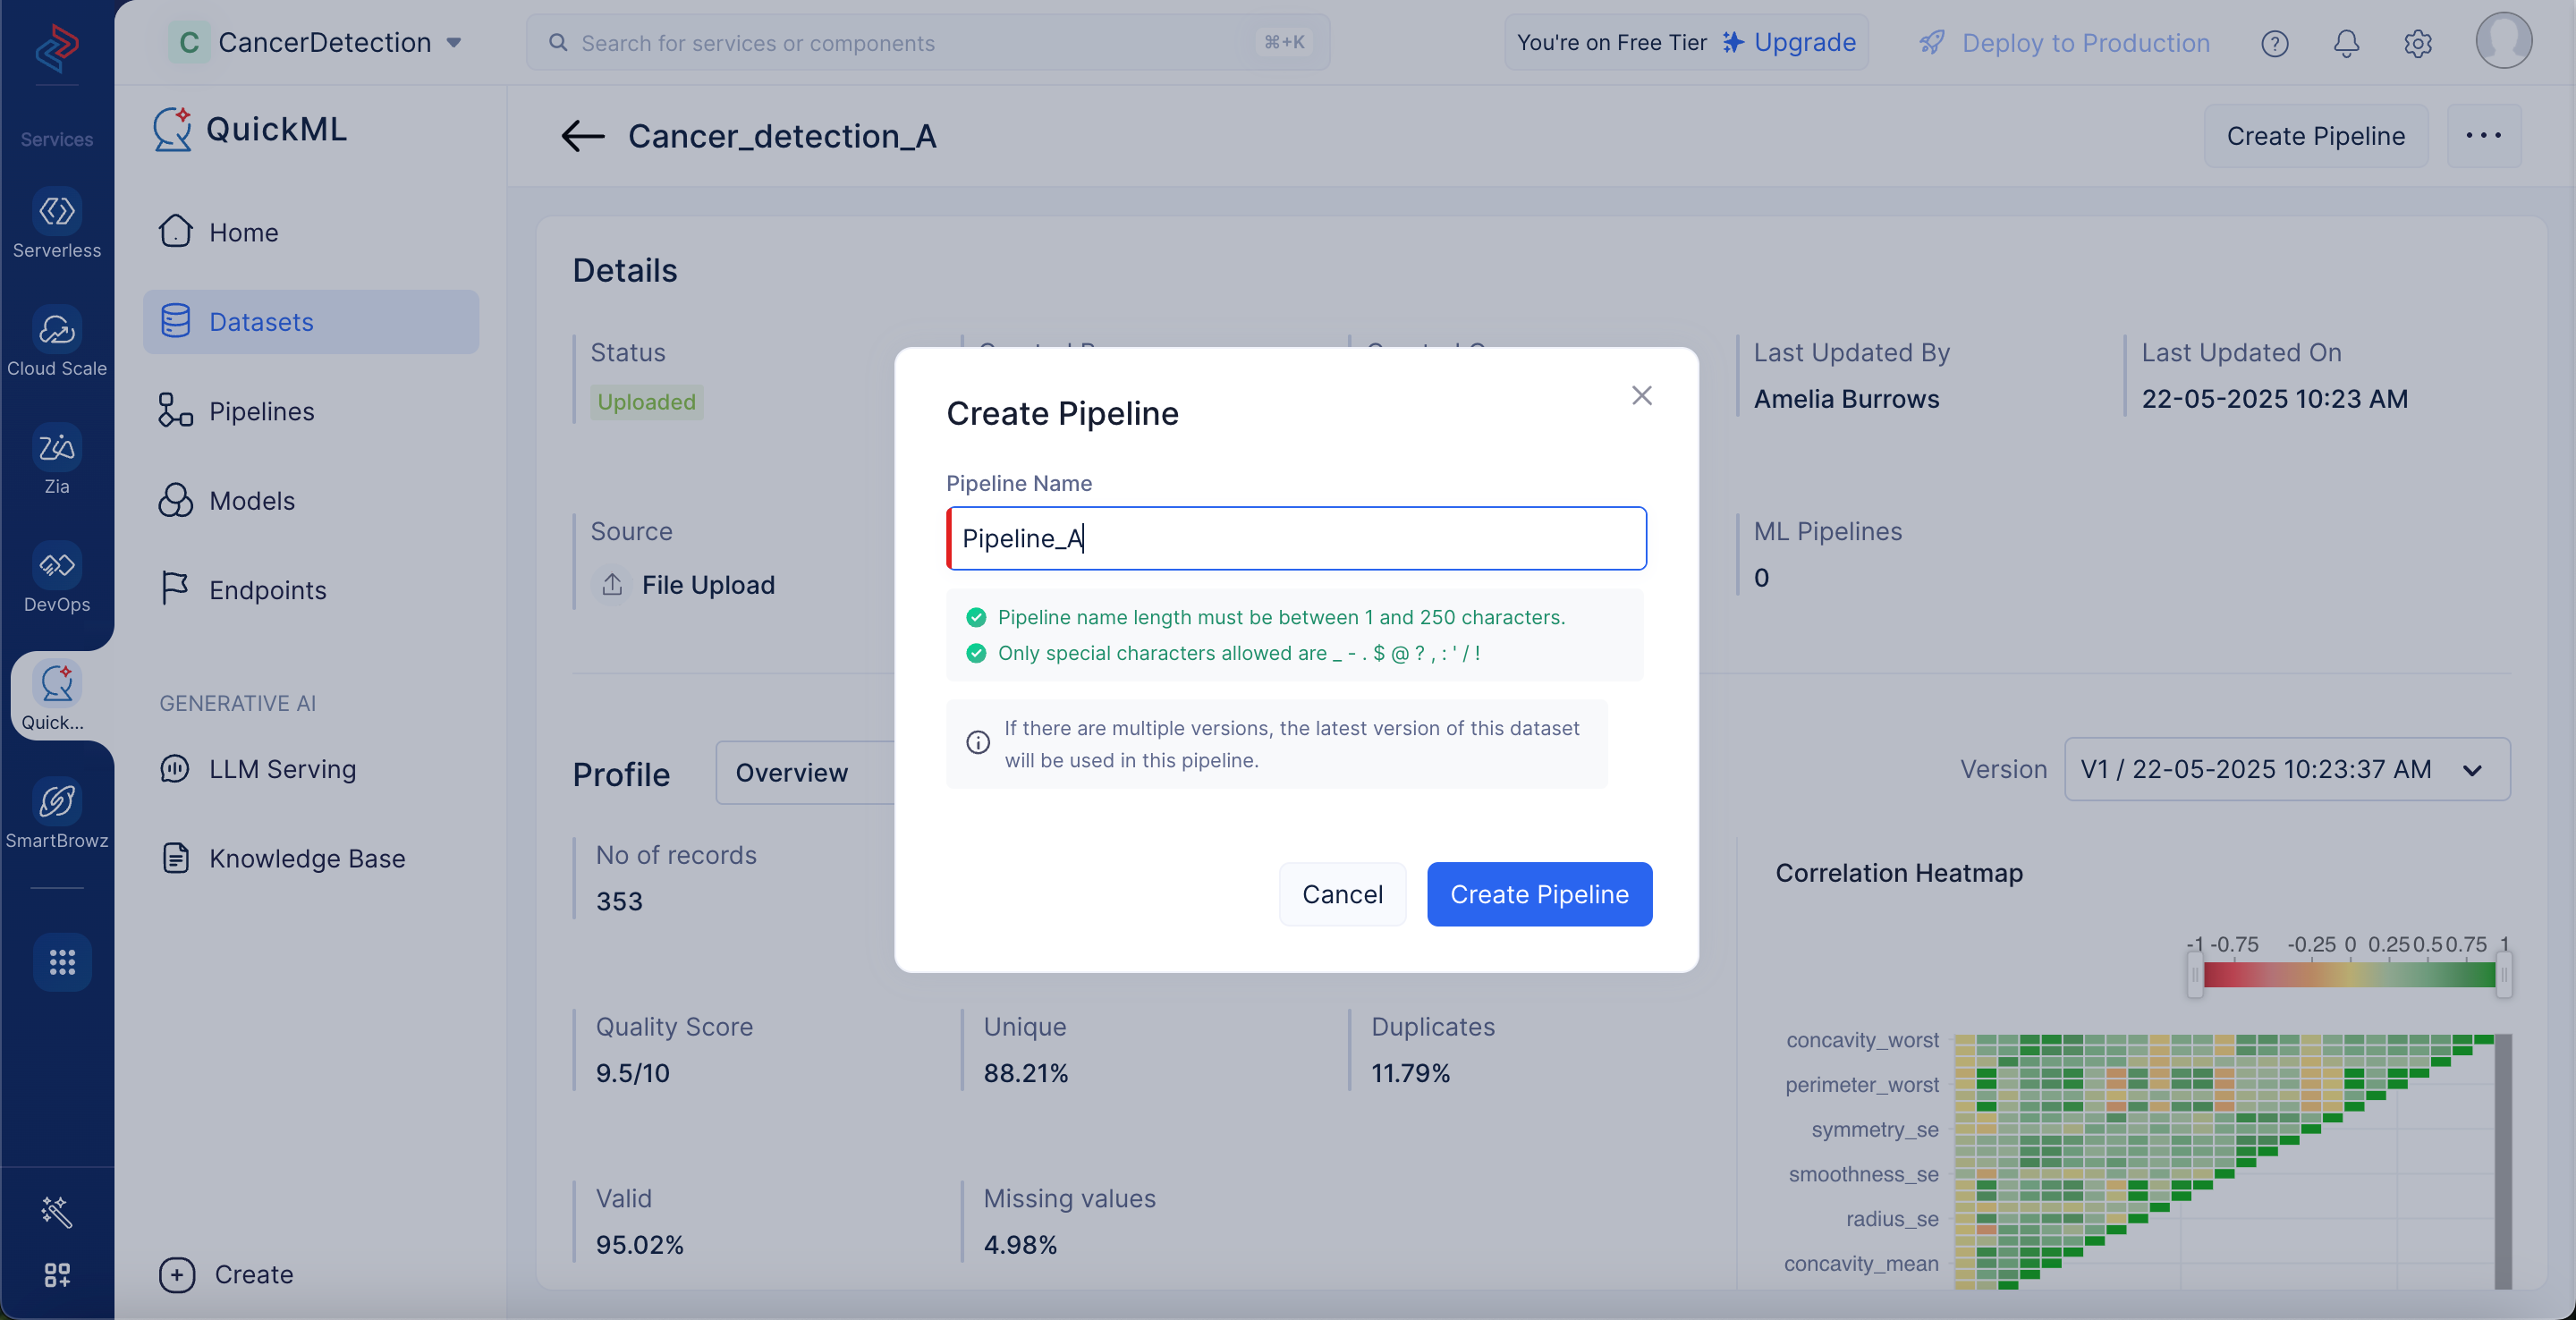
In the Create Pipeline pop-up window, enter the name of the pipeline as “Pipeline_A” , and click Create Pipeline.
The Pipeline Builder interface will be opened, as shown in the screenshot below.
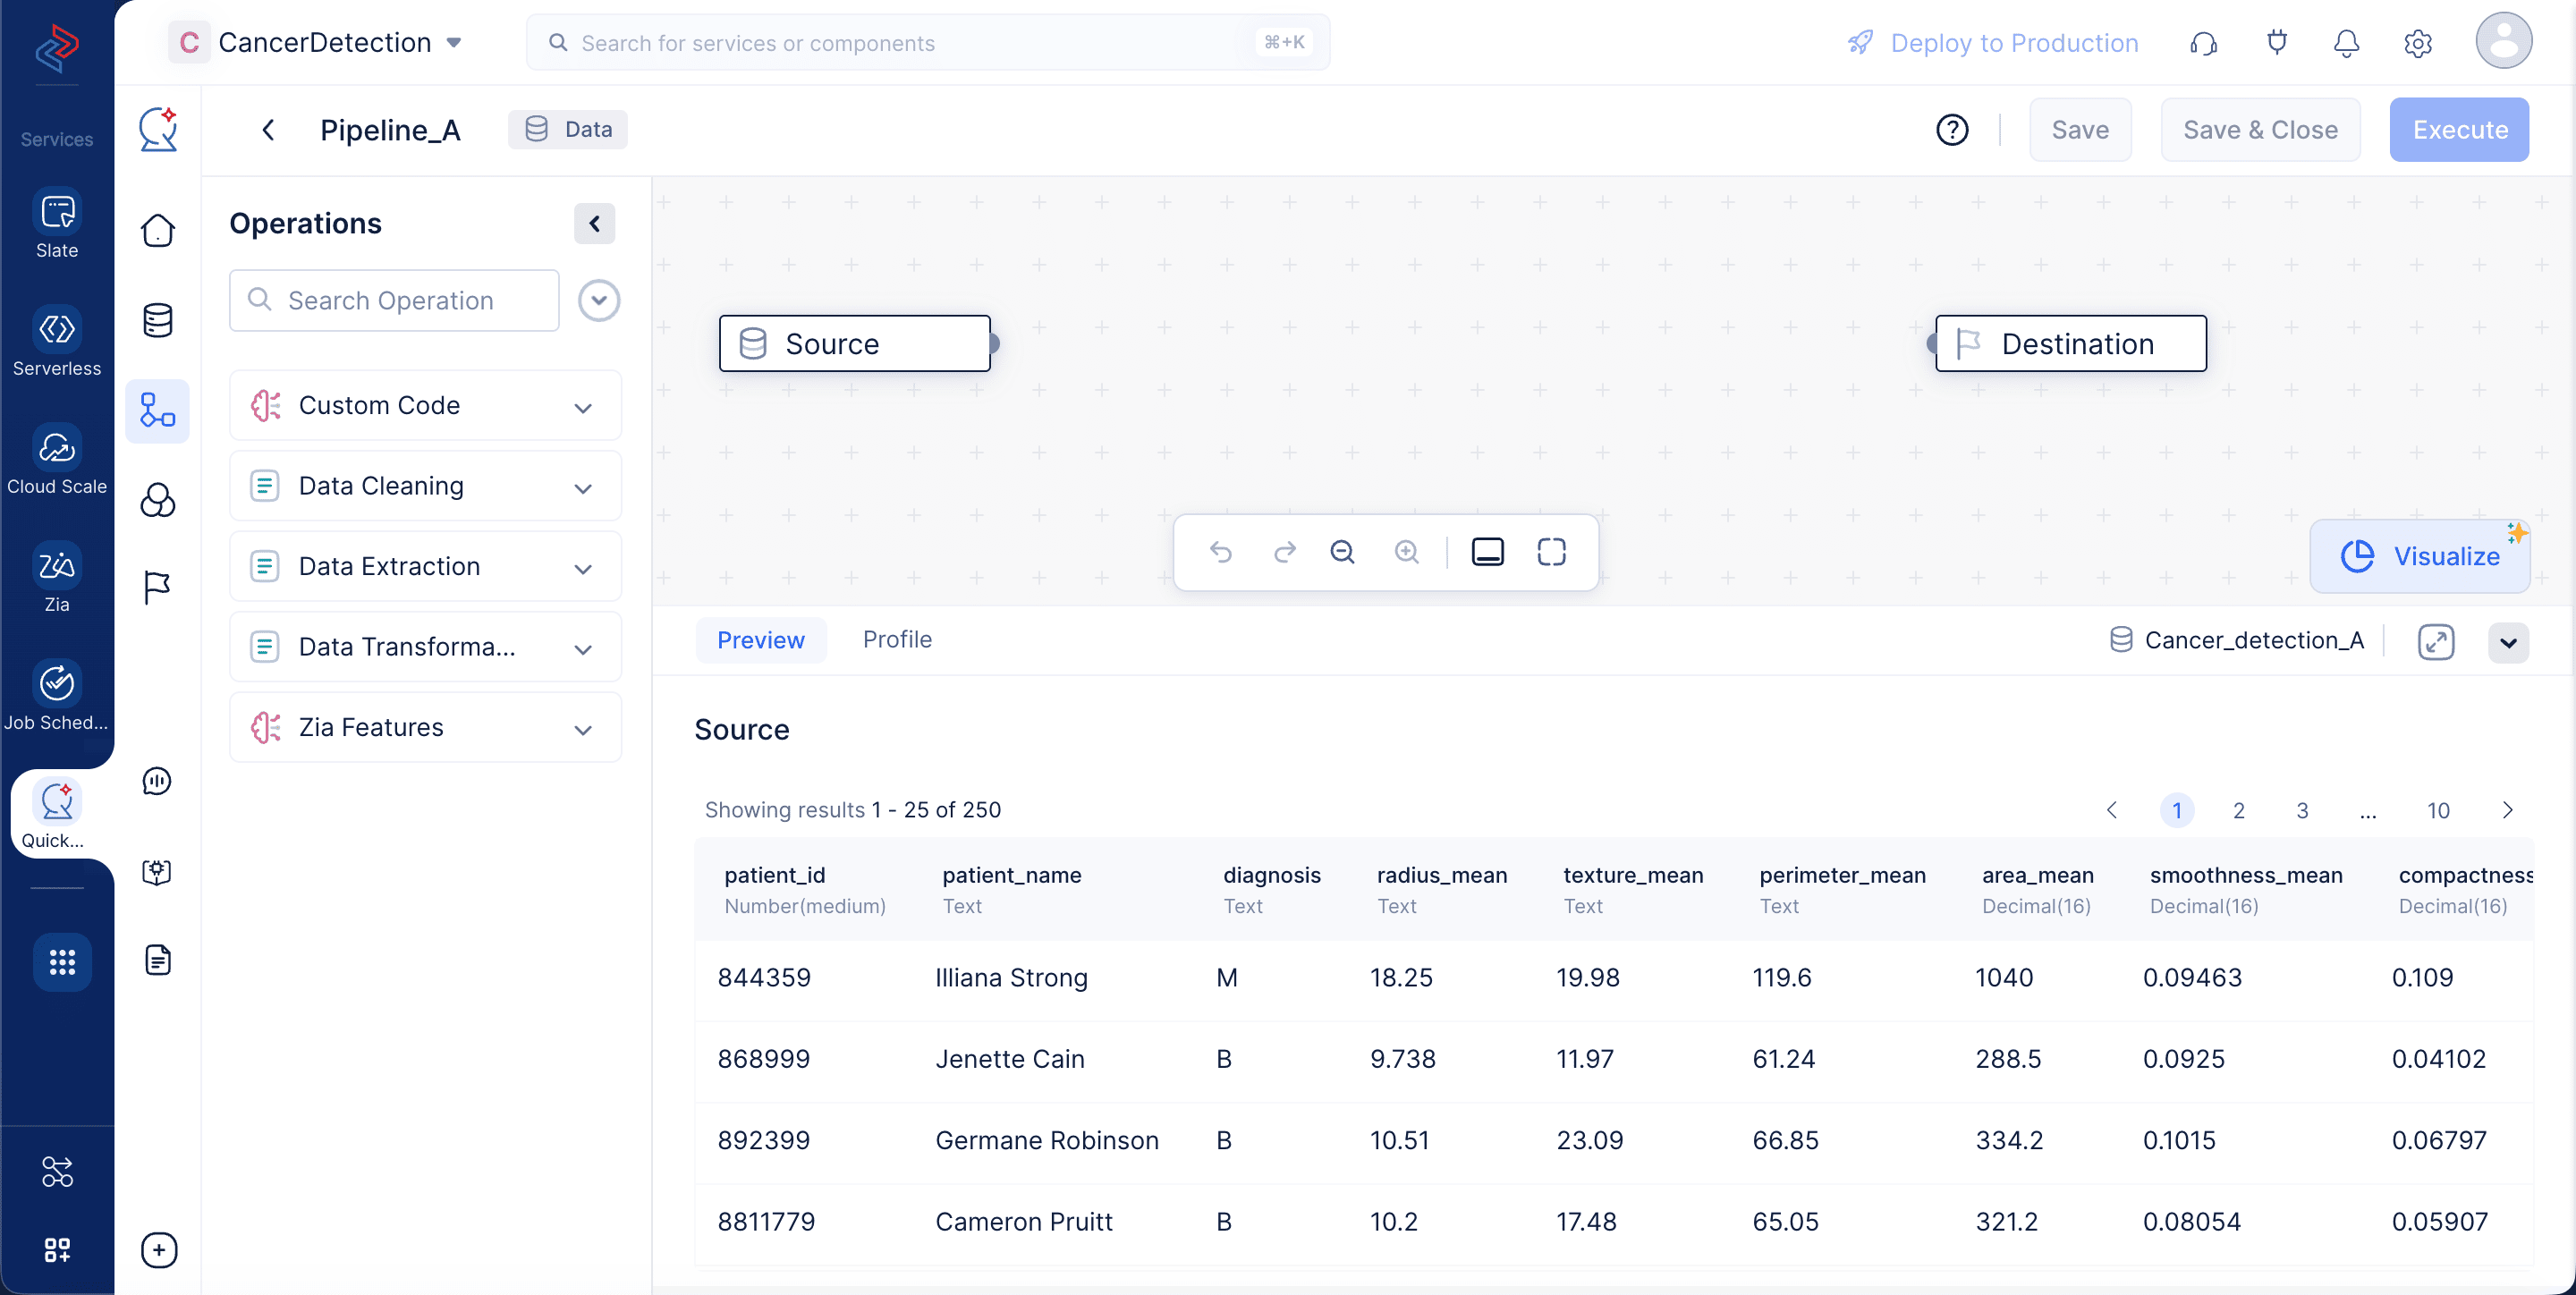
We will be performing the following set of data preprocessing operations in order to clean, refine, and transform the datasets, then execute the data pipeline. Each of these operations involves individual data nodes that are used to construct the pipeline.
Combine Datasets
Because we have two datasets, we need to merge them before starting the training process. Please follow the steps below to merge the datasets:
-
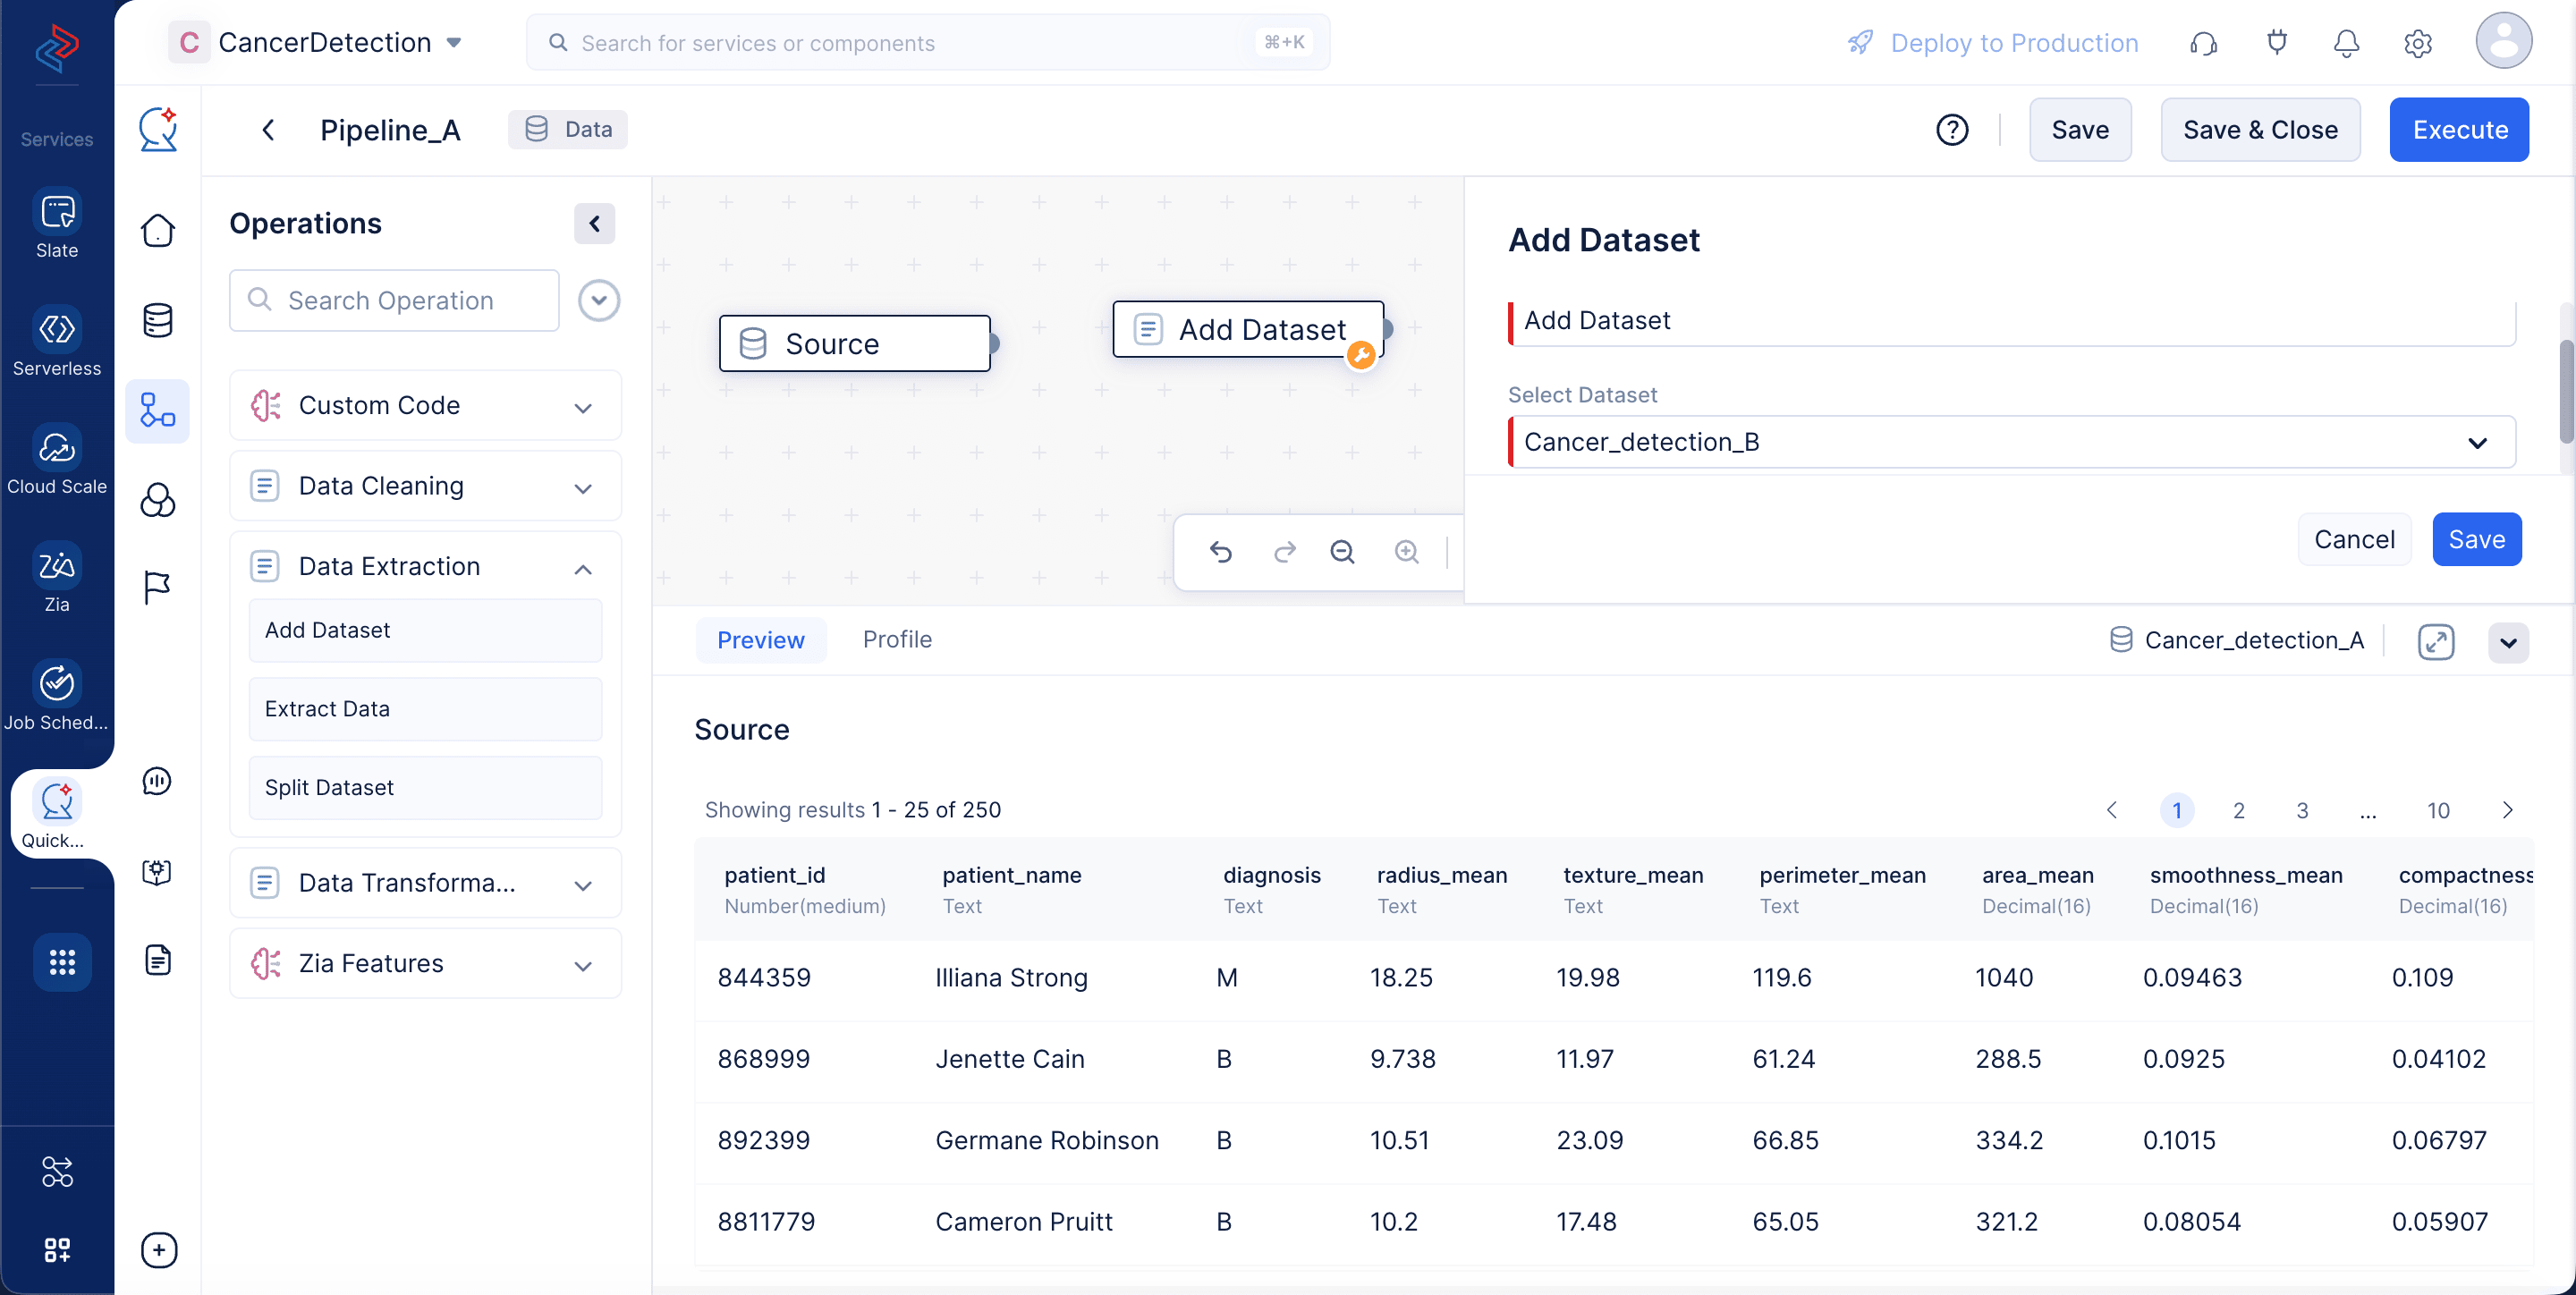
In the Operations menu, expand the Data Extraction component.
-
Drag and drop the Add Dataset node into the Pipeline Builder.
-
Create the custom name for the node in the Custom Name field in the right panel. Here, we have created it as Cancer dataset 2.
In the Add Dataset section on the right panel, choose Cancer_detection_B from Select Dataset field to merge the Cancer_detection_B dataset with the Cancer_detection_A dataset and click Save.
-
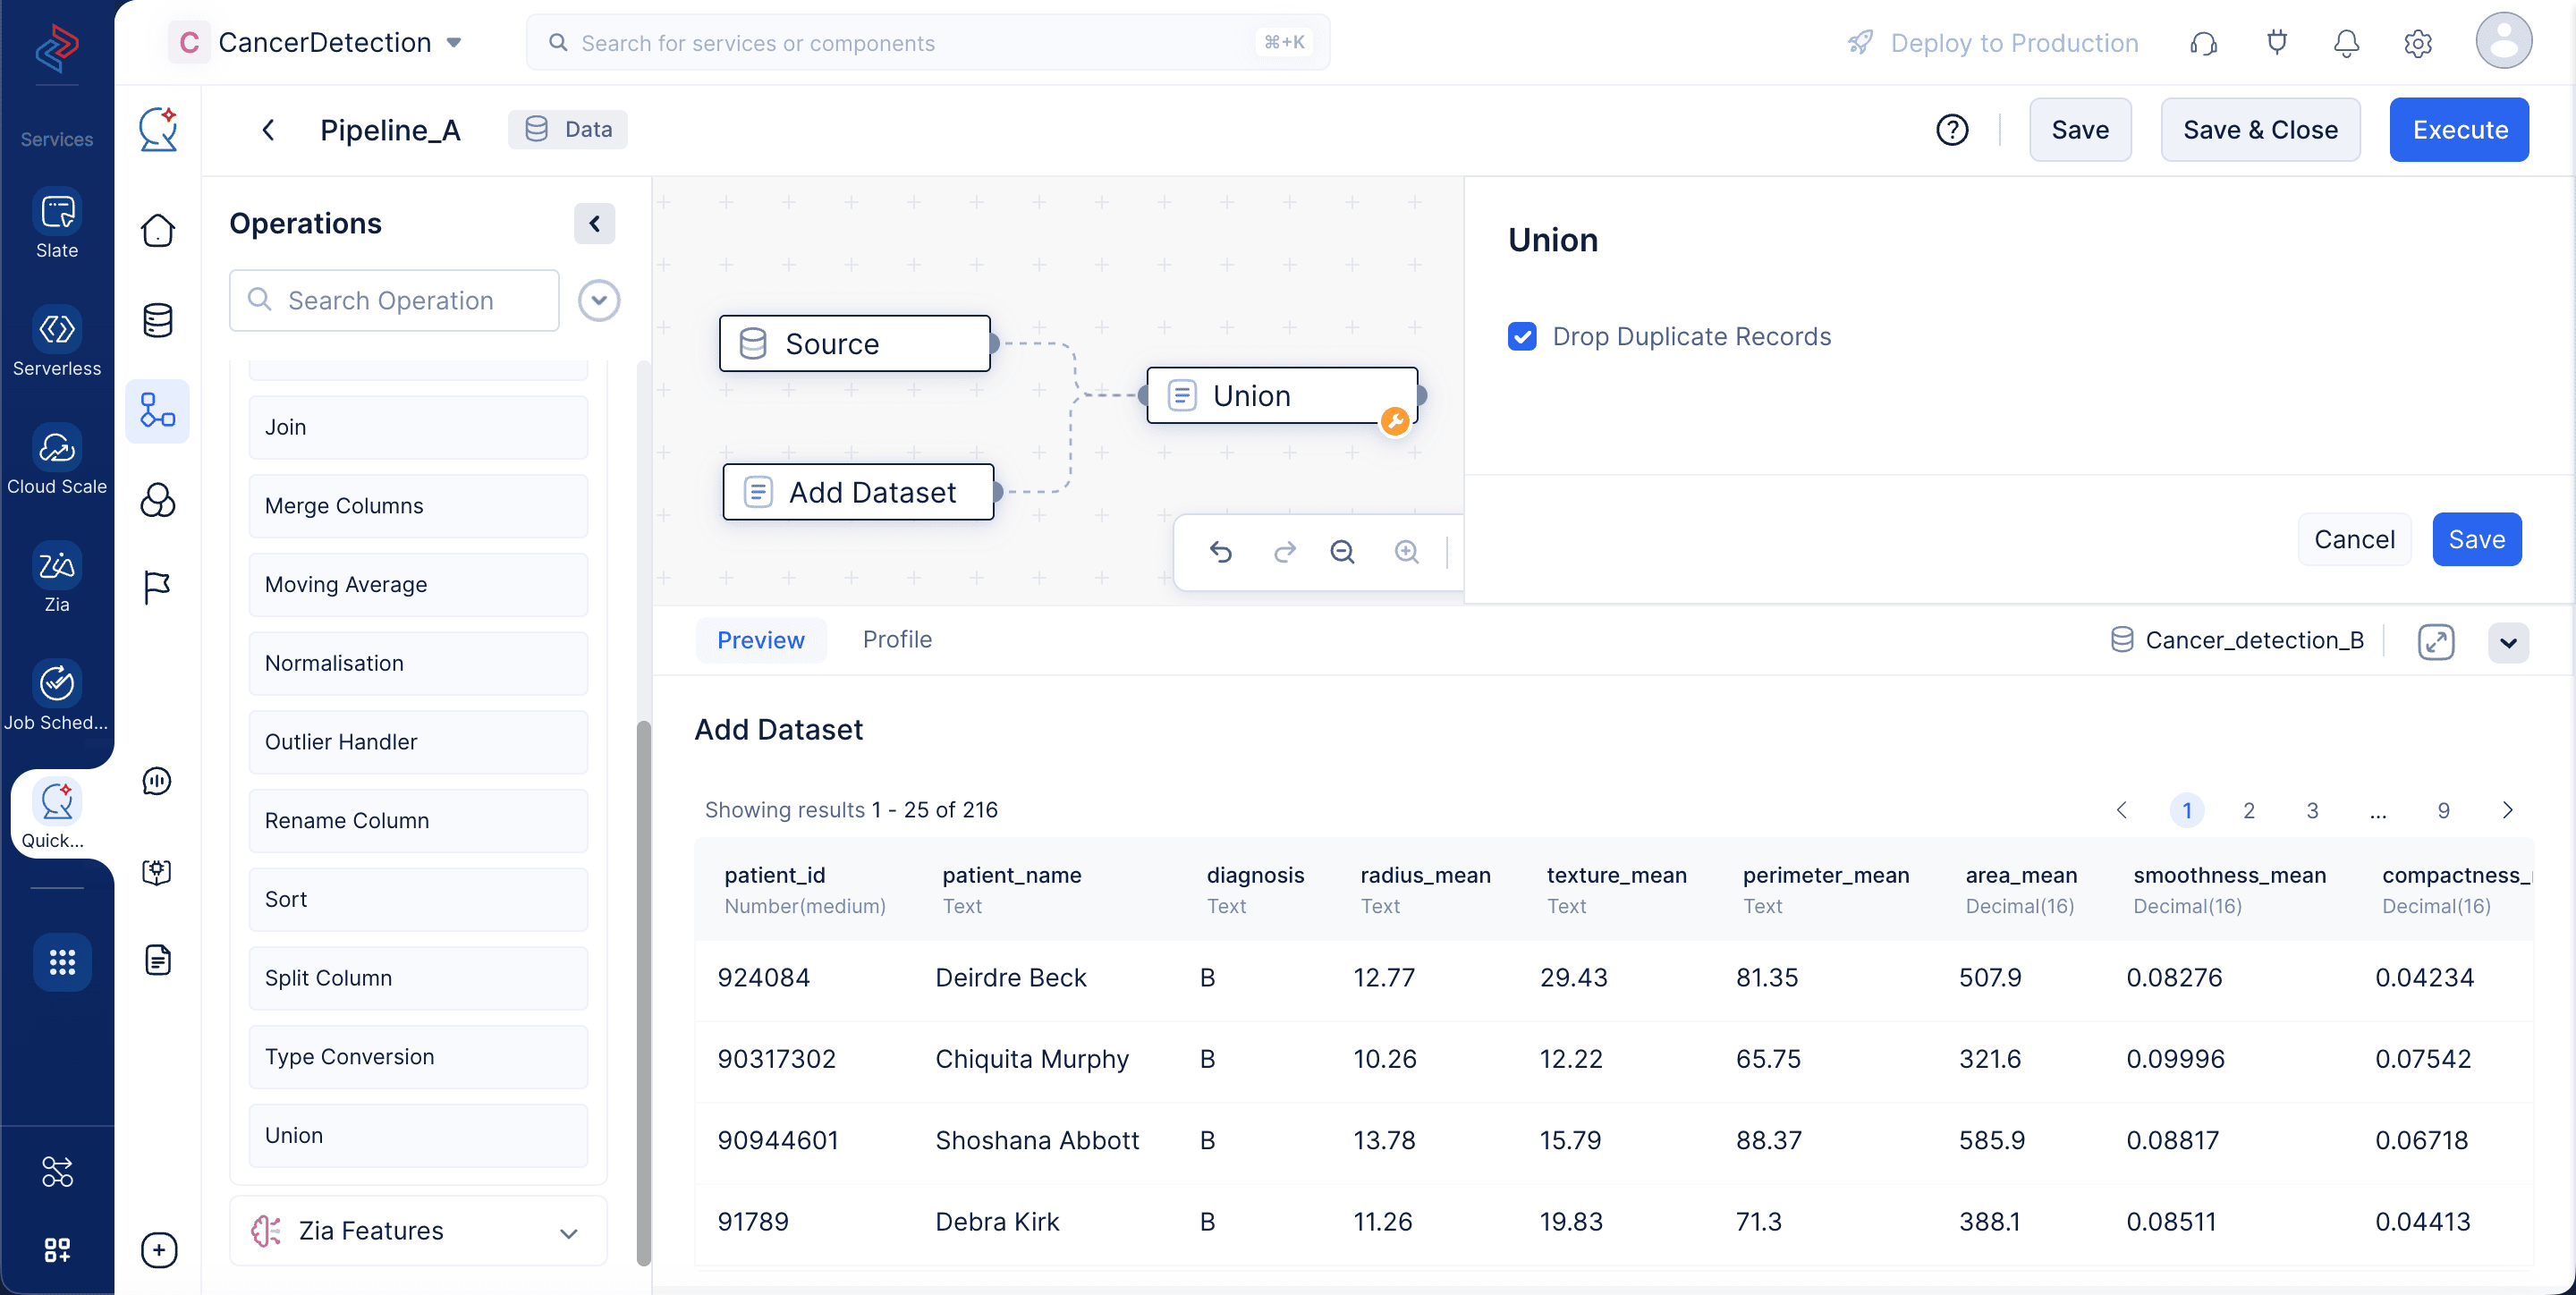
Open the Data Transformation component from the Operations menu, then drag and drop the Union node into the Pipeline Builder.
-
Make a connection between the nodes by joining the Source and Add Dataset node to the Union node.
-
In the Union section on the right panel, choose the Drop Duplicate Records checkbox and click Save.
Select Fields for Model Training
After combining the datasets, we will need to select the required fields in the merged dataset to train them further.
-
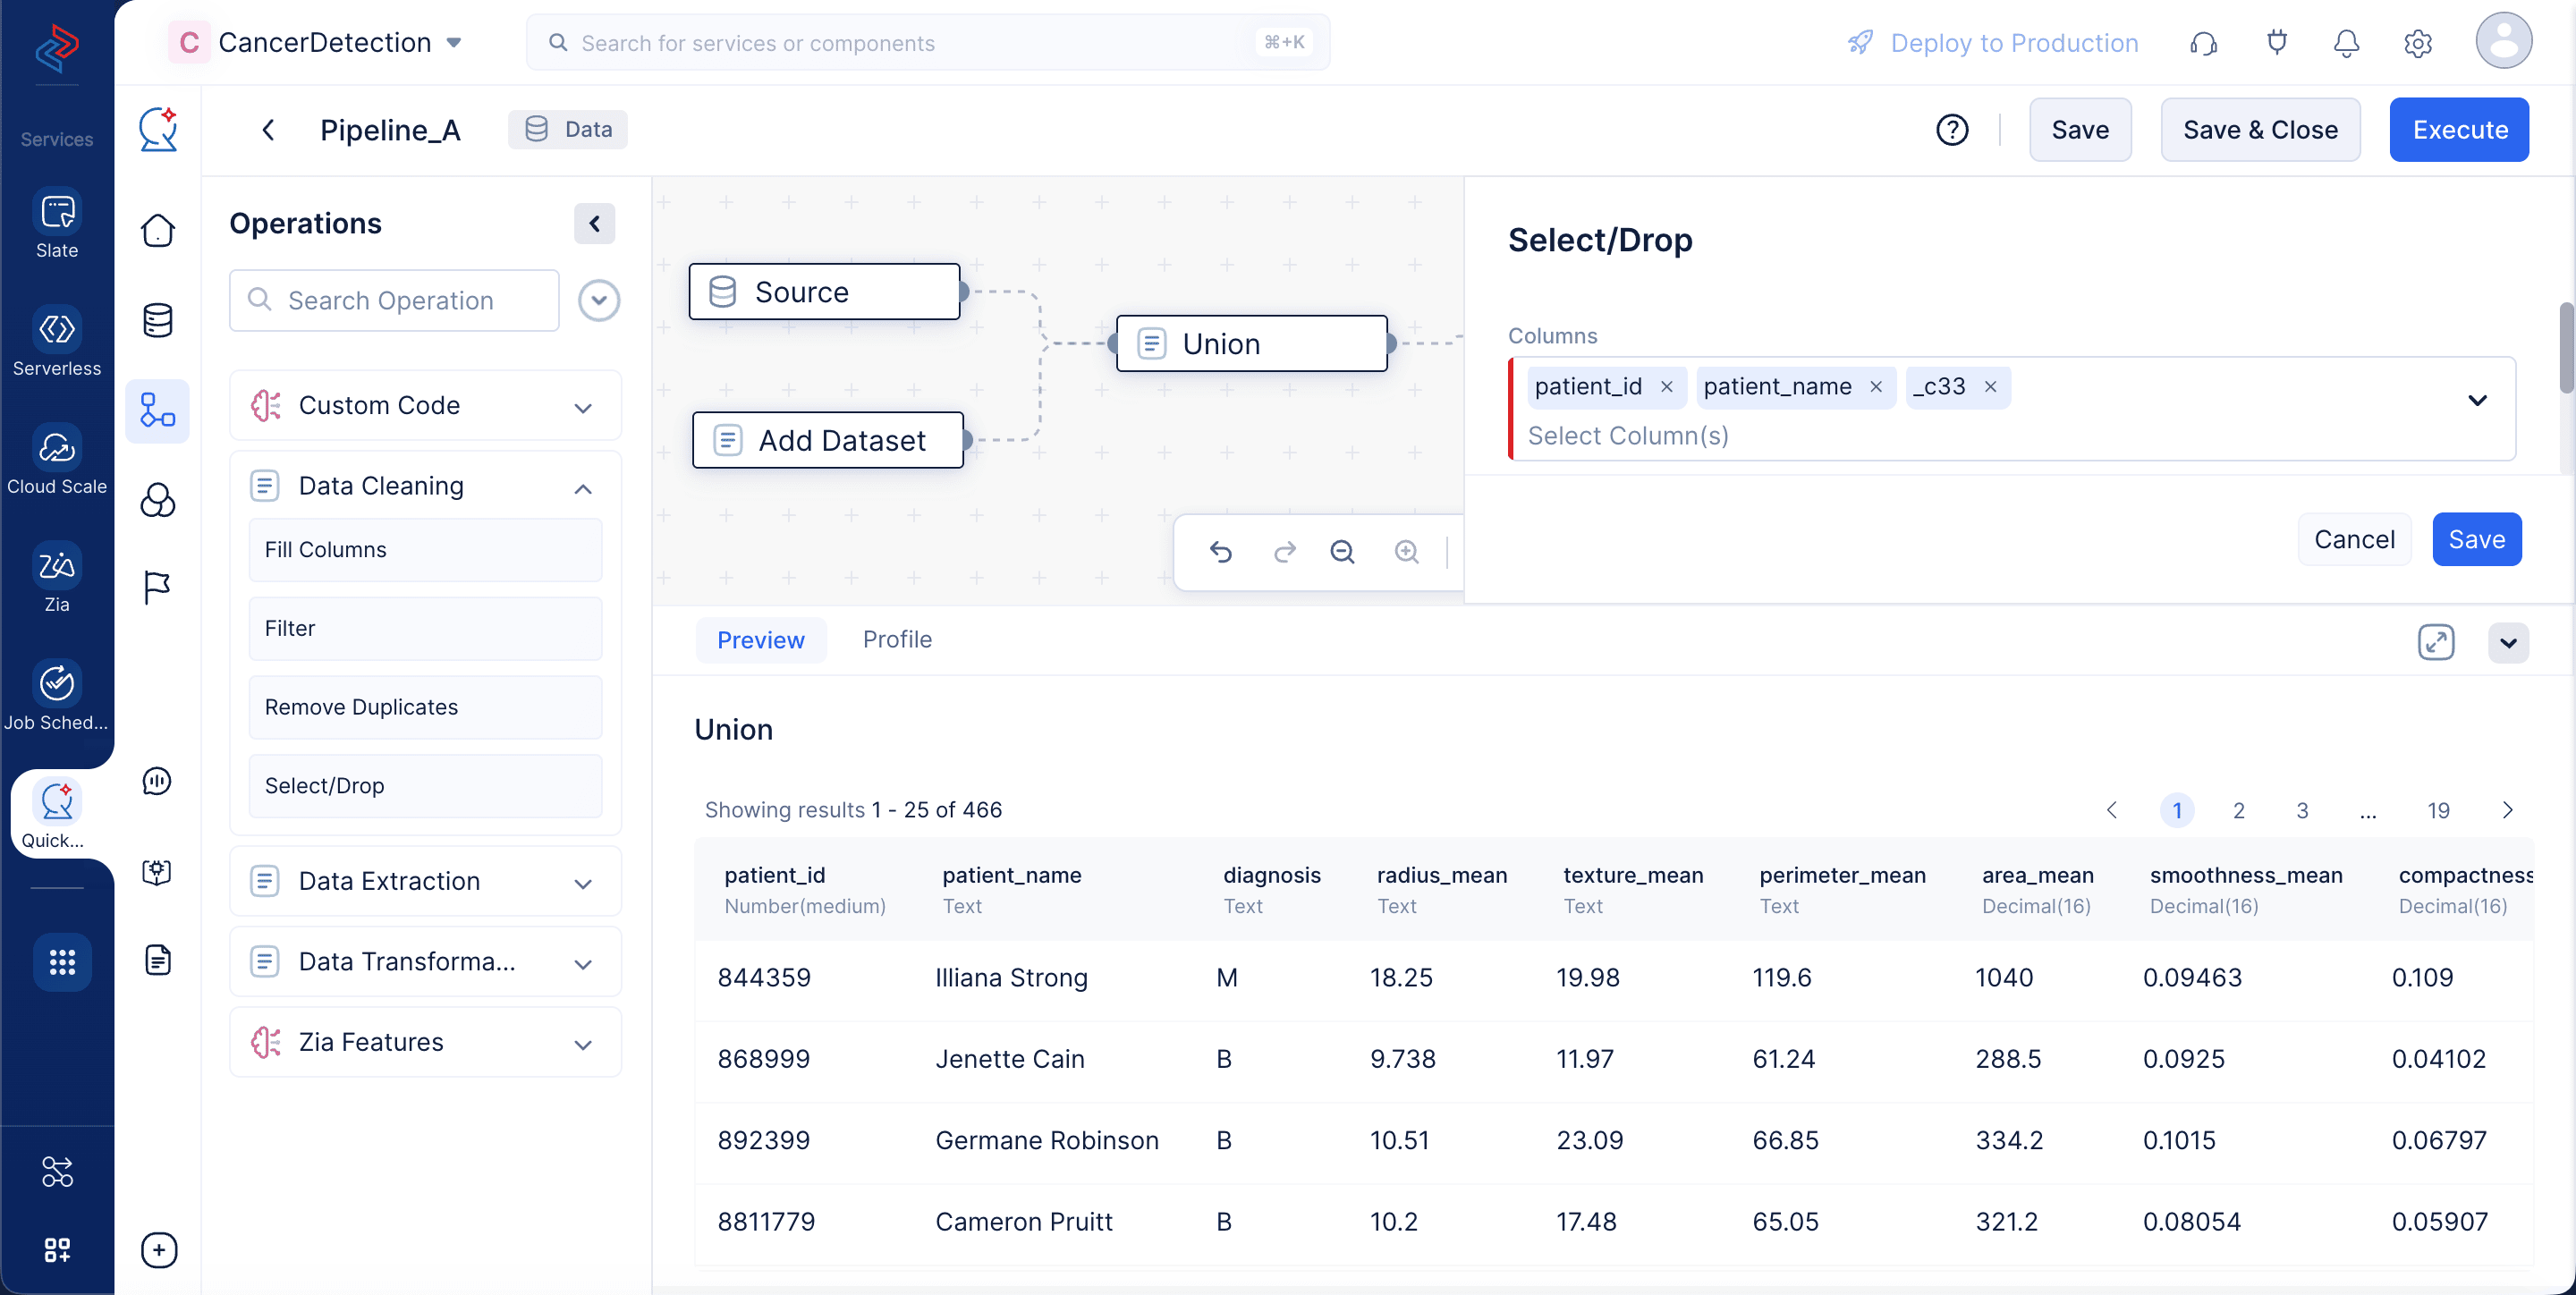
Open the Data Cleaning component from the Operations menu.
-
Drag and drop the Select/Drop node in the Pipeline Builder and make a connection with the Union node.
-
In the Select/Drop section on the right panel, select the “patient_id”, “patient_name” and “_c33” columns, choose the operation “Drop” to drop the columns from the merged dataset, and click Save.
Note: In our case, these columns are generic, serving no purpose to be trained further, so we are removing them.
Data Type Conversion
For the mismatched datatypes in the columns of the datasets, we will be using the Type conversion node to convert the data into the appropriate types. You can view the columns and their datatypes in the Preview tab of the Pipeline details page.
In our dataset, the “texture_mean”, “radius_mean” and “perimeter_mean” column contains decimal values, but it is stored as type String. Please make sure to follow the below listed steps to carry out the conversion process:
-
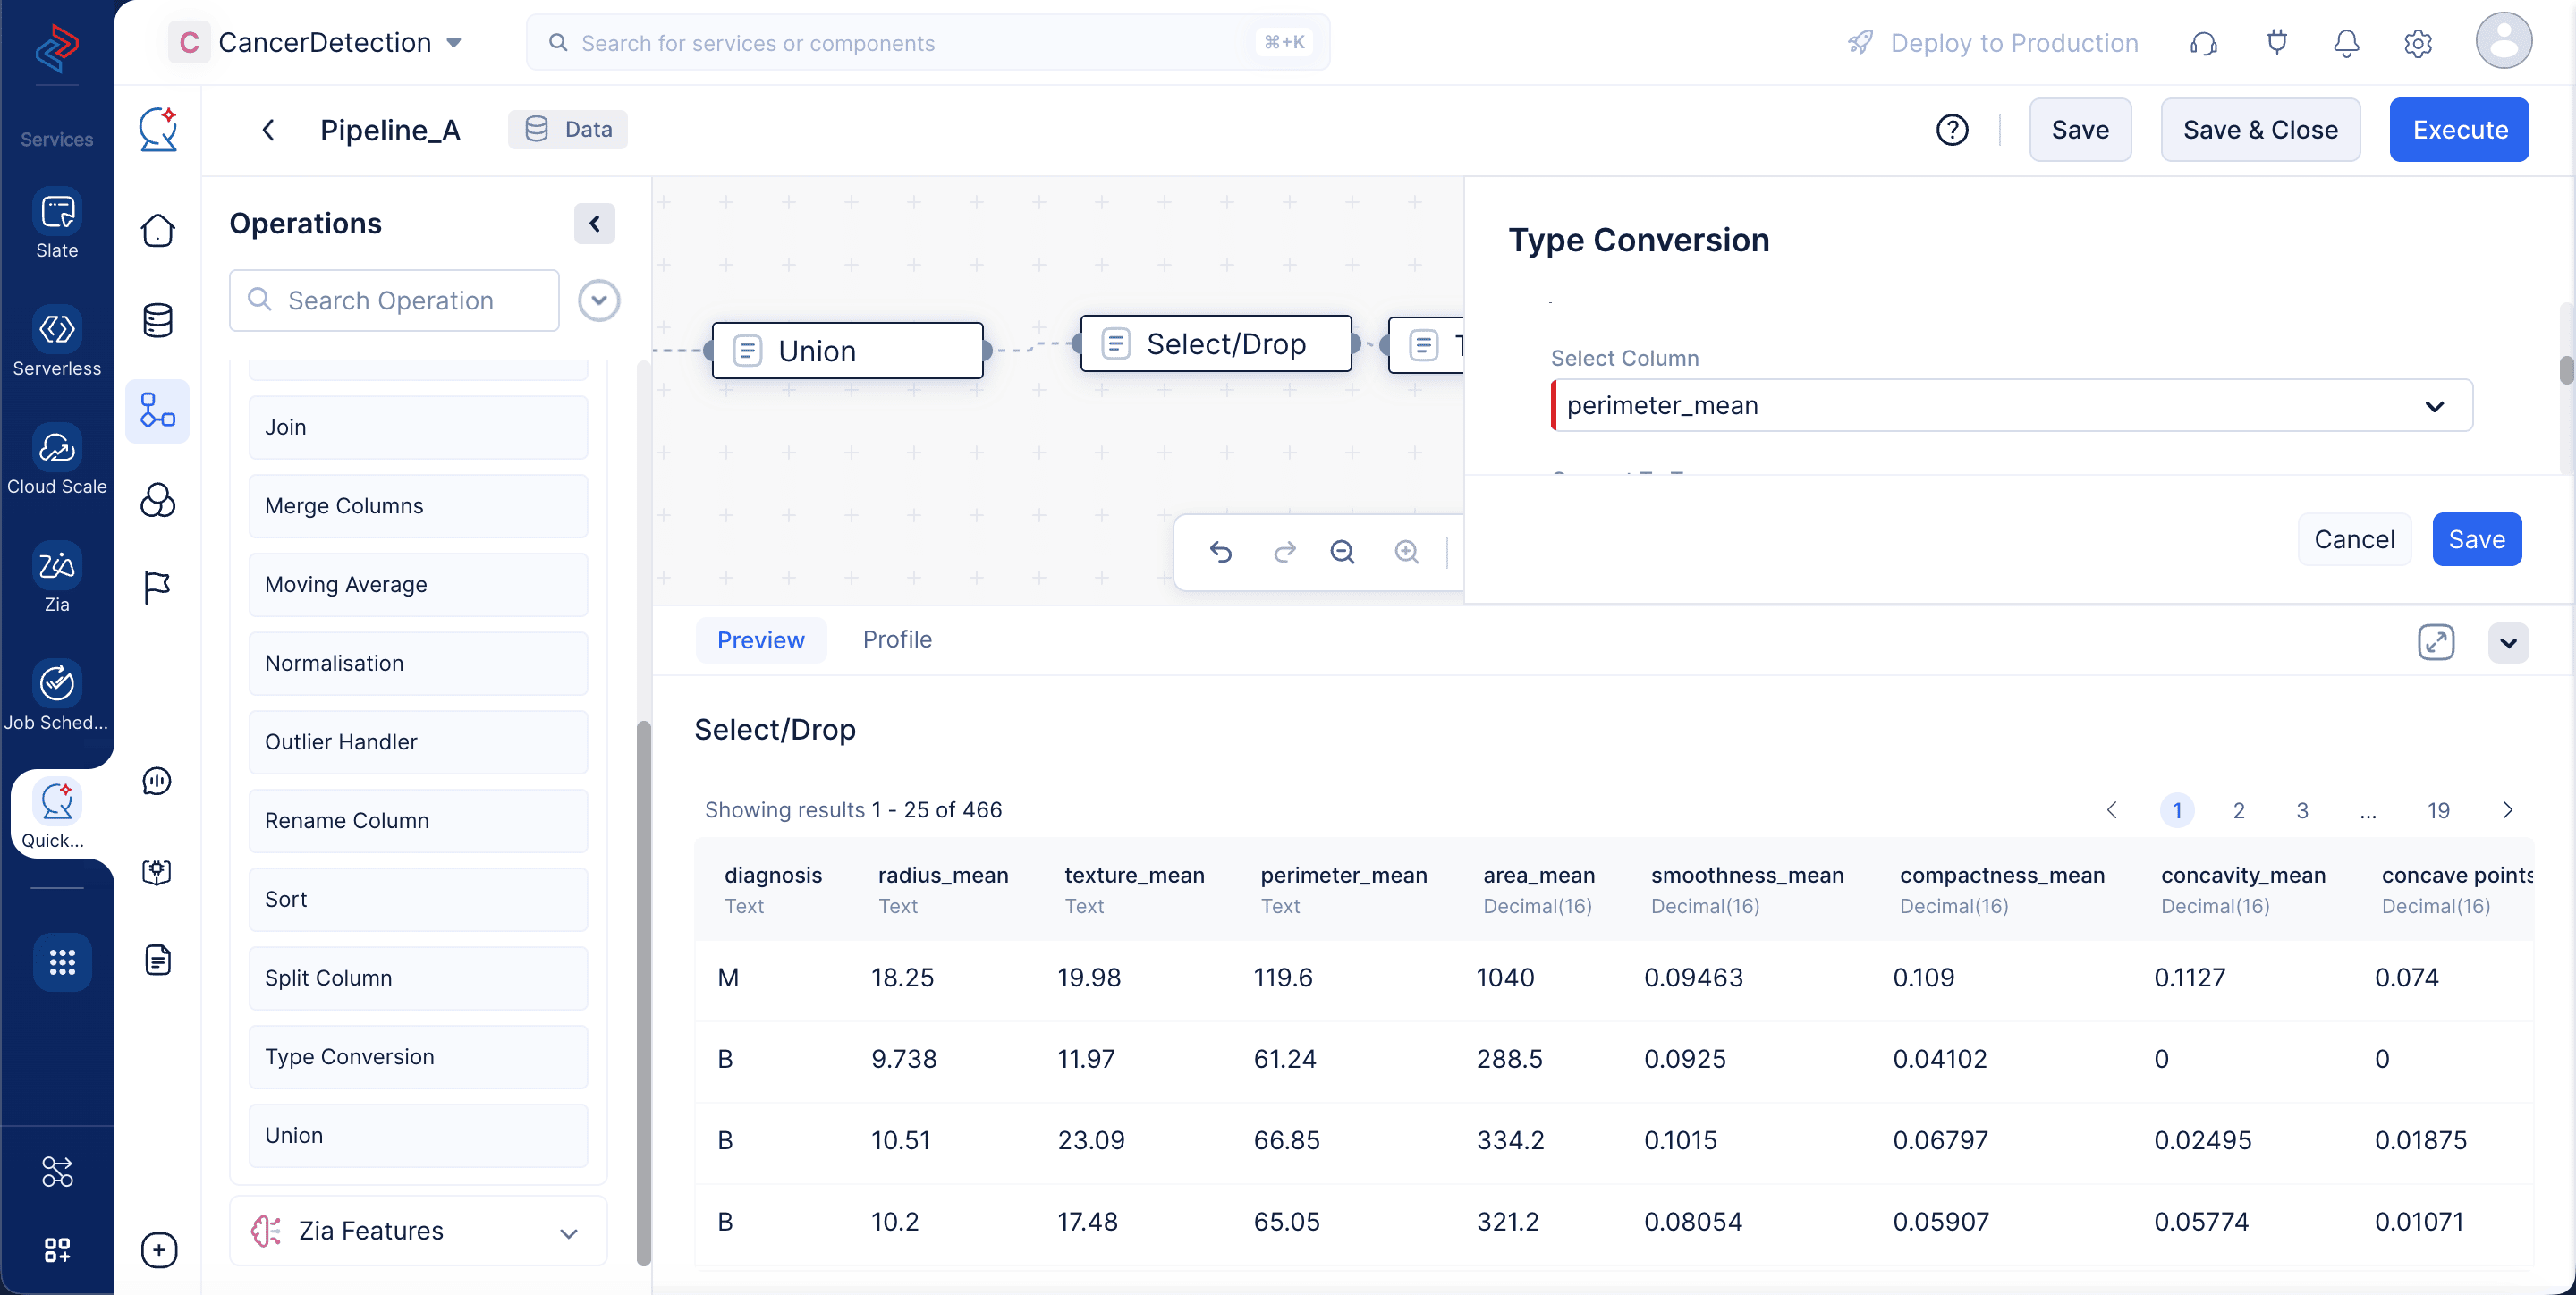
Open the Data Transformation component from the Operations menu.
-
Drag and drop the Type Conversion node into the Pipeline Builder and connect with the Select/Drop node.
-
In the Type Conversion section on the right panel, choose the column as texture_mean, and select the Convert To Type input as Decimal(16) from the drop-down menu. Choose between Throw and Nullify in case of any errors.
-
Likewise, click the + Add button and select the radius_mean and perimeter_mean columns, choose Decimal(16) as Convert to Type, and click Save.
Handle Missing Values
As a part of data preprocessing, we will need to check if there are missing values in any of the columns in the datasets and fill them. We will be using the Fill Columns node for executing this operation.
-
Open the Data Cleaning component from the Operations menu.
-
Drag and drop the Fill Columns node into the Pipeline Builder and connect it with the Type Conversion node.
-
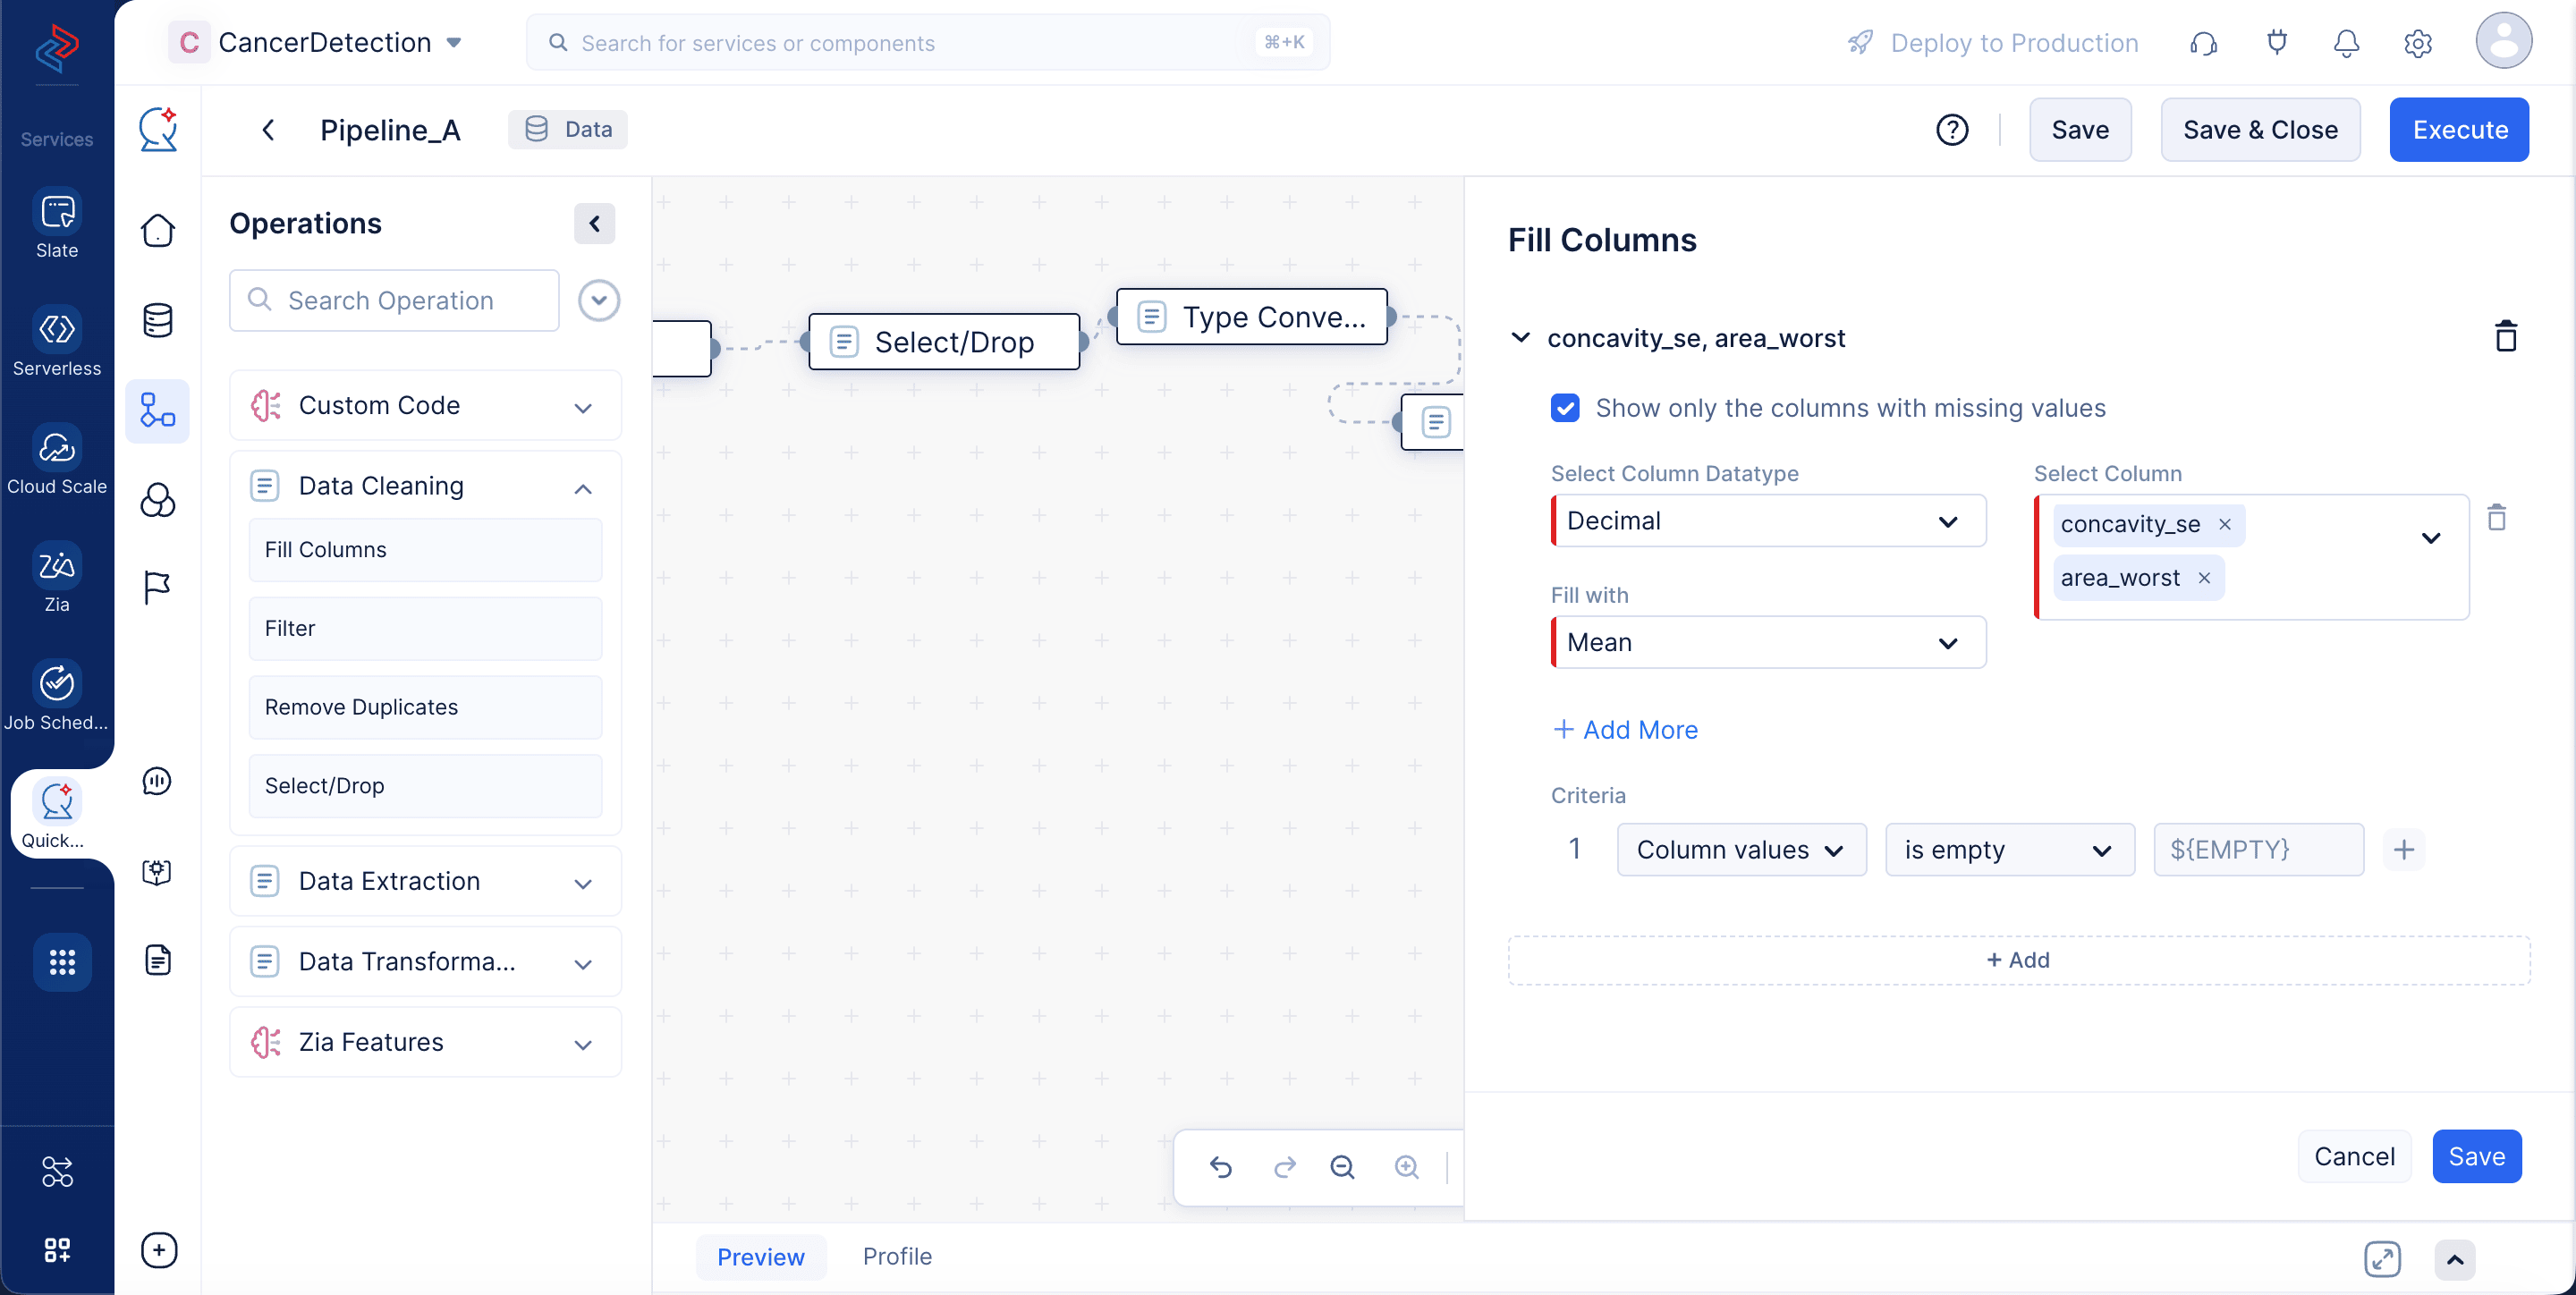
In the Fill Columns section on the right panel, enable Show only the columns with missing values to select the columns that have empty records.
-
Select the columns you want to be filled with a custom value. Select concavity_se, and area_worst and choose the Fill with field as Mean and click Save.
This fills the empty values in the column data with the mean value of the particular columns.
Finally, make a connection between the Fill Columns and the Destination nodes and click Execute.
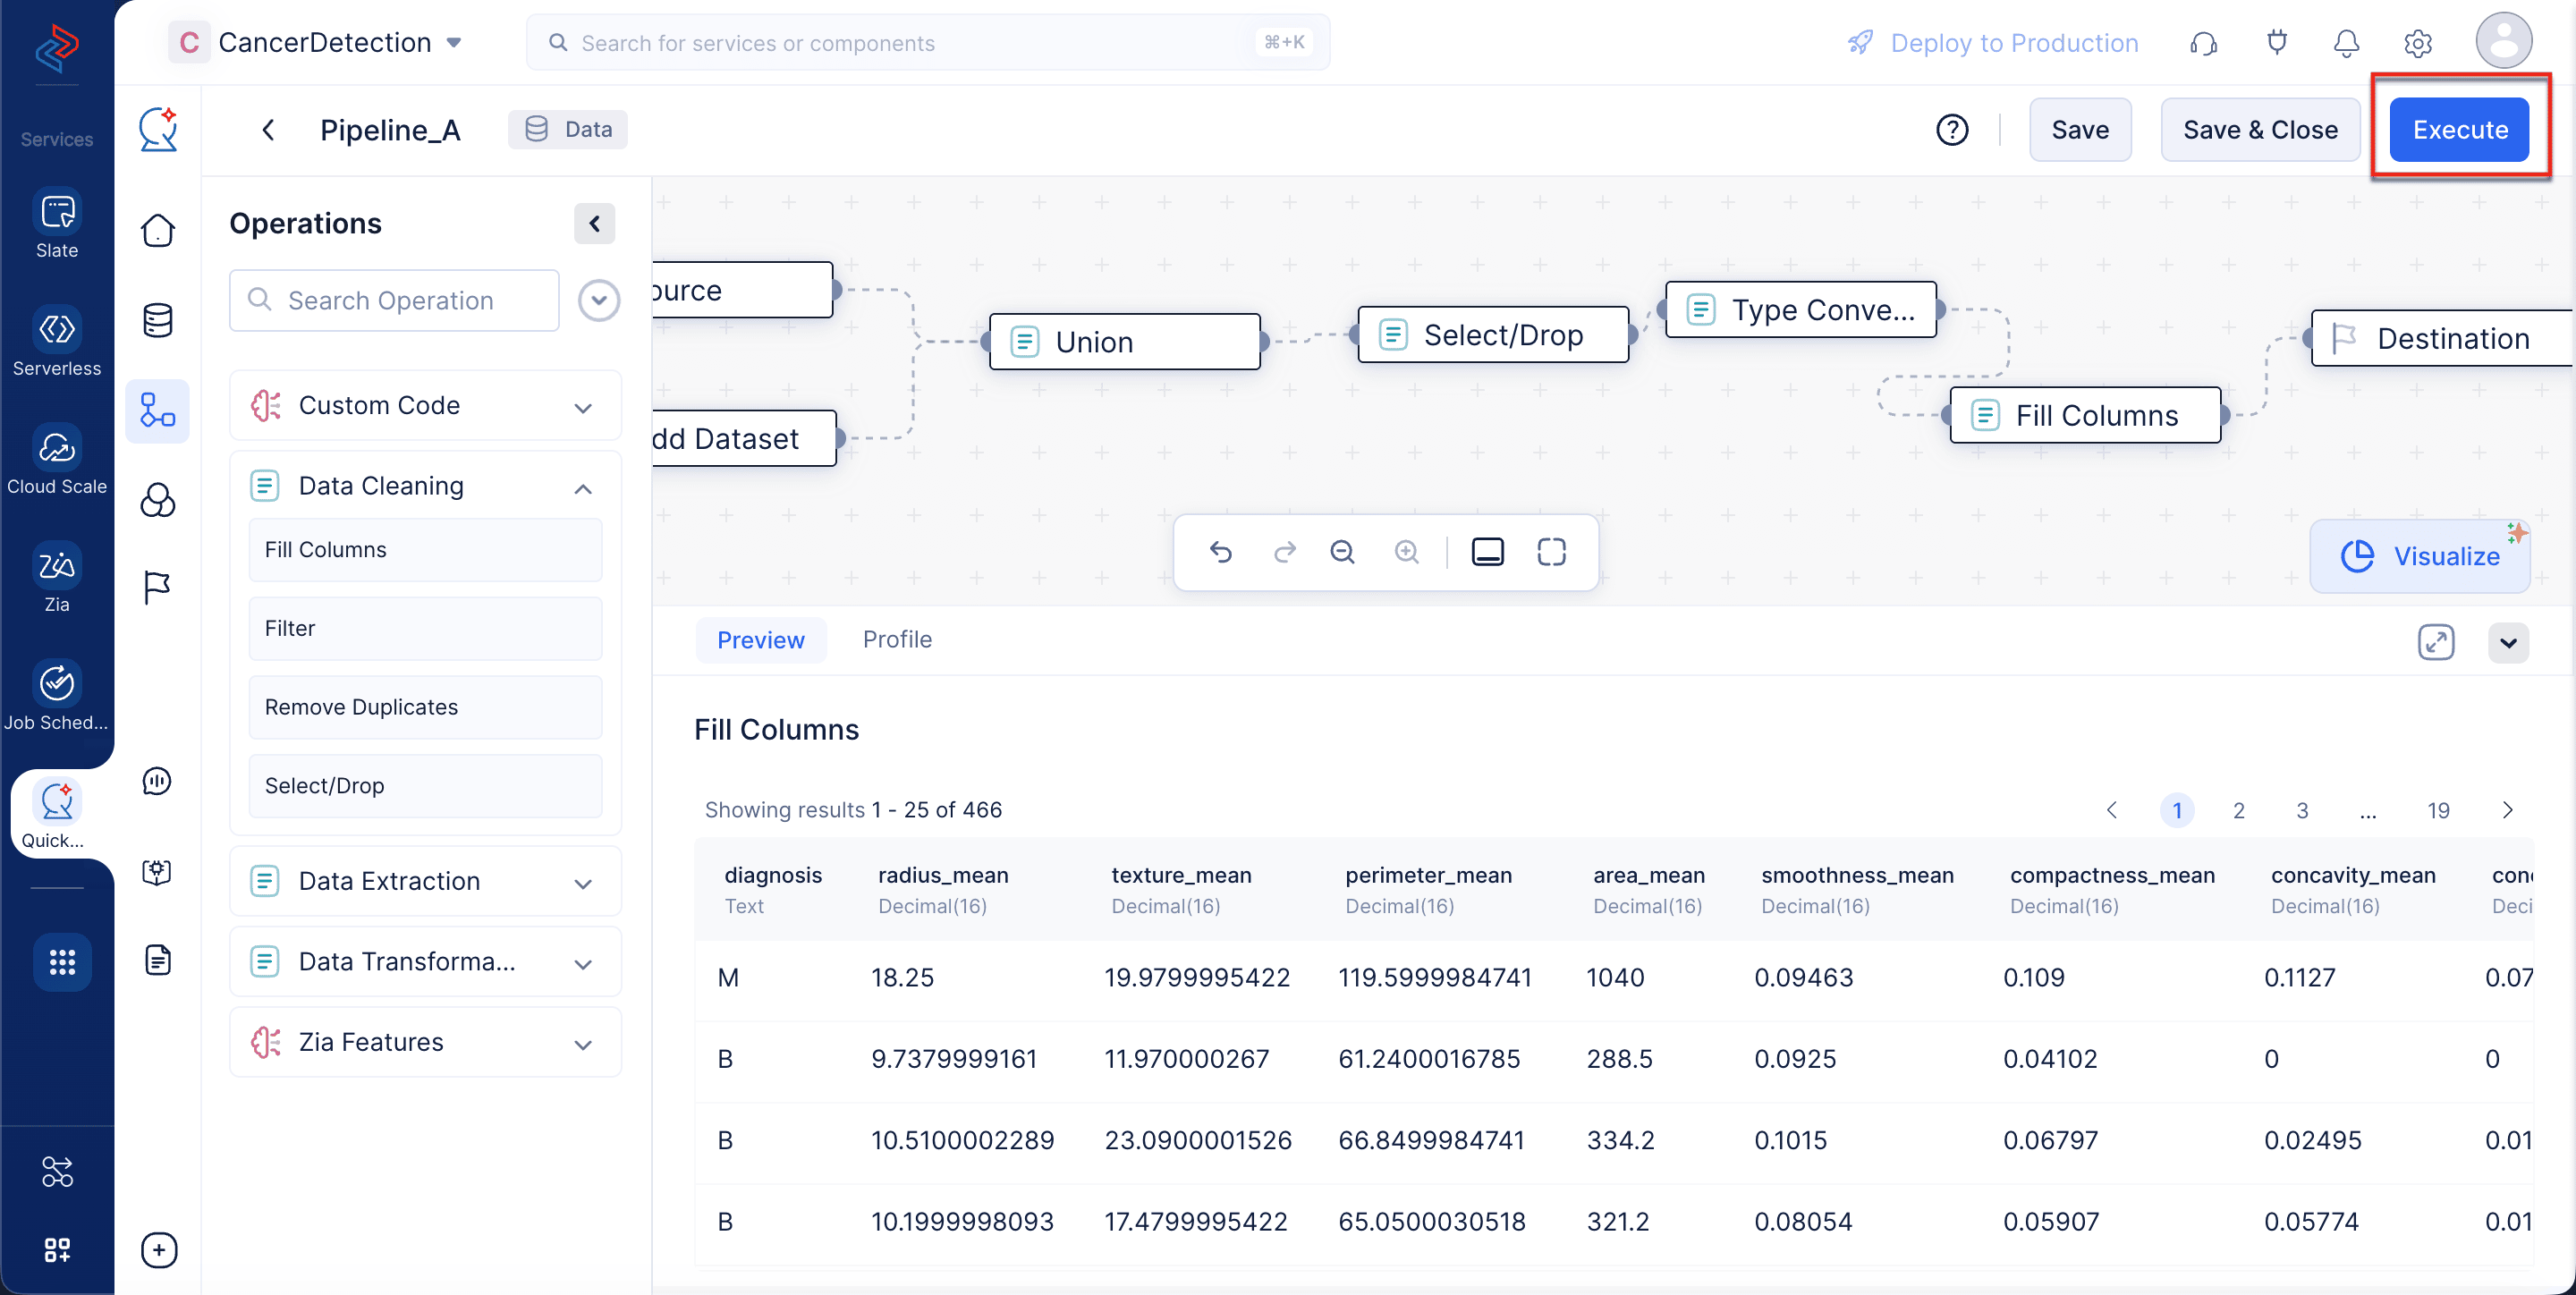
The data pipeline will start execution, and the status will be displayed on the Pipeline Details page. Once the pipeline has completed execution, the status will change to “Success”.
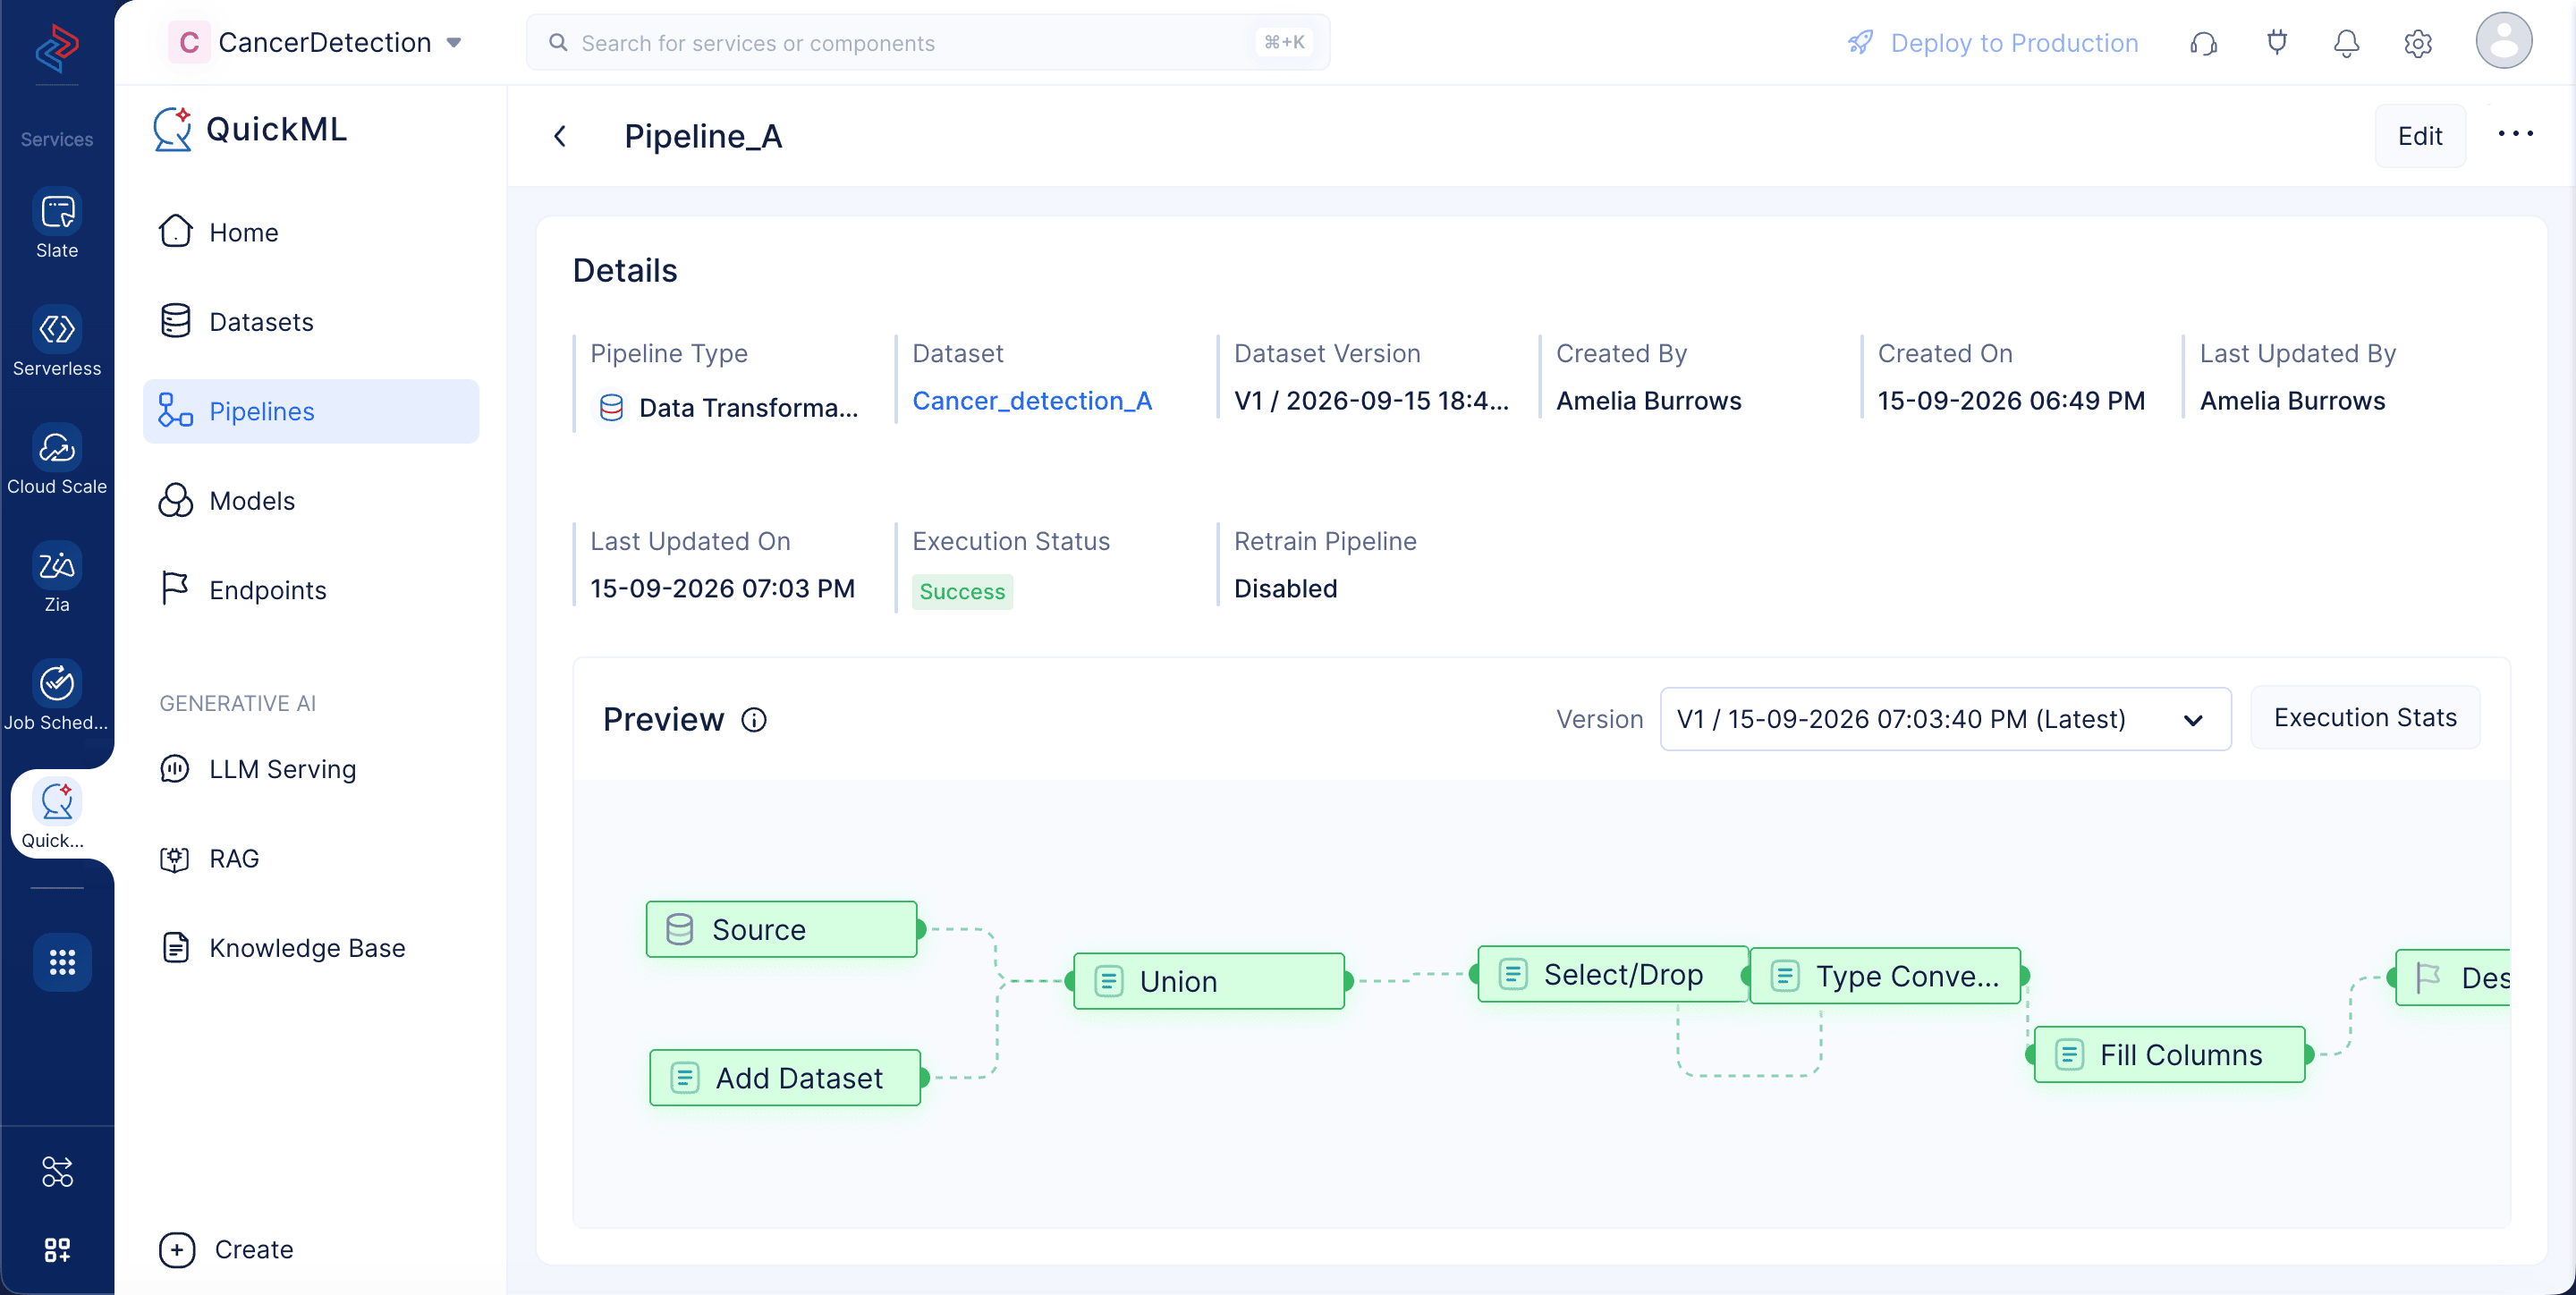
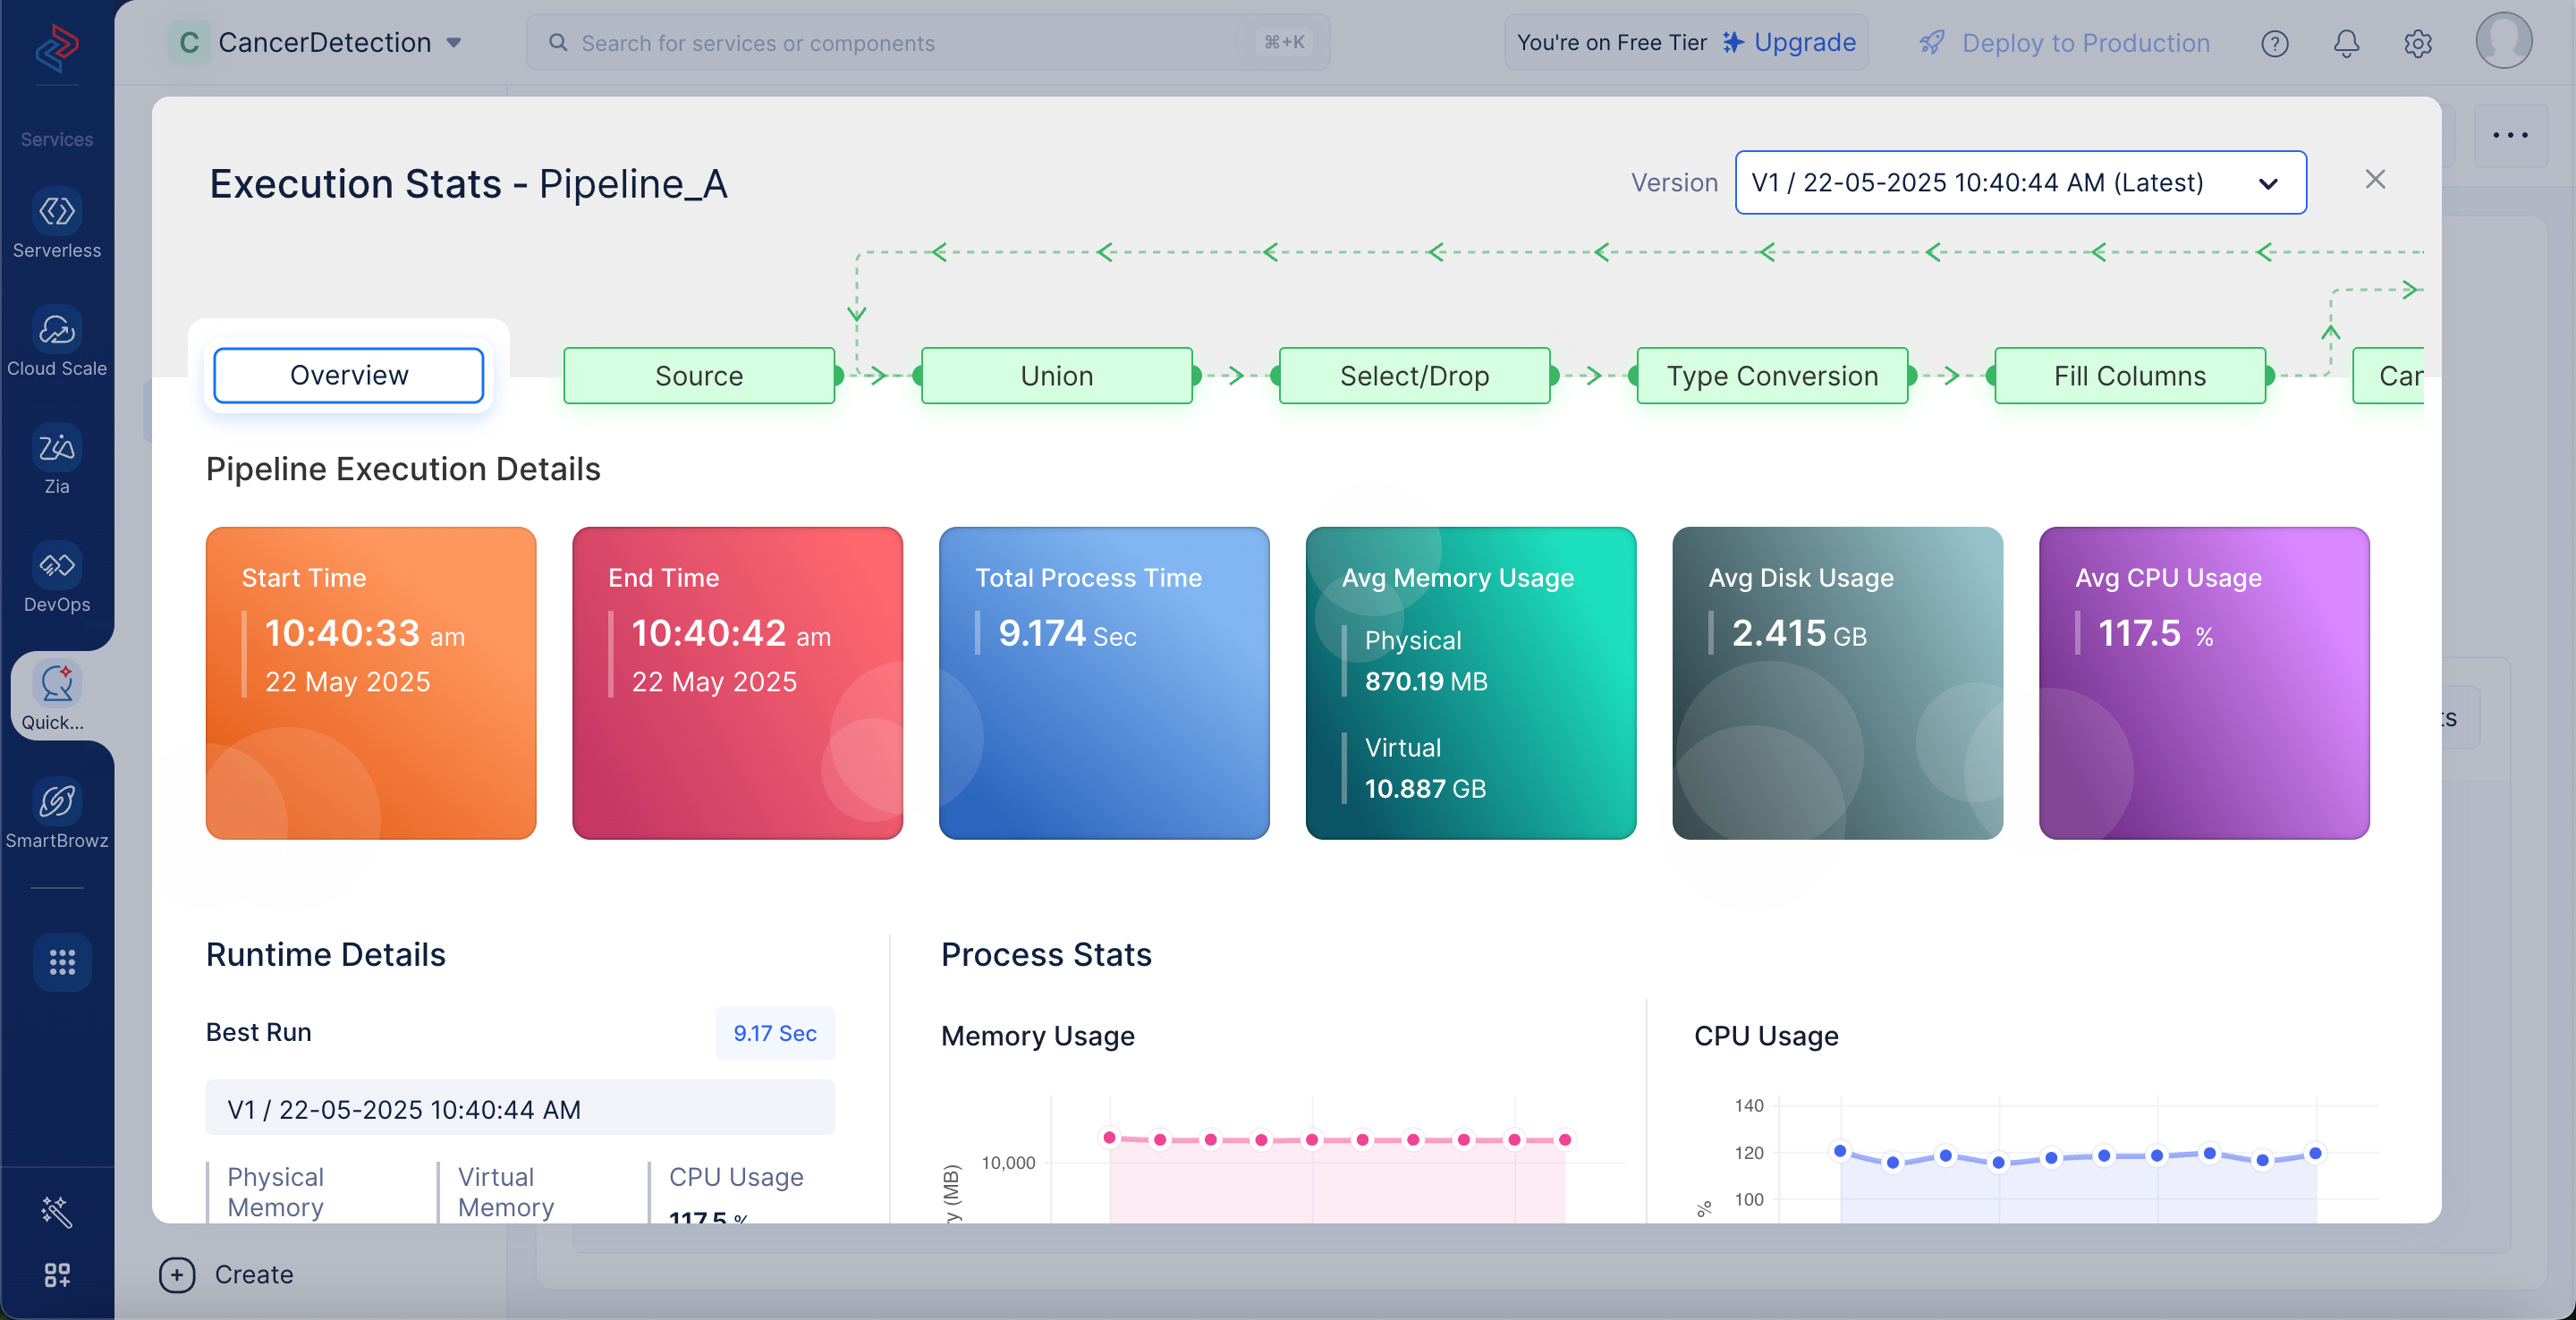
Click Execution Stats to view more details about each stage of the execution in detail.
The dataset to develop the ML model has been prepared. We will be discussing more about the ML pipeline creation in the next section.
Last Updated 2026-10-01 12:33:46 +0530 IST