Data Transformation
Data transformation is the process of converting data from one format or structure into another format or structure.
-
Date time Transformation
This is used to extract date-time features, such as date, year, and month, from a column that contains dates.
Usecase 1: A retail company wants to track the sales of their products over time. DateTime transformation helps them to extract the date, month, and year from the list of sales transactions.
Usecase 2: A transportation company can use DateTime Transformation to extract the date, time, and location from a list of past deliveries to optimize their delivery routes.
Sample input:
dt 2021-11-29 11:52:59 Sample output:
dt_day_of_week 1 dt_date_no 29 dt_year_no 2021 dt_month_no 11 dt_business_day 1 dt_week_no_year 48 dt_day_of_year 333 dt_AM_PM AM dt_quarter_year 4 -
Email Transformation
This is used to extract features like username, domain, and suffix from a column that contains emails.
Usecase 1: A sales team can use Email Transformation to extract the username and domain name from a list of email addresses to personalize their email outreach to potential customers.
Usecase 2: To identify phishing emails, a security team need features such as the domain name and suffix from a list of email addresses that have been flagged as suspicious
Sample input:
mail abc@zylker.com Sample output:
mail_first mail_middle mail_last abc zylker com -
Extract Data
Extract data component utilizes regex patterns to retrieve information from text columns. These patterns may encompass various date formats, emails, or numerical values embedded within the text columns
Example:
In the car price prediction dataset, to extract the Year of manufacture of the car from the name column, we use the POSIX regex pattern /d{4} applied on the same column.Sample POSIX Regex patterns:
- Date format: \d{4}-\d{2}-\d{2}
- Email: [a-zA-Z0-9_.+-]+@[a-zA-Z0-9-]+.[a-zA-Z0-9-.]+
- Number: \d+
-
Format
This is used to modify the column values in dataset based on the function chosen by the user. The Function will be displayed based on the data types of the column.
Example:
In patient dataset, formatting age column using the absolute value function. The age column will no longer have any negative values in it. -
Group By
This is used to partition rows into groups based on their values in one or more columns. It is mandatory to provide at least one aggregate function for a column. Users can also set the HAVING criteria to filter the grouped dataset.
Example:
Example: In an employee salary dataset, users can sum the salaries given to each department by grouping the data by department. This allows users to see the total salary expenditure for each department. In HAVING section it can filter these groups to only include departments where the total salary exceeds 50,000.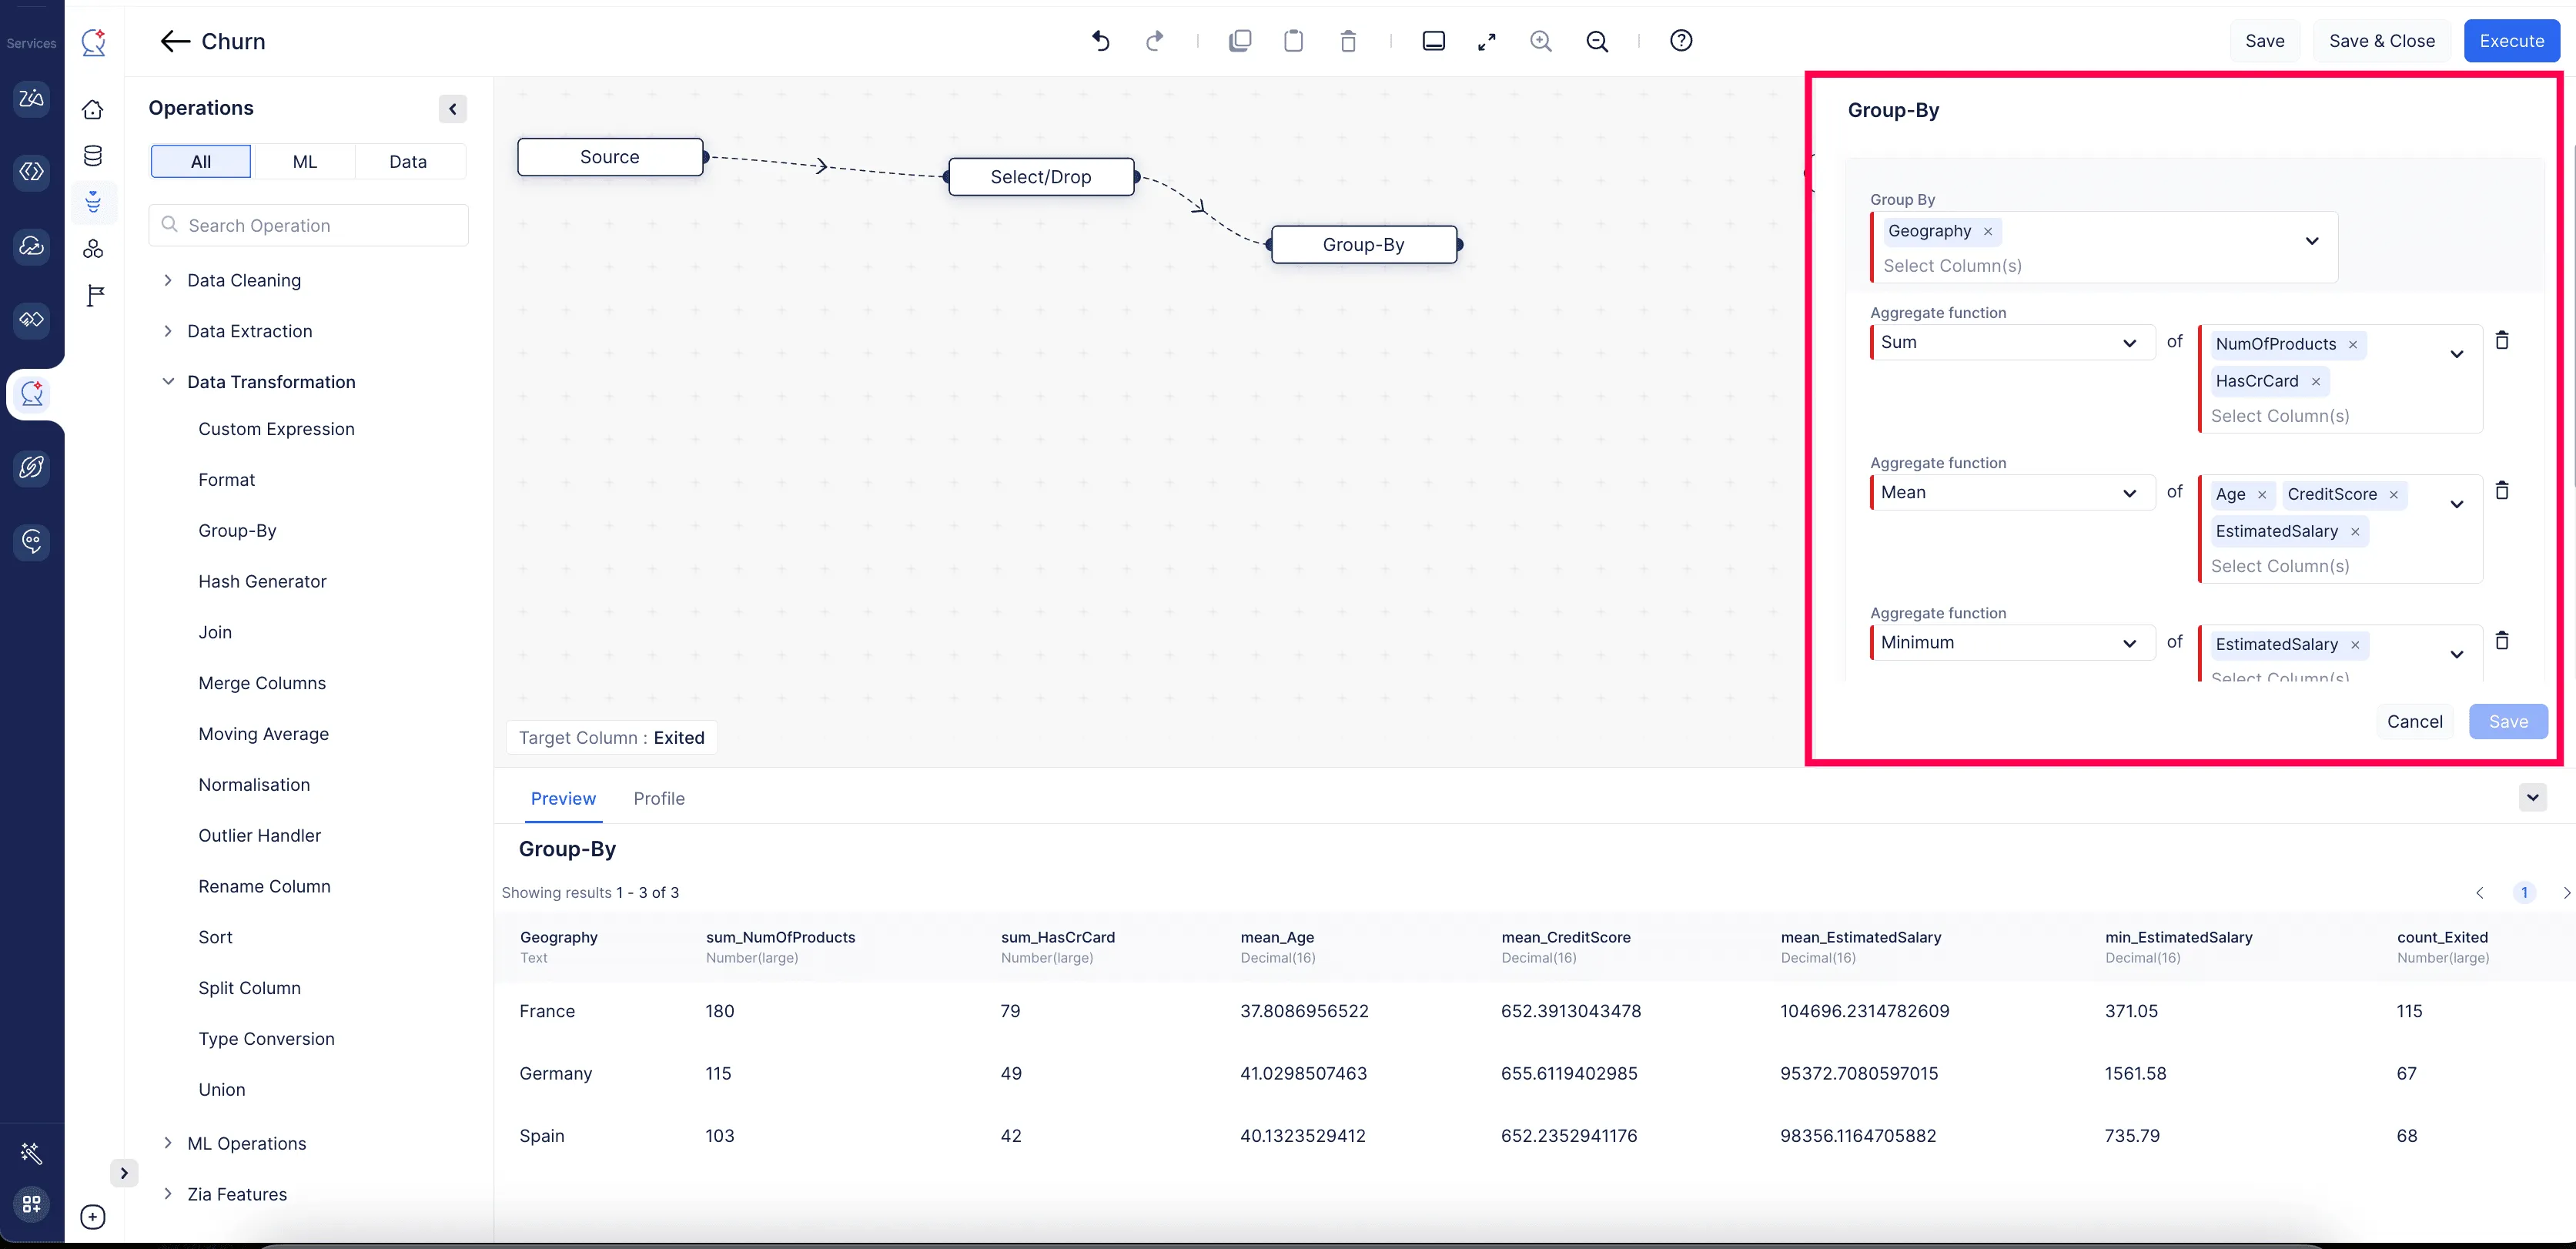
-
Hash Generator
This is used to hash one or several columns in the dataset. Users are also able to drop the source column once the hash is generated.
-
Join
This is used to join two datasets into single dataset based on the primary column in both tables. User can able to perform Left, Right, Inner and Outer joins.
Note : This stage requires selecting a dataset node.
Example: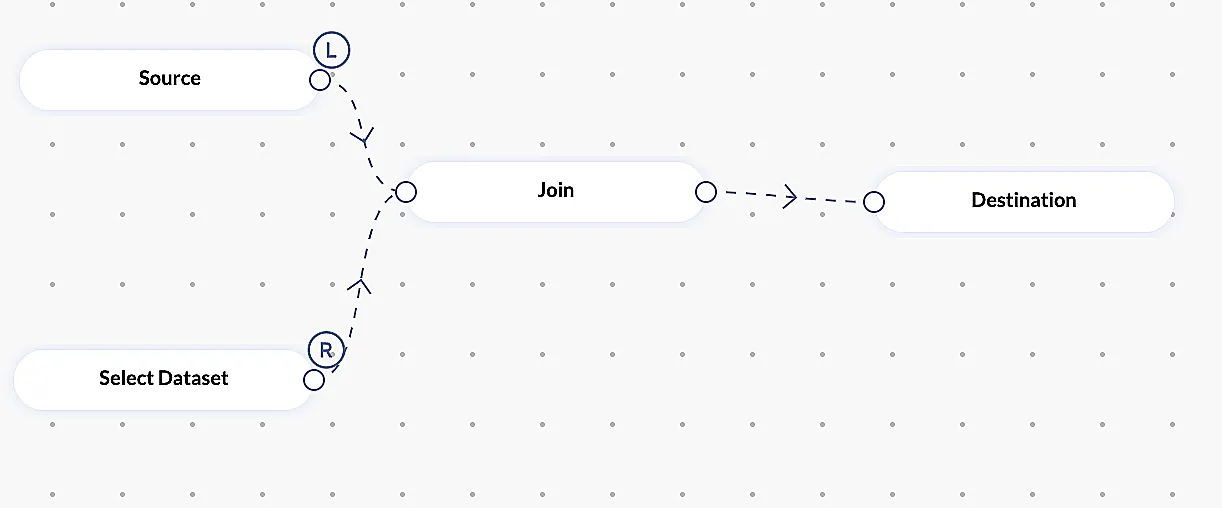
-
Merge Column
This is used to merge two or more columns into a single column using a separator specified by the user. User can also able to drop the source column after performing the merge operation.
Example:
In passenger dataset, We can combine first_name, middle_nam,e and last_name as Name column using a space separator. -
Normalization
Normalization is a statistical method that helps scale and compare variables on different scales or units. This node is used to normalize two or more columns.
-
Outliner Handler
Outliers are the data points that falls outside of the normal distribution of the data, which can distort the results of data analysis and leads to incorrect conclusions. Outlier Handler can be used to remove outliers from a dataset or replace them with more reasonable values, such as the cap, mean, or median values of the respective columns in the data.
-
Sort
This is used to sort the dataset by set of columns. Users are also able to choose the sorting order.
-
Split Column
This is used to split a single column into two or more columns based on the separator specified by the user. The number of output columns will be determined based on the output names given by the user.
Example:
In passenger dataset, User can split Name column into three columns by specifying first_name, middle_name, and last_name in the output column text box. -
String Transformation
Used to produce word embeddings from columns that contain text.
Usecase 1: To provide recommended content to its users, a social media company can utilize the String Transformation to get the word embeddings from the text of the posts that users have liked and shared.
Usecase 2: From the text of the tickets, a customer support team needs to classify customer support tickets by identifying common issues that their customers are experiencing by using word embeddings produced by string transformation.
-
Type Conversion
This is used to convert type of column into data type specified by the user. Users are able to handle the resultant dataset if an error occurs by using the On Error option in configuration. Throw will throw an exception if an error occurs and will stop the execution, while Nullify will return the original record if an error occurs for that particular record.
-
URL Transformation
This is used to extract features such as sub_domain, domain, and suffix from a column that contains URLs.
Usecase 1: A marketing team needs to determine which websites are most frequently visited by their target market. They can utilize URL Transformation to extract the domain names from a list of URLs that users of their website have clicked.
Usecase 2: A fraud detection team can use URL transformation to find out the list of domains, subdomains, and suffixes of malicious websites from a list of URLs that has been flagged as suspicious.
Sample input:
link https://www.google.in/library?fetch=query#fragment_part Sample output:
link_url_protocol https link_url_domain www.google.in link_url_path /library link_url_query fetch=query link_url_fragment fragment_part link_domain_tld in link_domain_country IN subdomain www -
Union
This is used to combine two datasets into a single dataset. Users can able to drop duplicate rows after combining two datasets.
Note: This stage requires selecting a dataset node. -
Windowing
This is used to perform window average operation in number columns. User should need to specify the windowing range which should be greater than 0.Moving averages are a simple and common type of smoothing used in time series analysis and time series forecasting. This can be used for time series dataset.
-
Fill Columns
This is used to change the values of a specific column based on the criteria set by the user. If the criteria are not specified in the configuration, then all the values in that column will be replaced by the user-specified value or method.
Example:
For a population dataset of a country that contains patient details like name, age, address, and eligibility for voting, we can update the “eligible for vote” column to “yes” for all people whose age is greater than 18. -
Rename
This is used to rename any particular column name from the dataset.
Example:
For a dataset containing columns such as name, age, address, and eligible_for_vote, we can rename the eligible_for_vote column to voter_eligibility. -
Custom Expression
This allows users to create custom expressions to manipulate or calculate values in a dataset. Custom expressions can be used to derive new columns, transform existing data, or apply complex calculations based on the data.
Example:
For a dataset containing columns such as name, age, address, and salary, we can create a custom expression to calculate the yearly salary from the monthly salary.
Last Updated 2025-09-30 16:23:20 +0530 IST
Yes
No
Send your feedback to us