Data Profiler and Viewer
What is Data Profiling?
Data profiling is the process of reviewing raw data; understanding its structure, content, and interrelationships; and identifying opportunities for analytical insights.
It is crucial while performing data preprocessing, performing data visualization, and improving data quality score. It also helps to improve the analysis by providing overall intelligence about the data being used.
Examples of how data profiling can be used:
- Data preprocessing: To identify missing values, unique and duplicate values, and inconsistent data formats, which helps to clean up and prepare the data for analysis.
- Data visualization: Data profiling helps us to understand the actual distribution of data and identify any outliers, so that we can create more accurate and informative data visualizations.
- Improving data quality score: By identifying and fixing the data quality issues, data profiling helps to improve the reliability of the data for further analysis.
Data profiling involves an assortment of activities, including:
- Collecting statistics details like min, max, mean, and more for numeric columns
- Gathering data types and identifying recurring patterns in data
- Finding redundancy and quality of data
- Making inter-table analysis of tabular data
Data Profiling in QuickML
The uploaded data in the QuickML dataset module automatically goes through the data profiling section and provides rich understanding and valuable insights of the data.
-
Records count, unique values and percentages: QuickML can find the number of unique, duplicate values and their respective percentages of total in each column of your data that can be used to efficiently update the rows & columns.
-
Data type and Visualization: The QuickML Data profiler accurately identifies the data type of each feature in a dataset and visualises the distribution to get clear insights about the data.
-
Missing values: QuickML data profiler can fetch the count and percentage of missing values, such as blank and null values, and helps data scientists set up appropriate values.
-
Statistical details: QuickML data profilers generates below statistical data for numeric and categorical columns:
| Numeric columns | Sum, Min, Max, Mean, Median, Standard Deviation, Variance & low, medium, high percentiles | Catagorical columns | Unique, Duplicates |
|---|
-
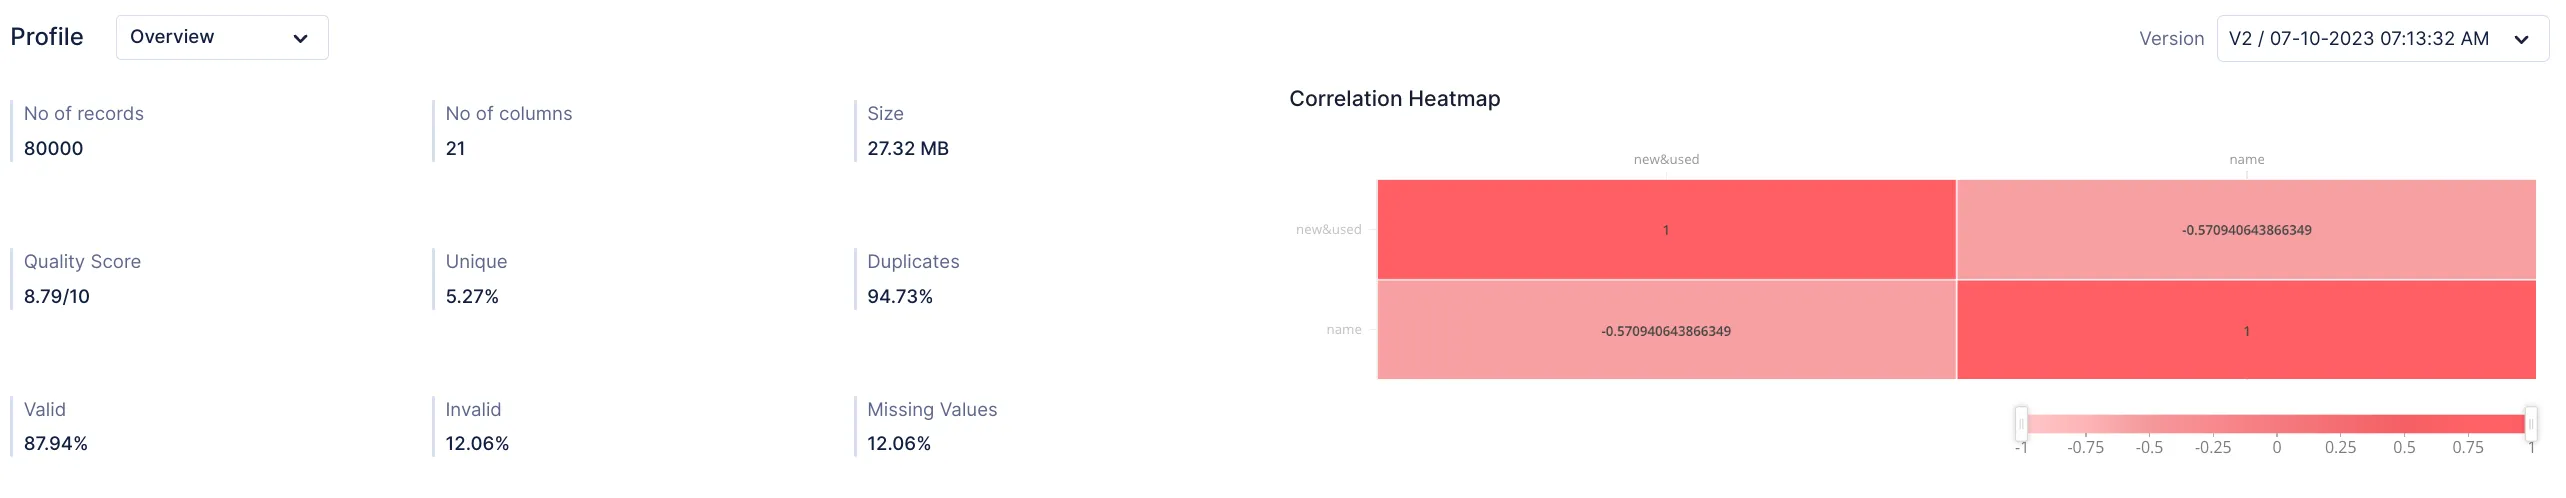
Dataset Versioning & Quality score QuickML can profile multiple versions of the same data and generate quality scores for each version. The data profile can be viewed at any time using the version option on the Dataset details page.
-
Correlation Heatmap The data profiler generates a correlation heatmap for all versions of the dataset, which visualizes the interrelationships of the features and the extent to which they are related to each other and to the target feature.
Data Viewer in QuickML
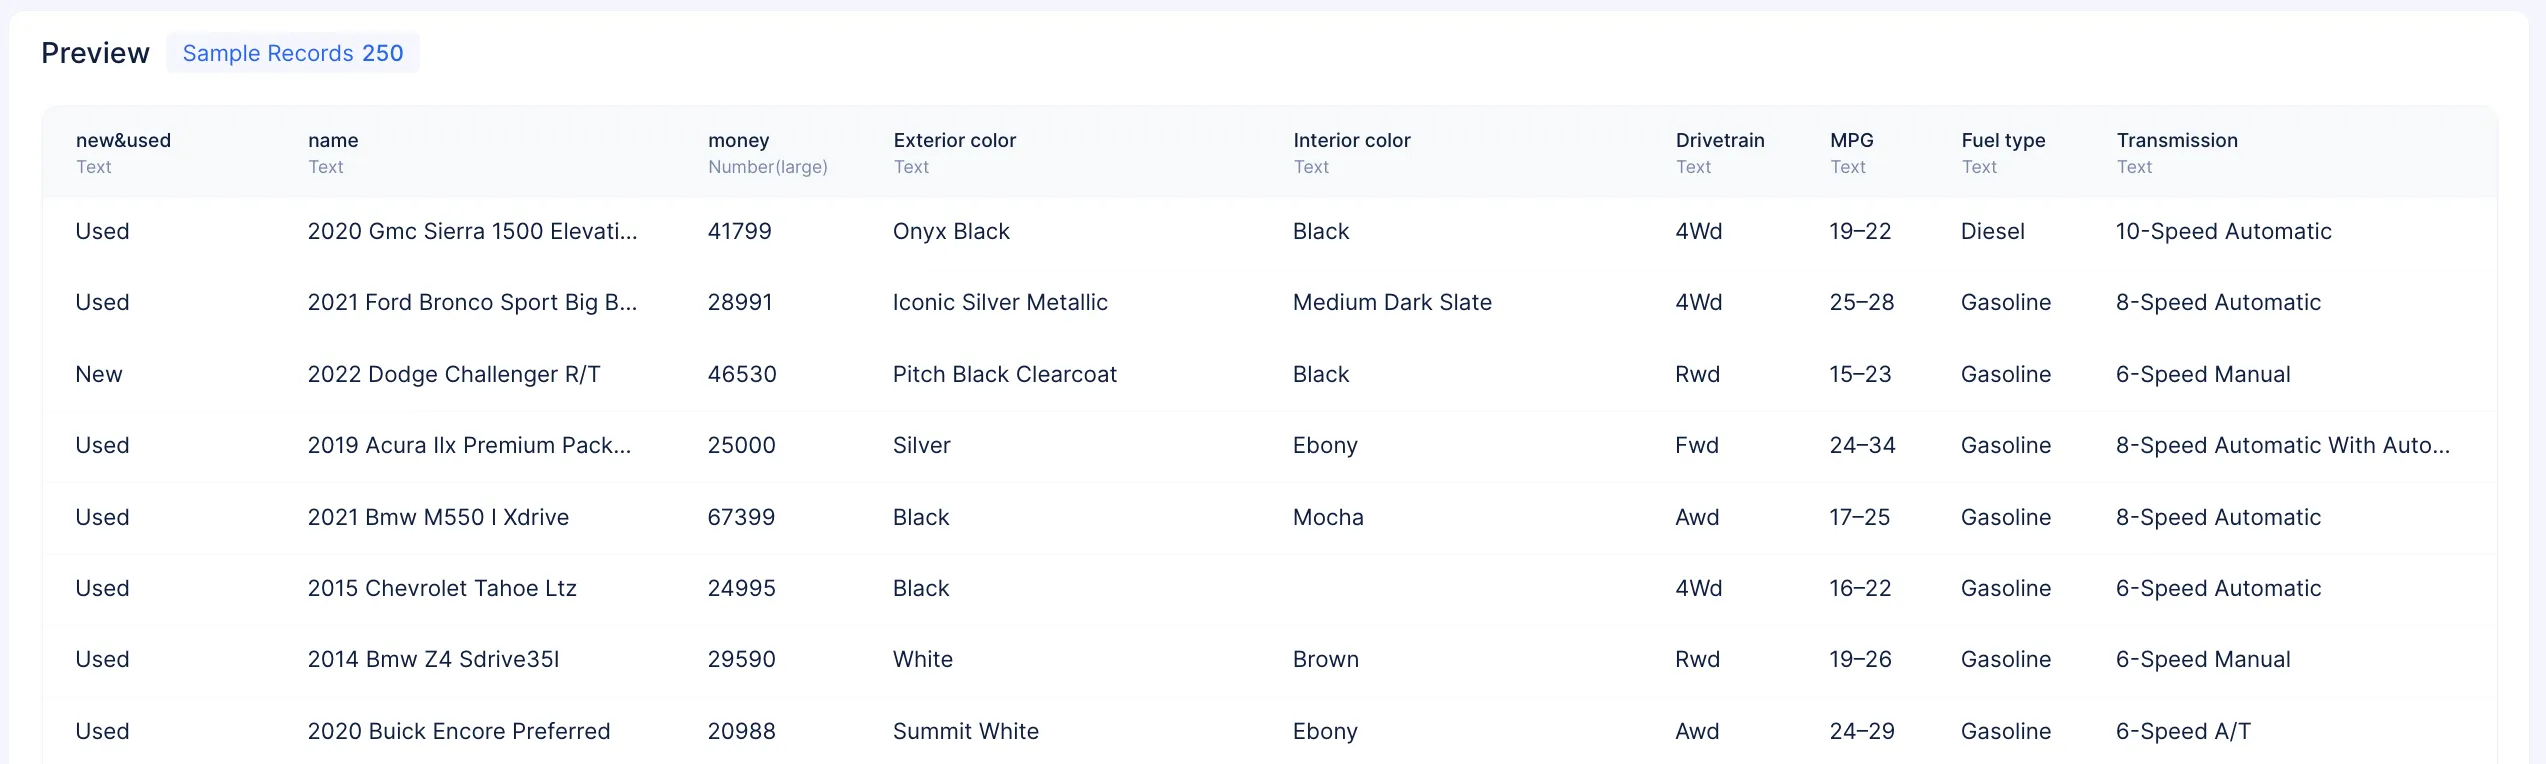
A data preview is generated in the dataset details page by sampling 250 records from the original dataset, which helps to identify the data types of each feature.
Last Updated 2025-02-19 15:51:40 +0530 IST
Yes
No
Send your feedback to us