Python関数のデバッグ用IDE設定
このヘルプドキュメントでは、Visual Studio CodeでPythonの非HTTPSおよびIntegration関数のデバッグ設定を行う方法を説明します。
注意: この手順は、トンネリング済み関数をデバッグしたい場合にのみ適用され、以下のCLIコマンドを使用している場合に該当します:
copy
$
catalyst functions:shell –tunnel tunnel-port-number –debug port-number
関数のトンネリングのみを行い、以下のCLIコマンドを使用している場合は、IDE設定は不要です。
copy
$
catalyst functions:shell –tunnel tunnel-port-number
このコマンドは関数をトンネリングするのみで、関数のログをCatalyst CLIに出力します。
VS Code IDEのデバッガーを以下の方法で設定します:
-
デバッグが必要なすべての関数がローカルマシンにあることを確認し、該当するプロジェクトをVS Codeで開きます。
-
メニューバーのRun/Debugボタンをクリックし、「create a launch.json file」オプションをクリックしてlaunch.jsonファイルを作成します。
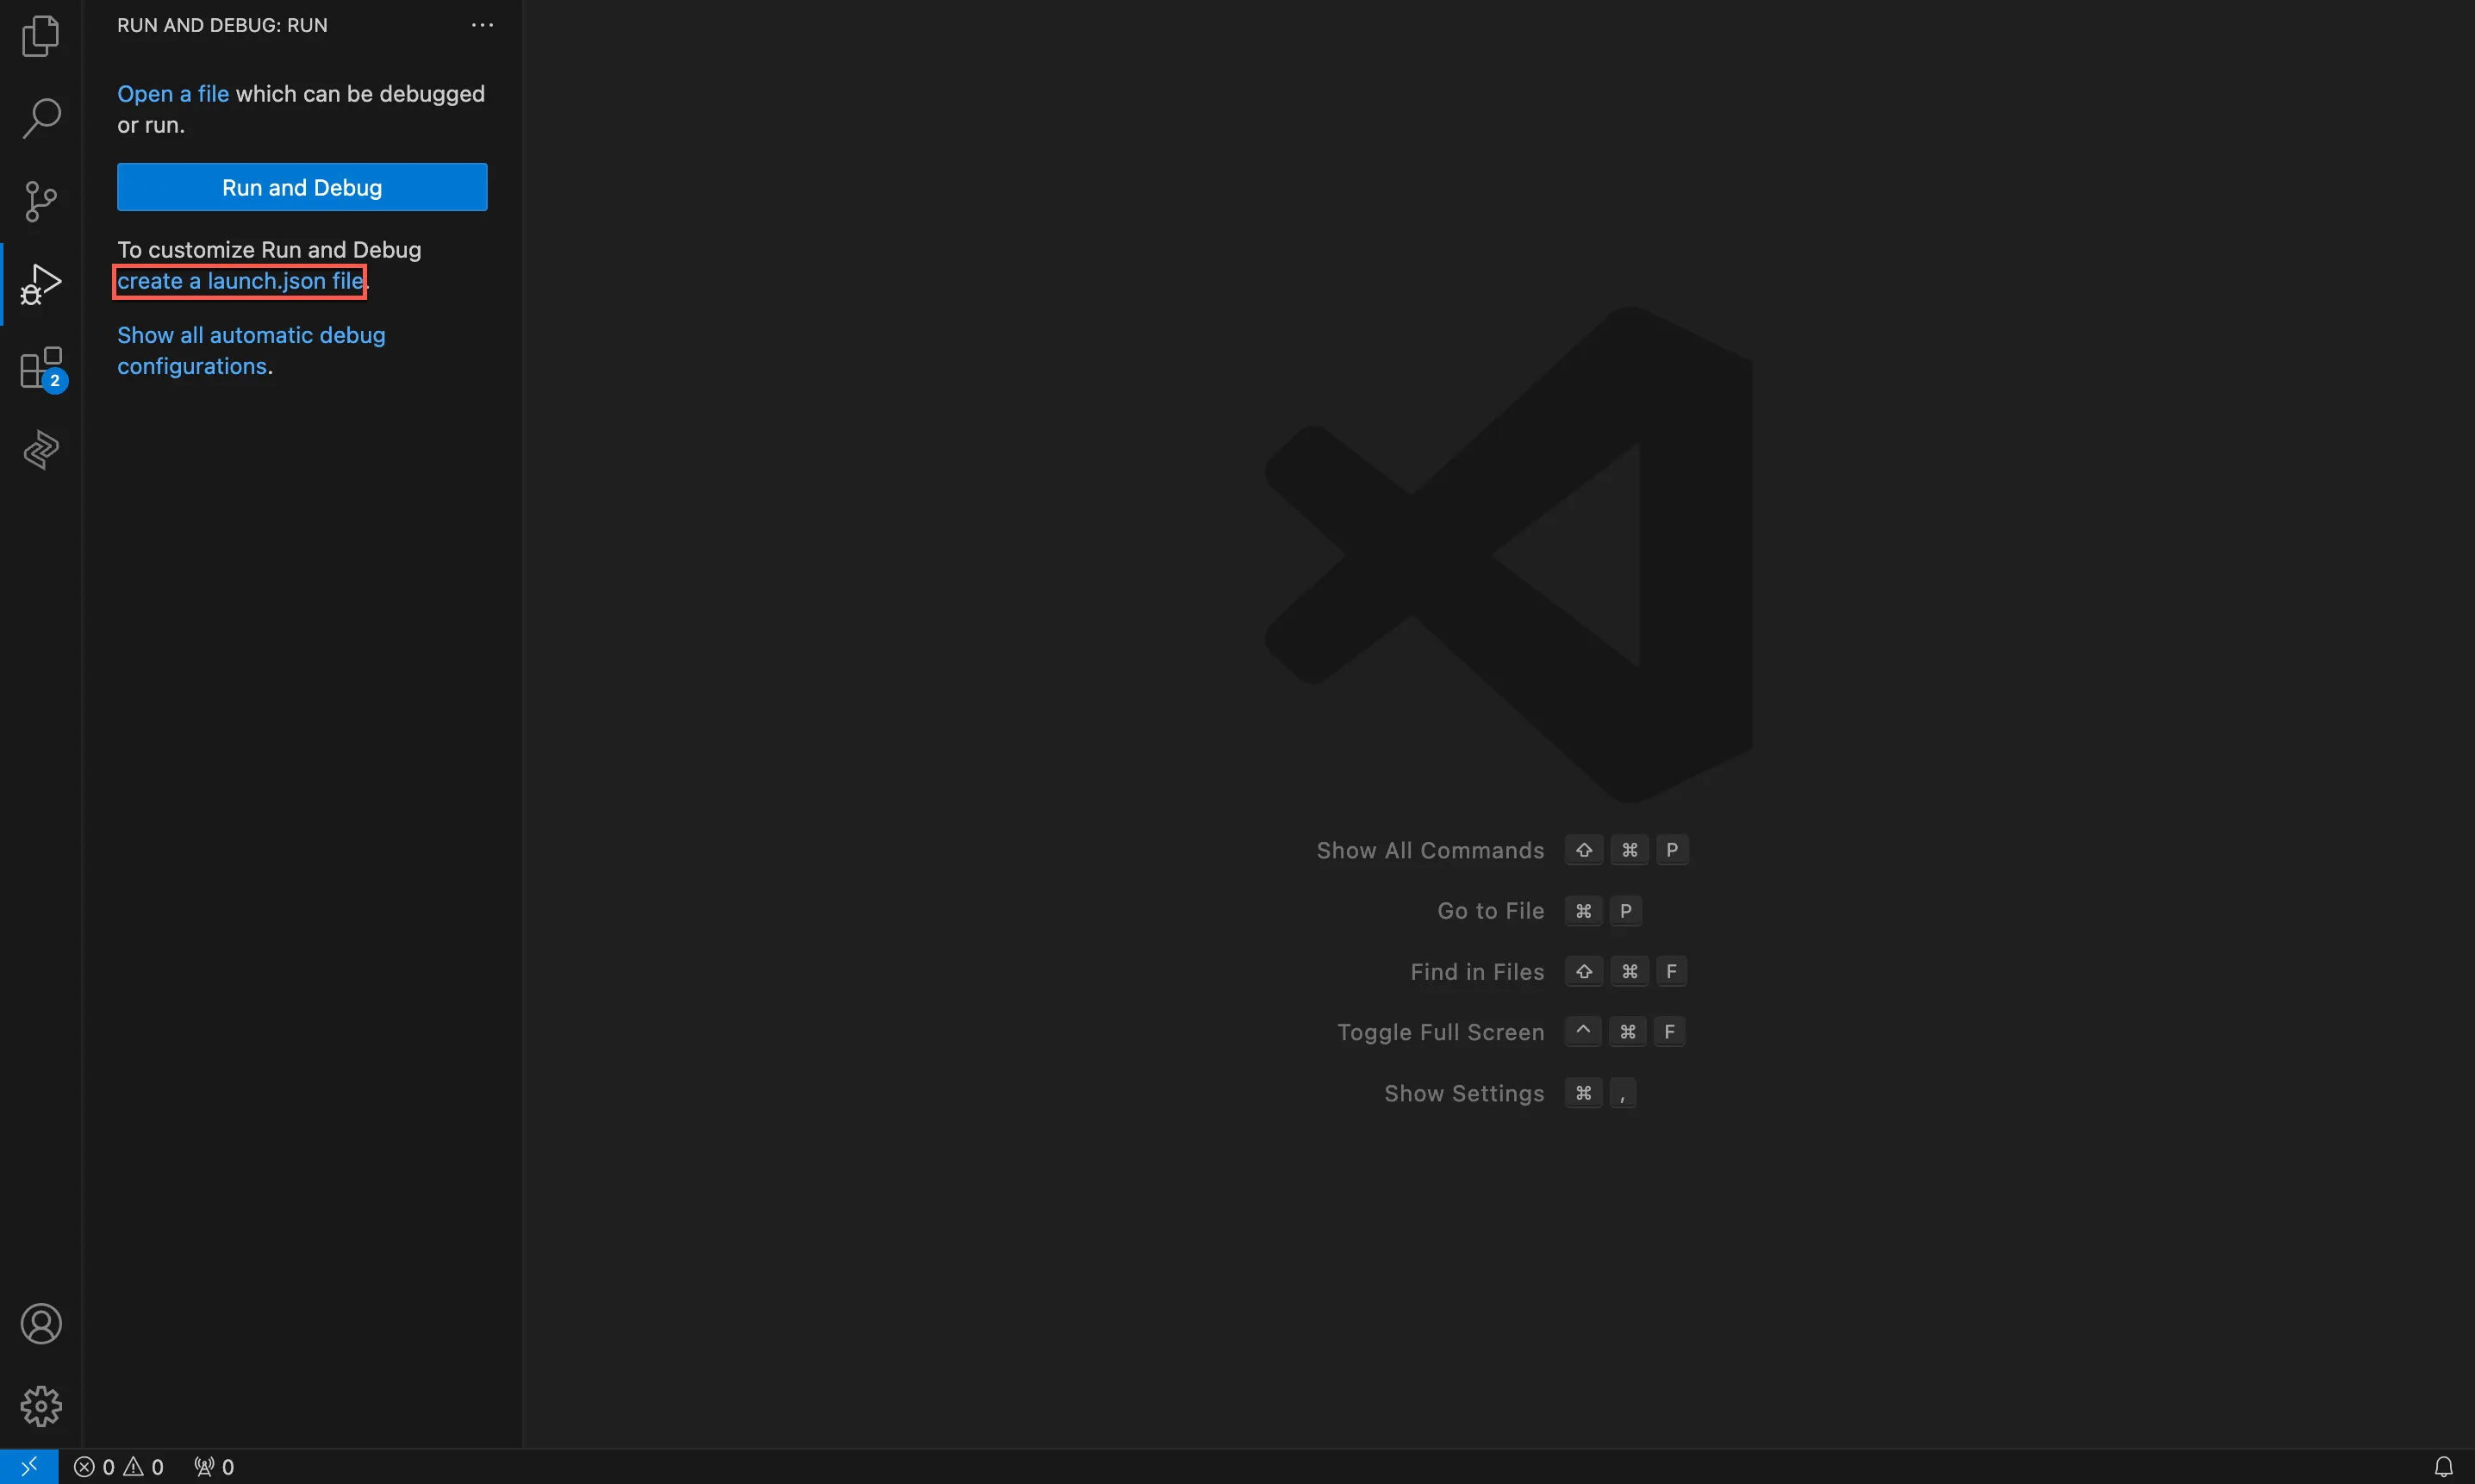
設定を開始する前のlaunch.jsonファイルの表示は以下のとおりです。
- 以下のJSONスニペットをコピーし、「configurations」JSONキーの値として貼り付けます。
launch.json
copy
"configurations":[{
        "name": "Python: Current File",
        "type": "debugpy",
        "request": "attach",
        "connect": {
            "host": "127.0.0.1",
            "port": 9001 //the debug port number which you have specified in the catalyst functions:shell --tunnel 8001 --debug 9001.
        },
        "justMyCode": true
}],
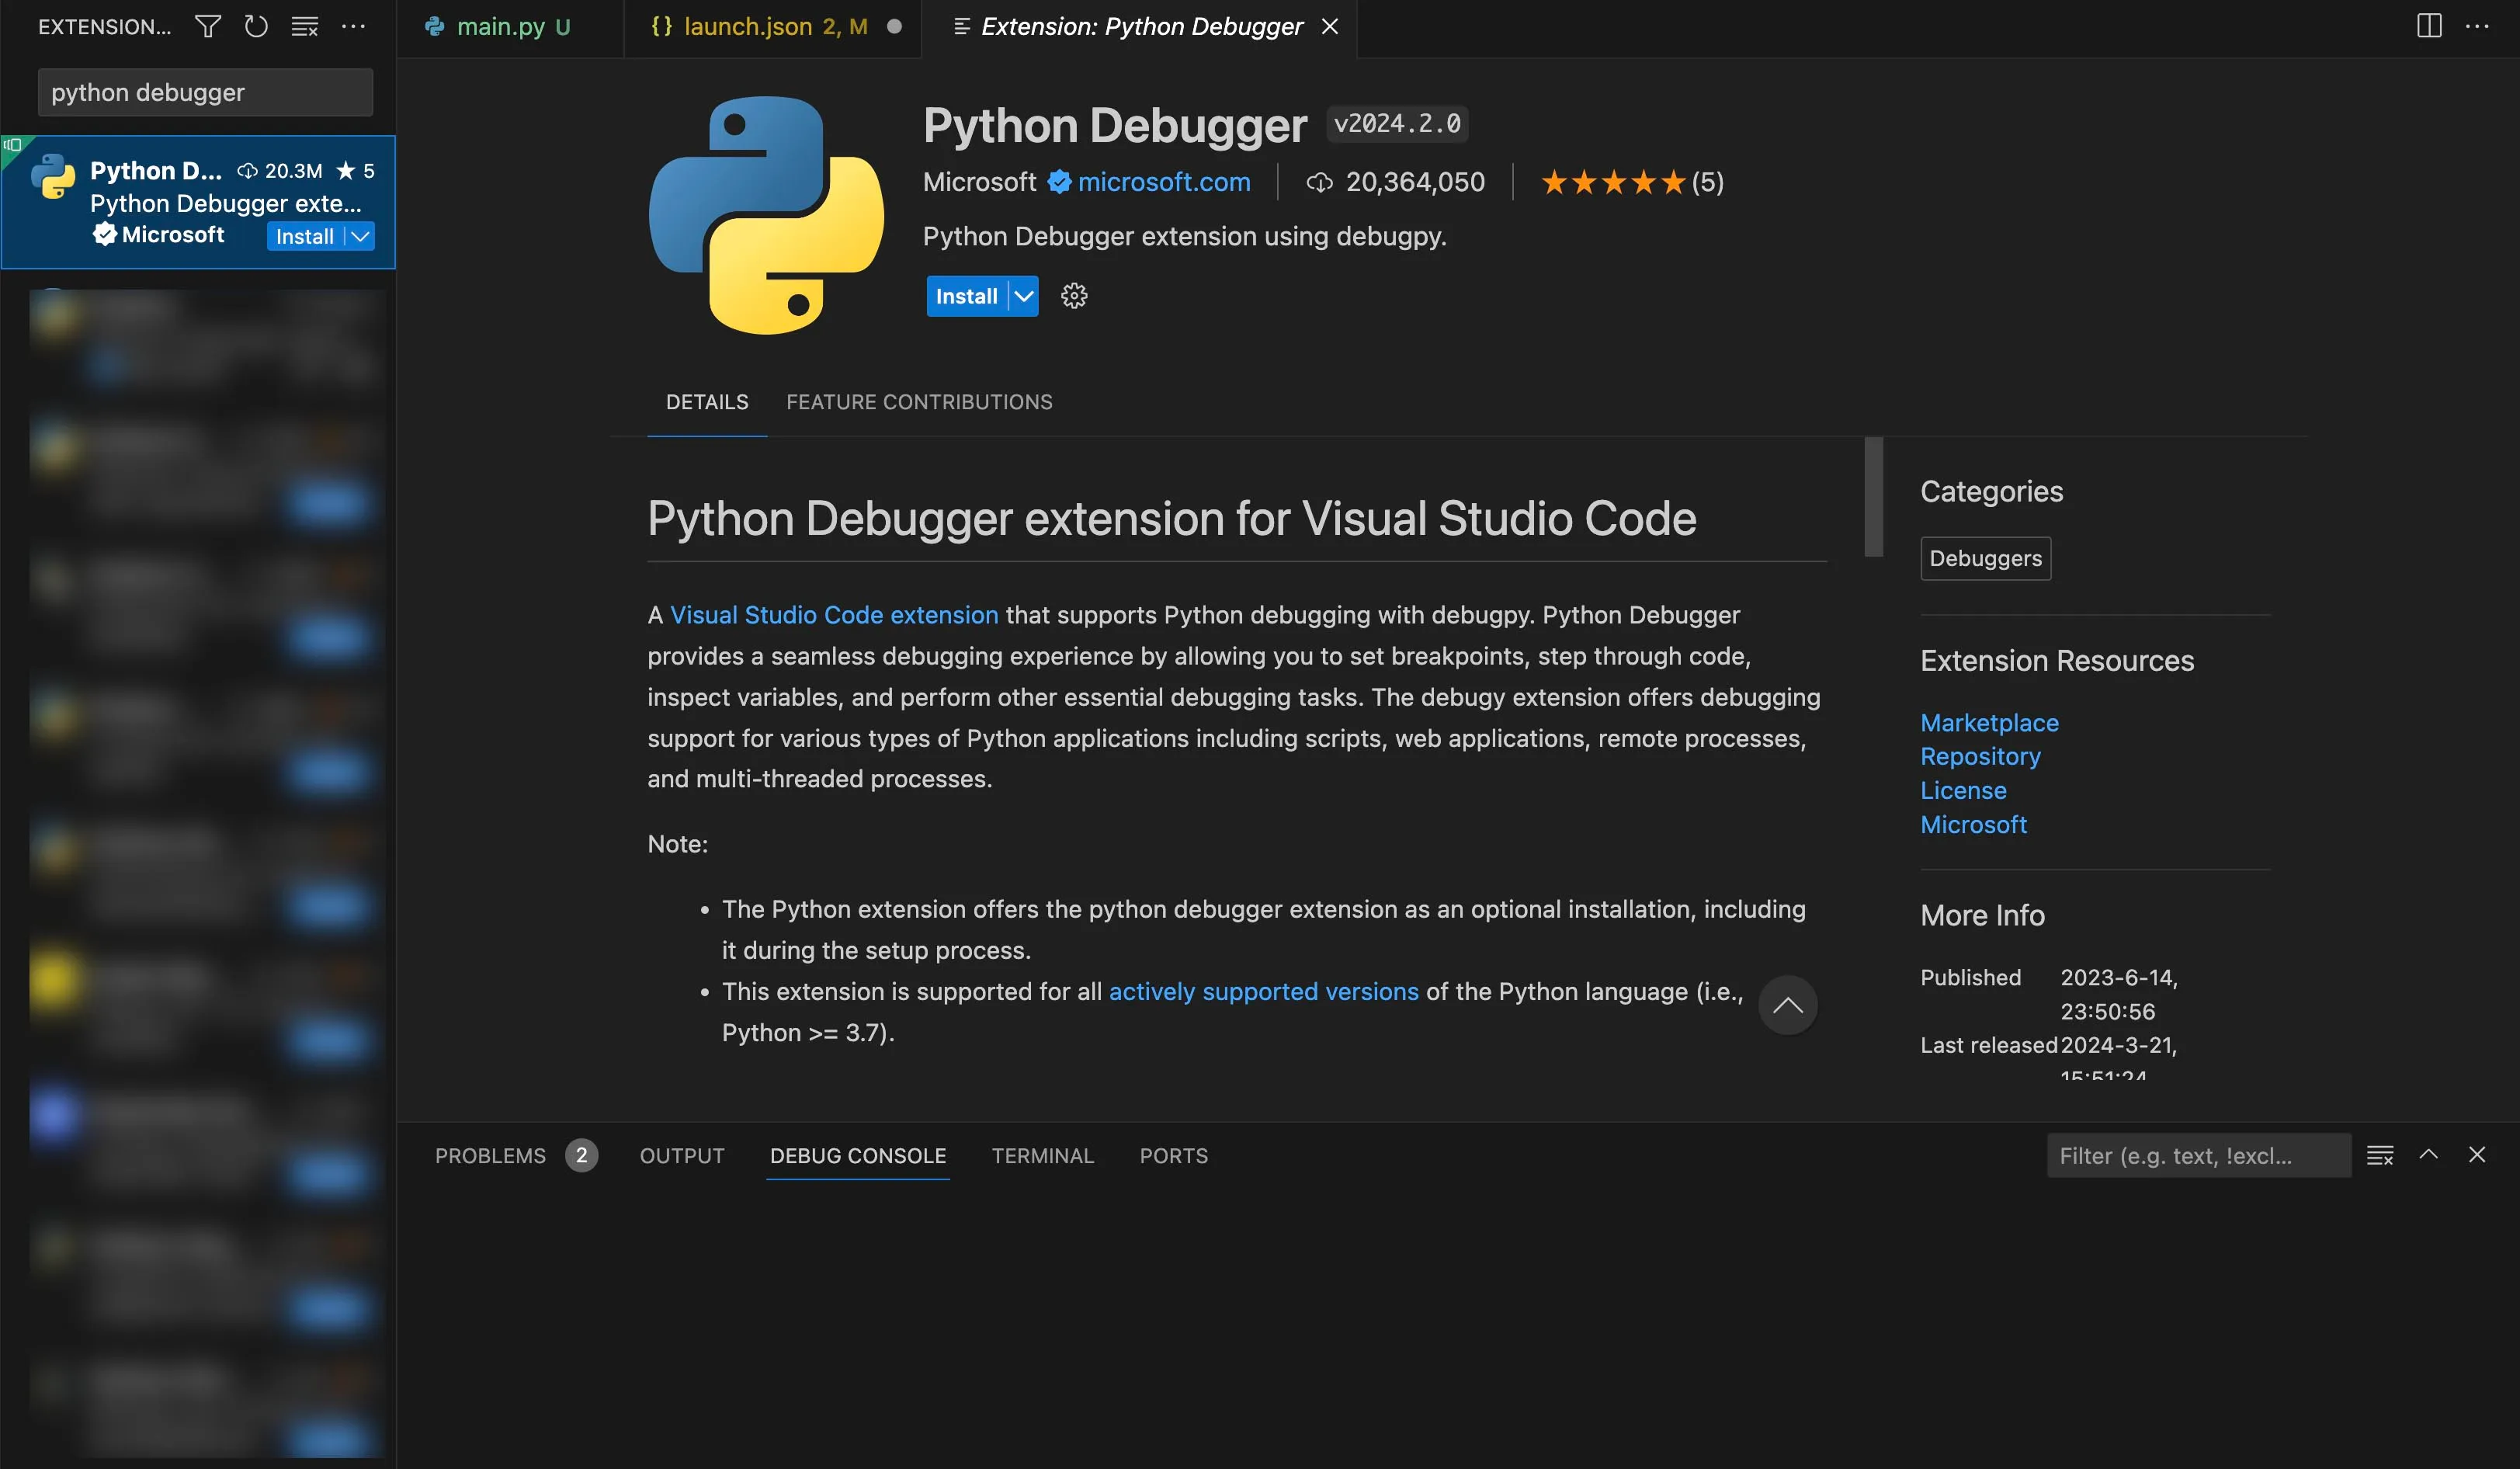
- Visual Studio Code IDEでPython関数をデバッグするために、Python Debugger VS Code拡張機能をインストールします。
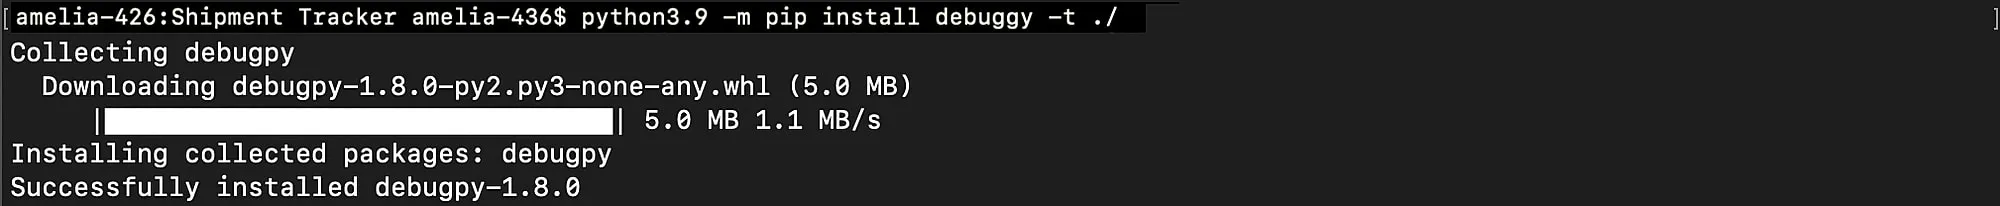
- 以下のコマンドを使用して、Python関数のソースディレクトリにdebugpyをインストールします:
copy
$
python3.9 -m pip install debugpy -t ./
- 以下のコード行をコピーし、関数コードの冒頭に貼り付けます:
code_file.py
copy
import debugpy
  debugpy.listen(9001) #specify the port for debugging
    print("Waiting for debugger to attach")
    debugpy.wait_for_client()
    print("debugger attached")
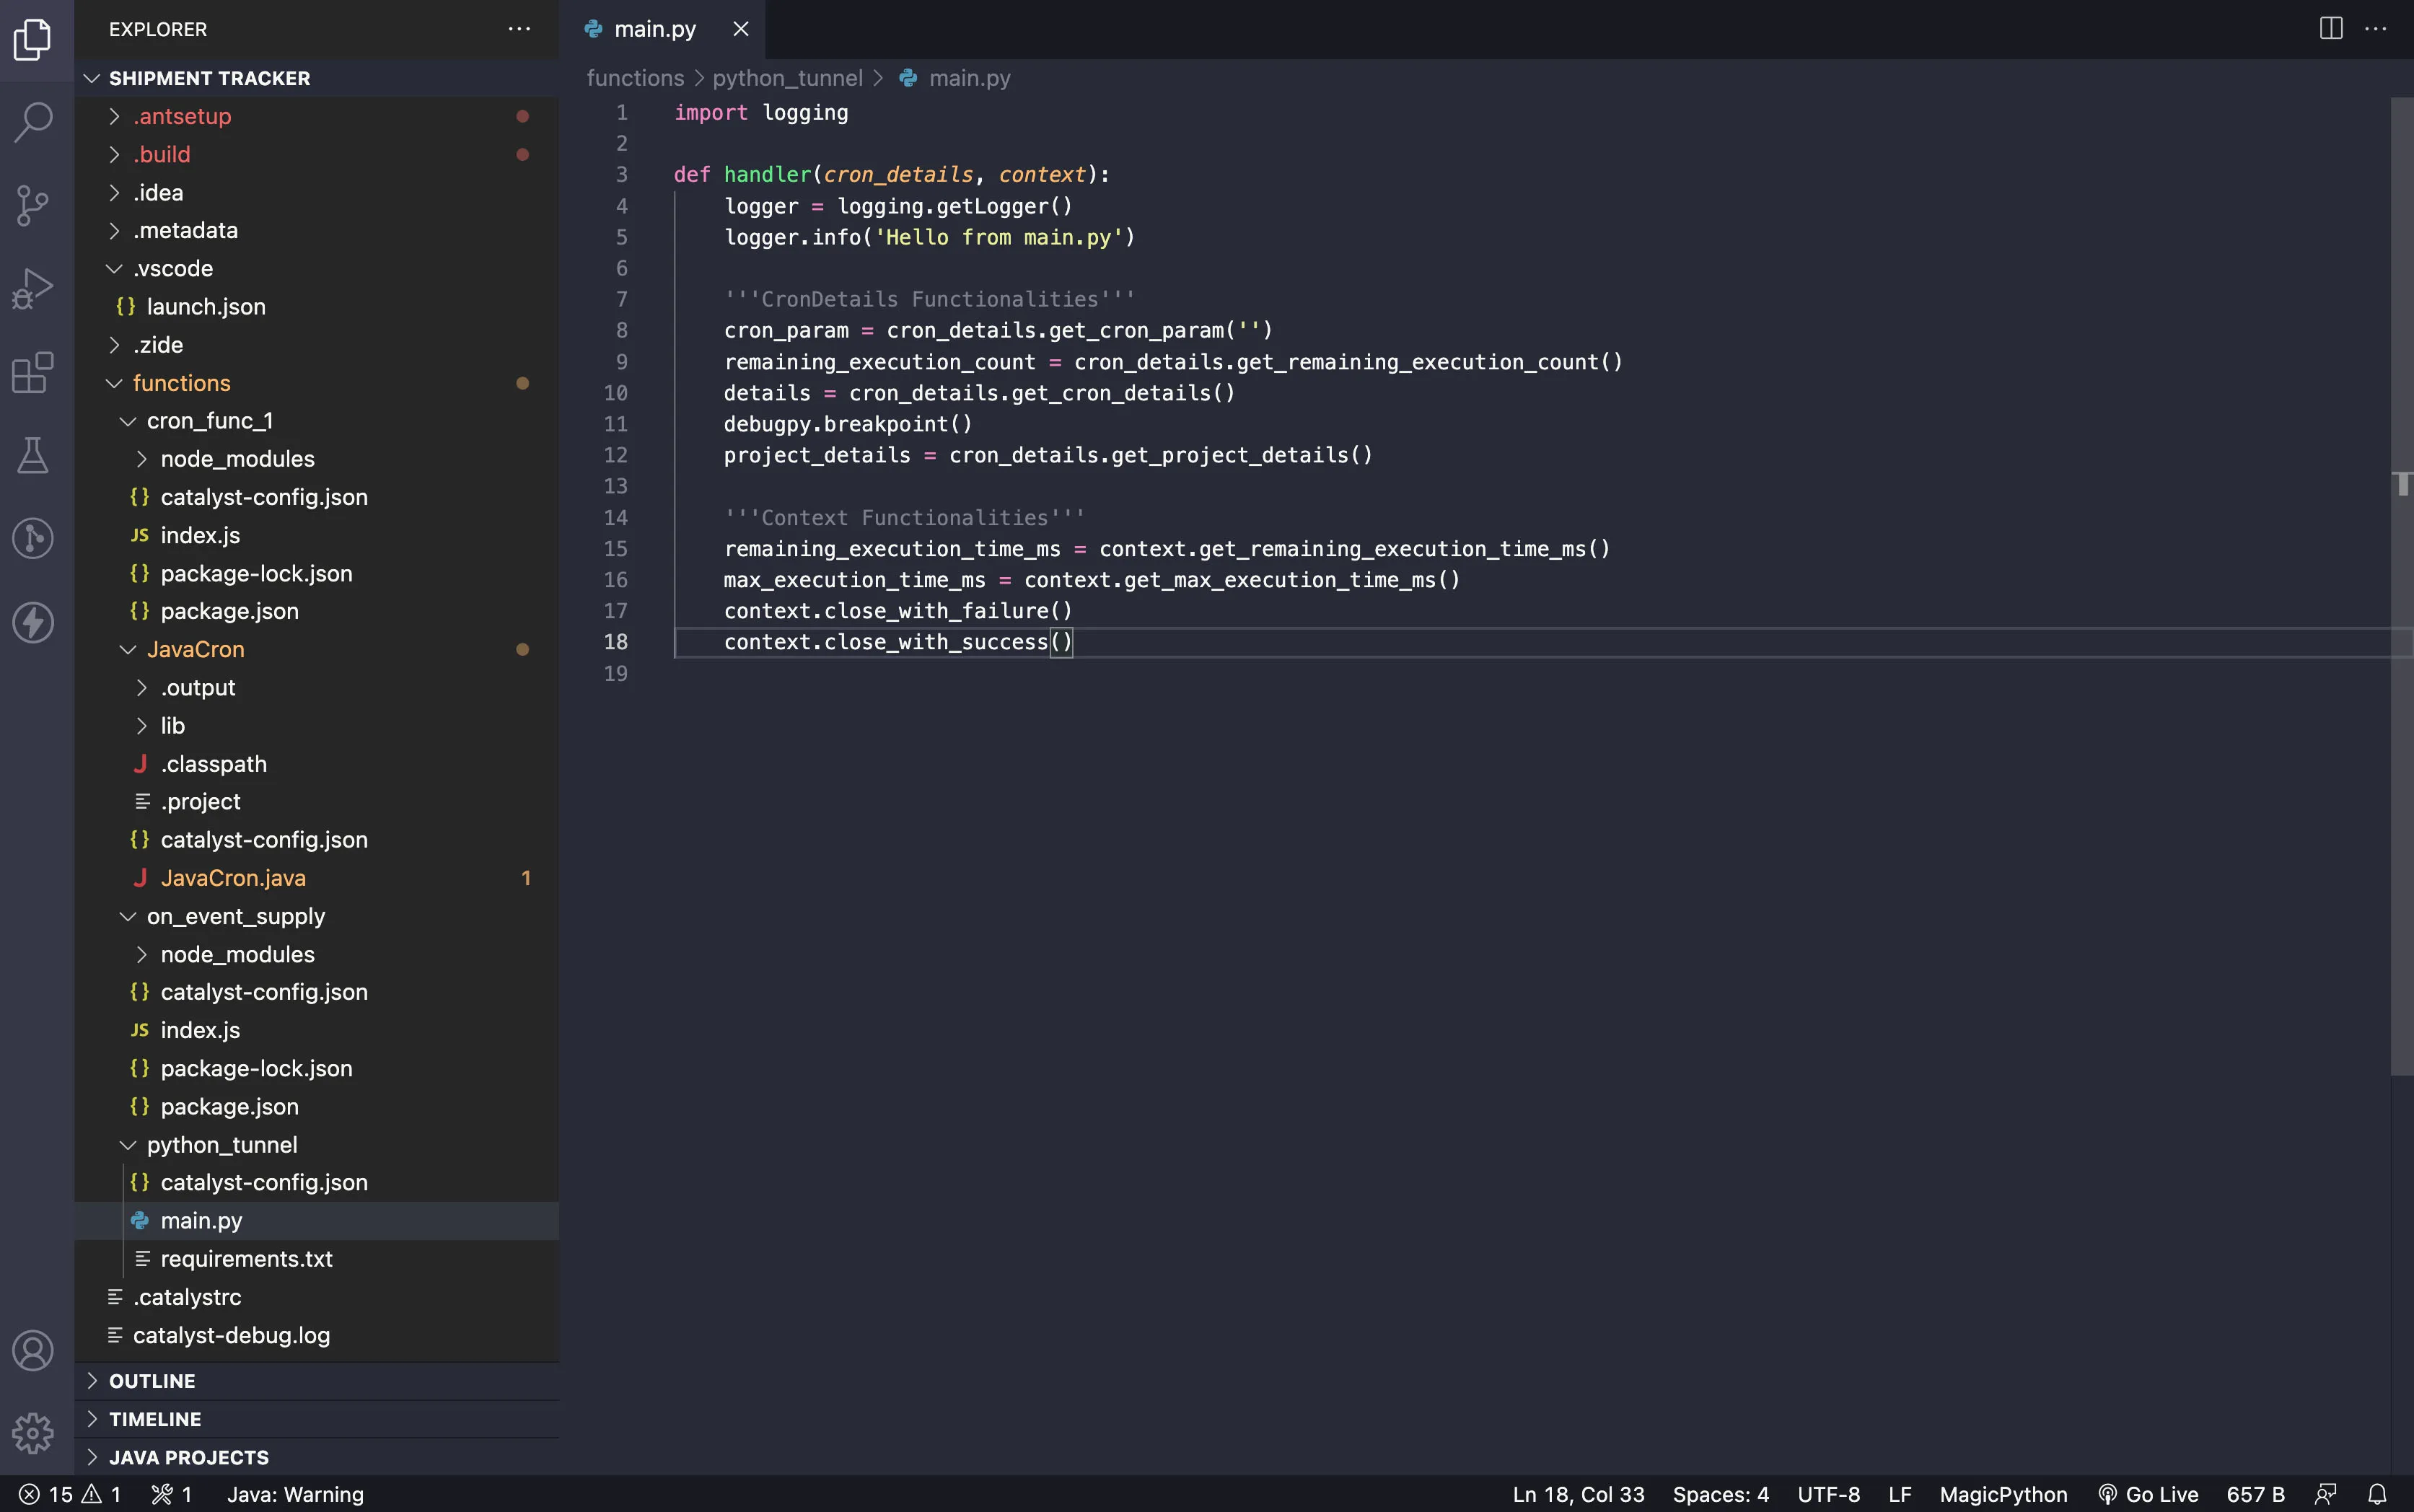
- メインのPythonコードファイルの任意の場所でdebugpy.breakpoint()関数を使用してブレークポイントを設定します。

最終更新日 2026-02-23 18:09:41 +0530 IST
Yes
No
Send your feedback to us
Skip
Submit