Pipeline Execution Metrics
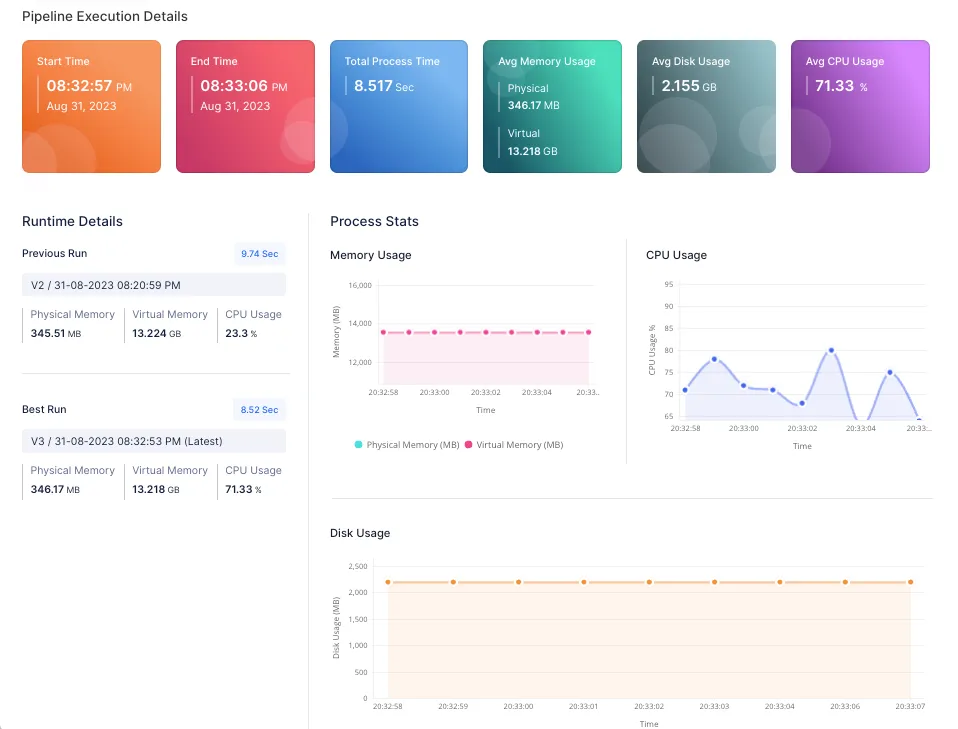
Once any pipeline is published, it gets scheduled for execution in an independent environment. The pipeline executions will be versioned for subsequent executions and the execution details will be monitored and gathered by QuickML service. These execution details can be viewed from the Pipeline Metrics viewer integrated in QuickML. These metrics will help in finding the performance and resource usage of the pipeline execution and will be beneficial for improving and continuous development of pipelines with respect to ML pipelines.
The metrics viewer can be used to view the information of full pipeline execution and stage execution. The metrics listed below will be available for monitoring:
- Pipeline Execution Information
- Execution time
- Average memory usage
- Average Disk Usage
- Average CPU usage
- Runtime details
- Best Pipeline run
- Previous Pipeline run
- Resource usage charts
Pipeline Execution Information
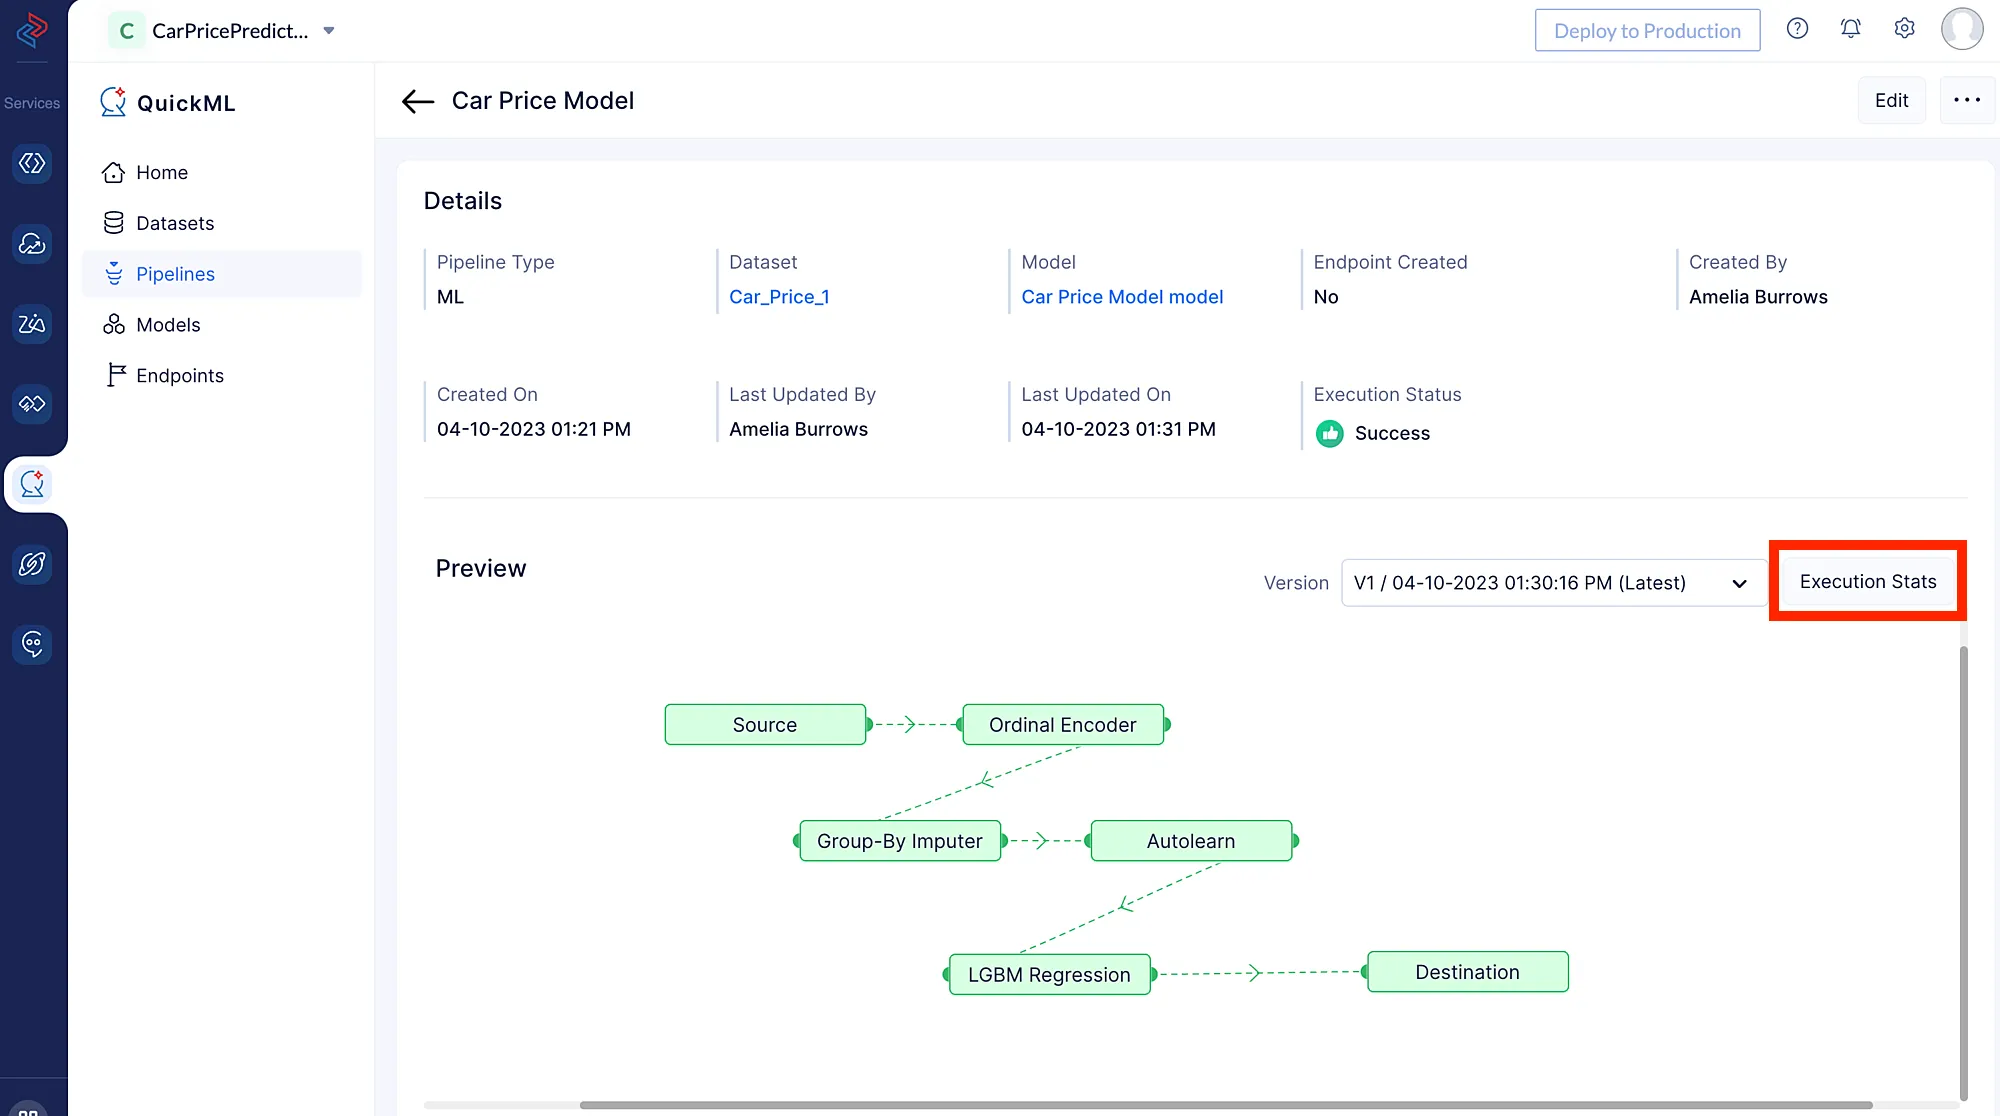
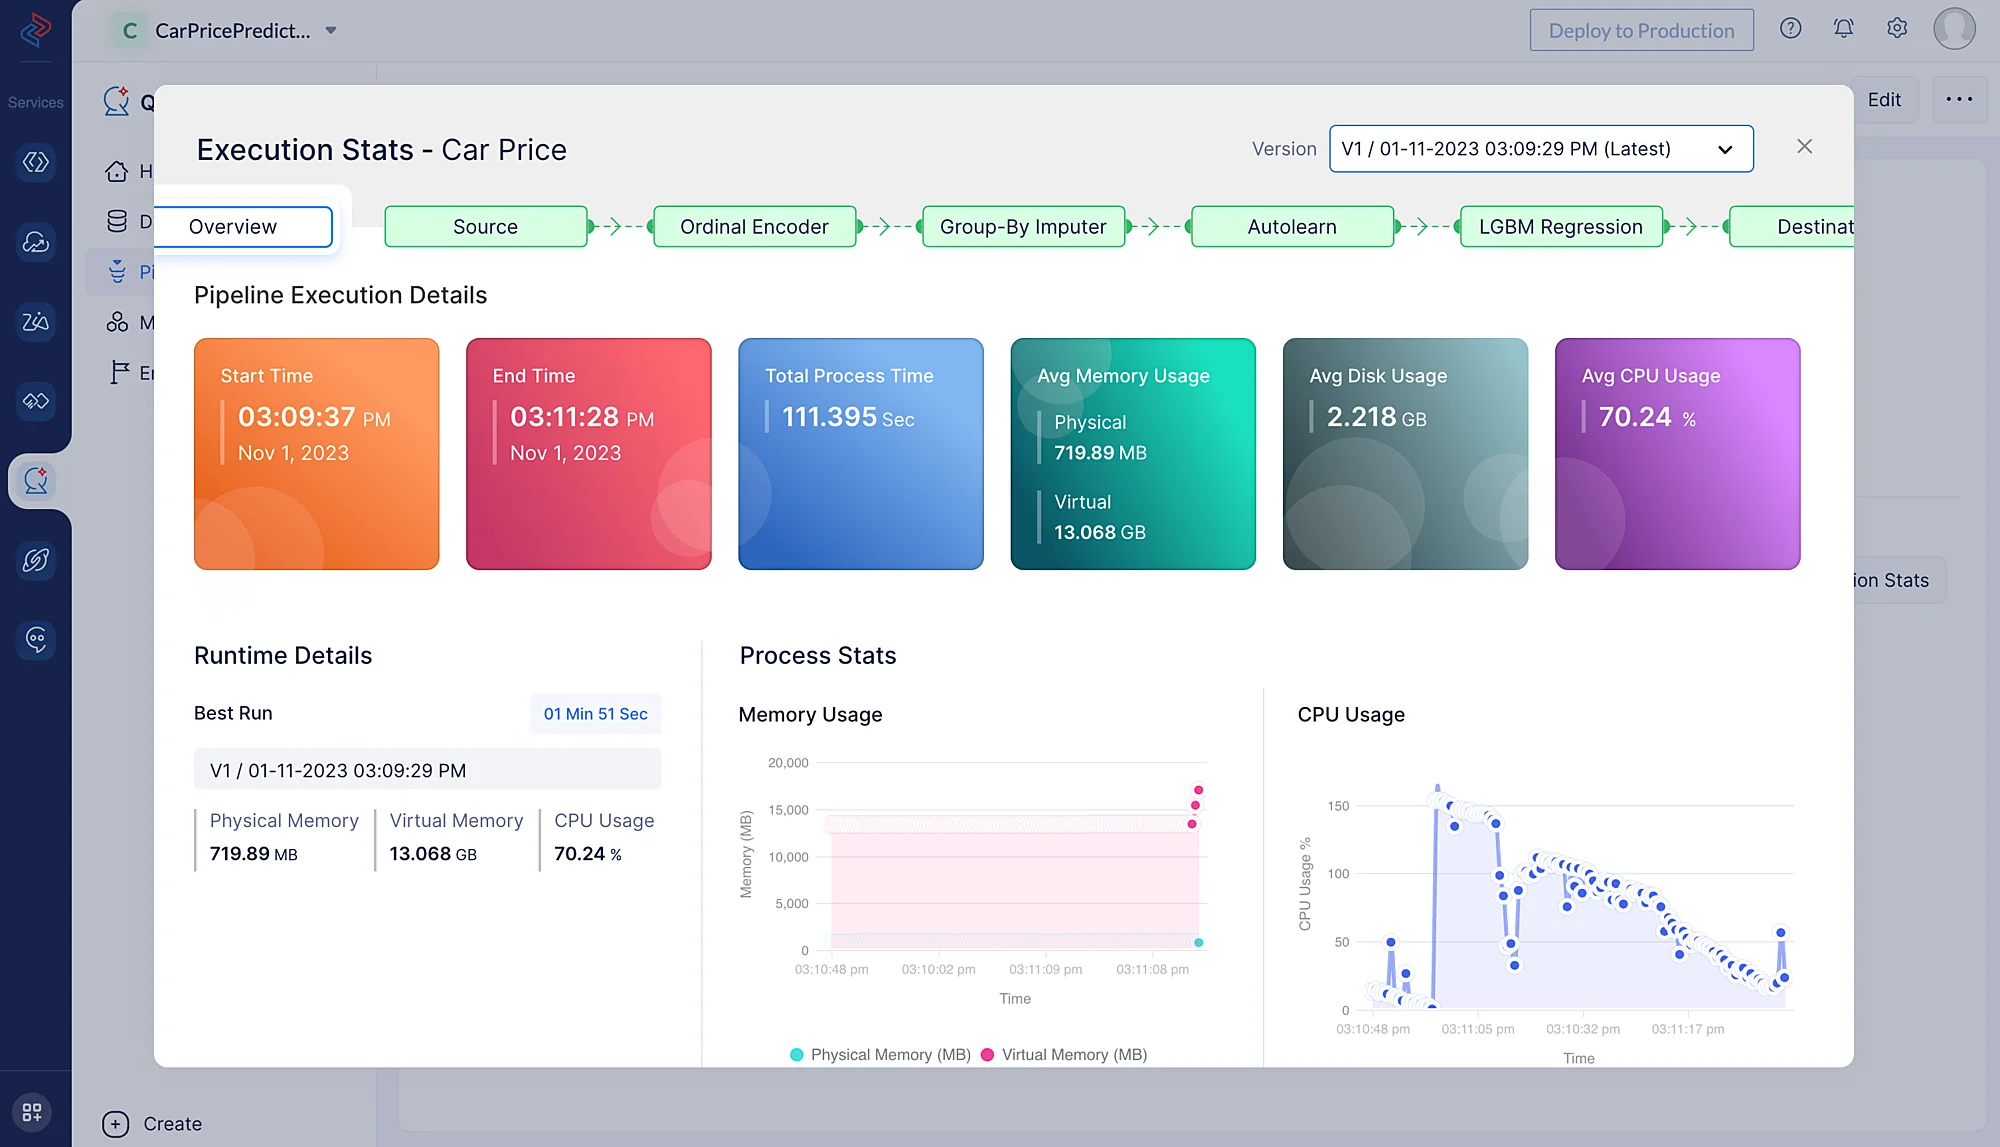
From the pipeline details page, the execution info window can be opened and it will contain the respective execution information like below.
Resource usage graphs
To keep track of time-based resource usage in pipeline execution, status charts and graphs are available in QuickML to get better understanding of the stage-wise execution and its details. These charts can also be zoomed in to chart based editors to have further analysis of the execution.

Last Updated 2025-02-19 15:51:40 +0530 IST
Yes
No
Send your feedback to us

