QuickML Pipeline Endpoints
Endpoints
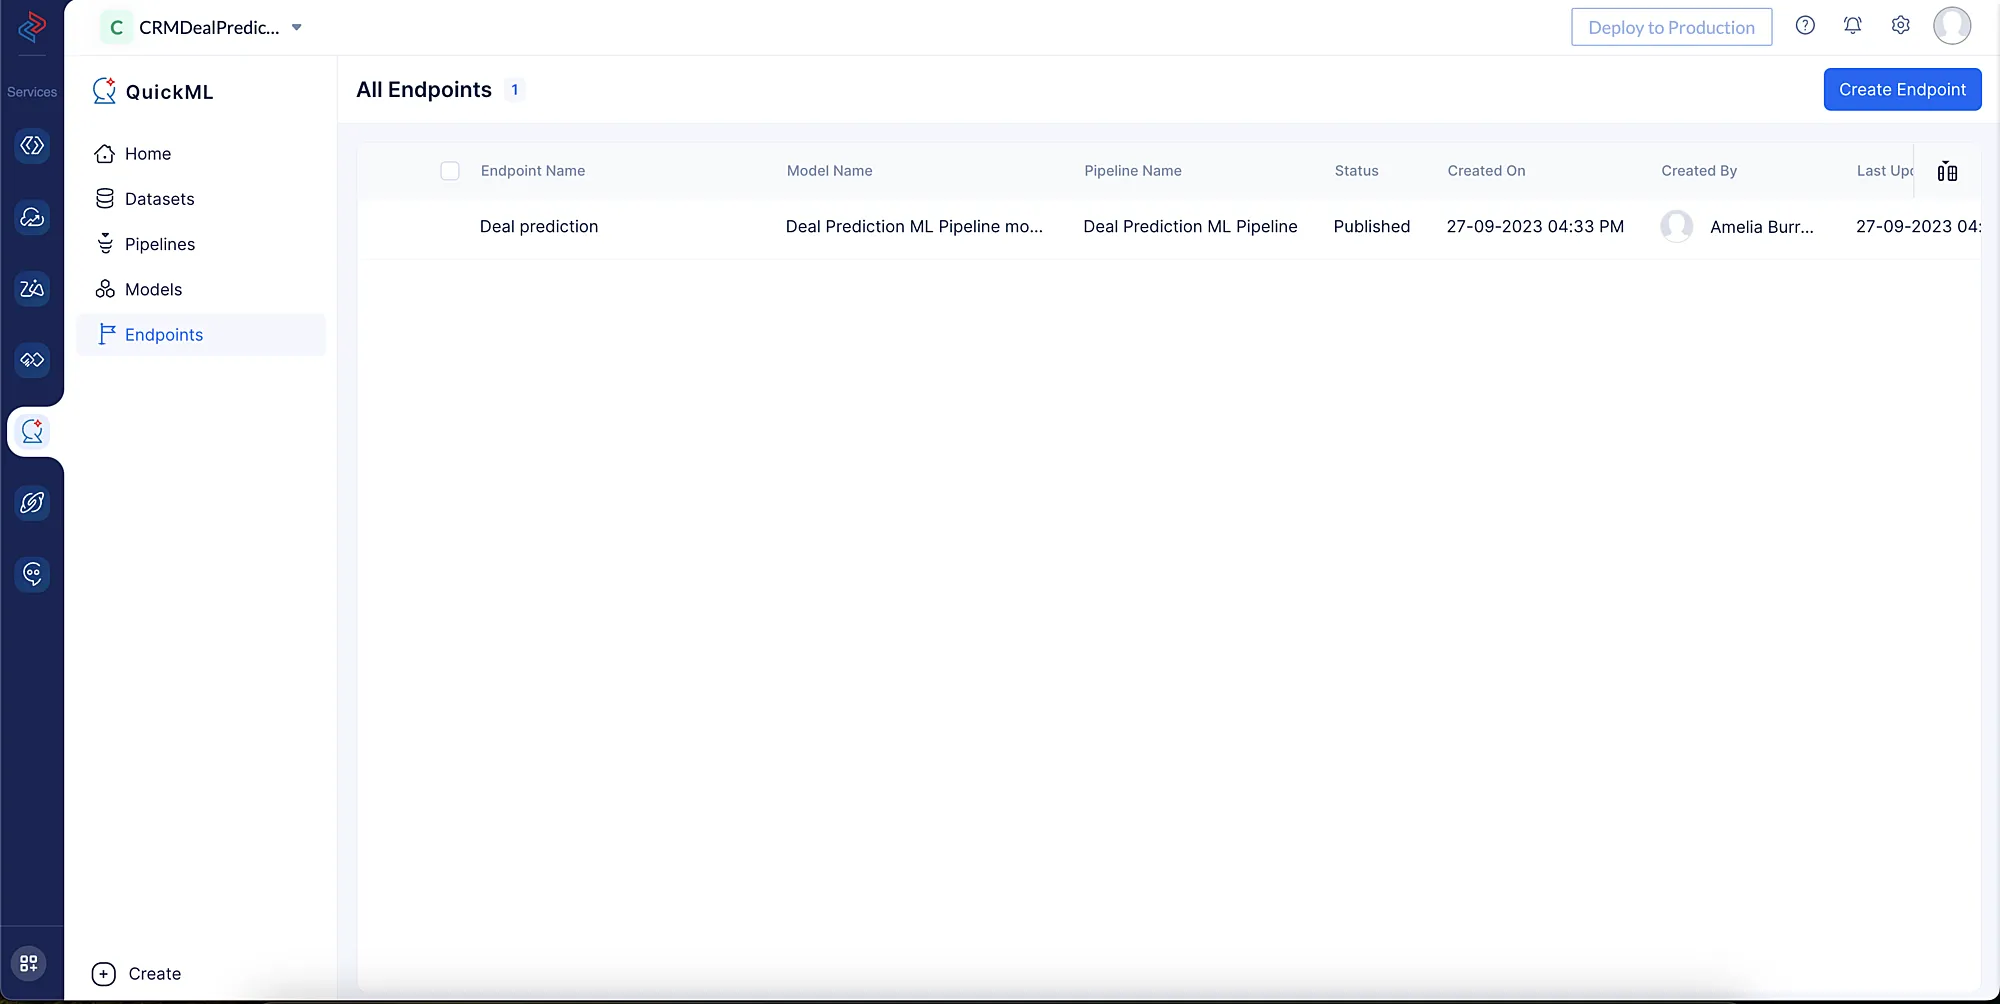
The primary outcome of machine learning (ML) pipelines is to create endpoints that can be used to make predictions on new data. These endpoints are created using trained ML models, and they can be used for continuous inference.
Once an ML model is developed and trained, QuickML users can create an endpoint with the latest version of the model. This endpoint can then be used to make predictions on new data. QuickML monitors all endpoints to identify areas where the model can be improved.
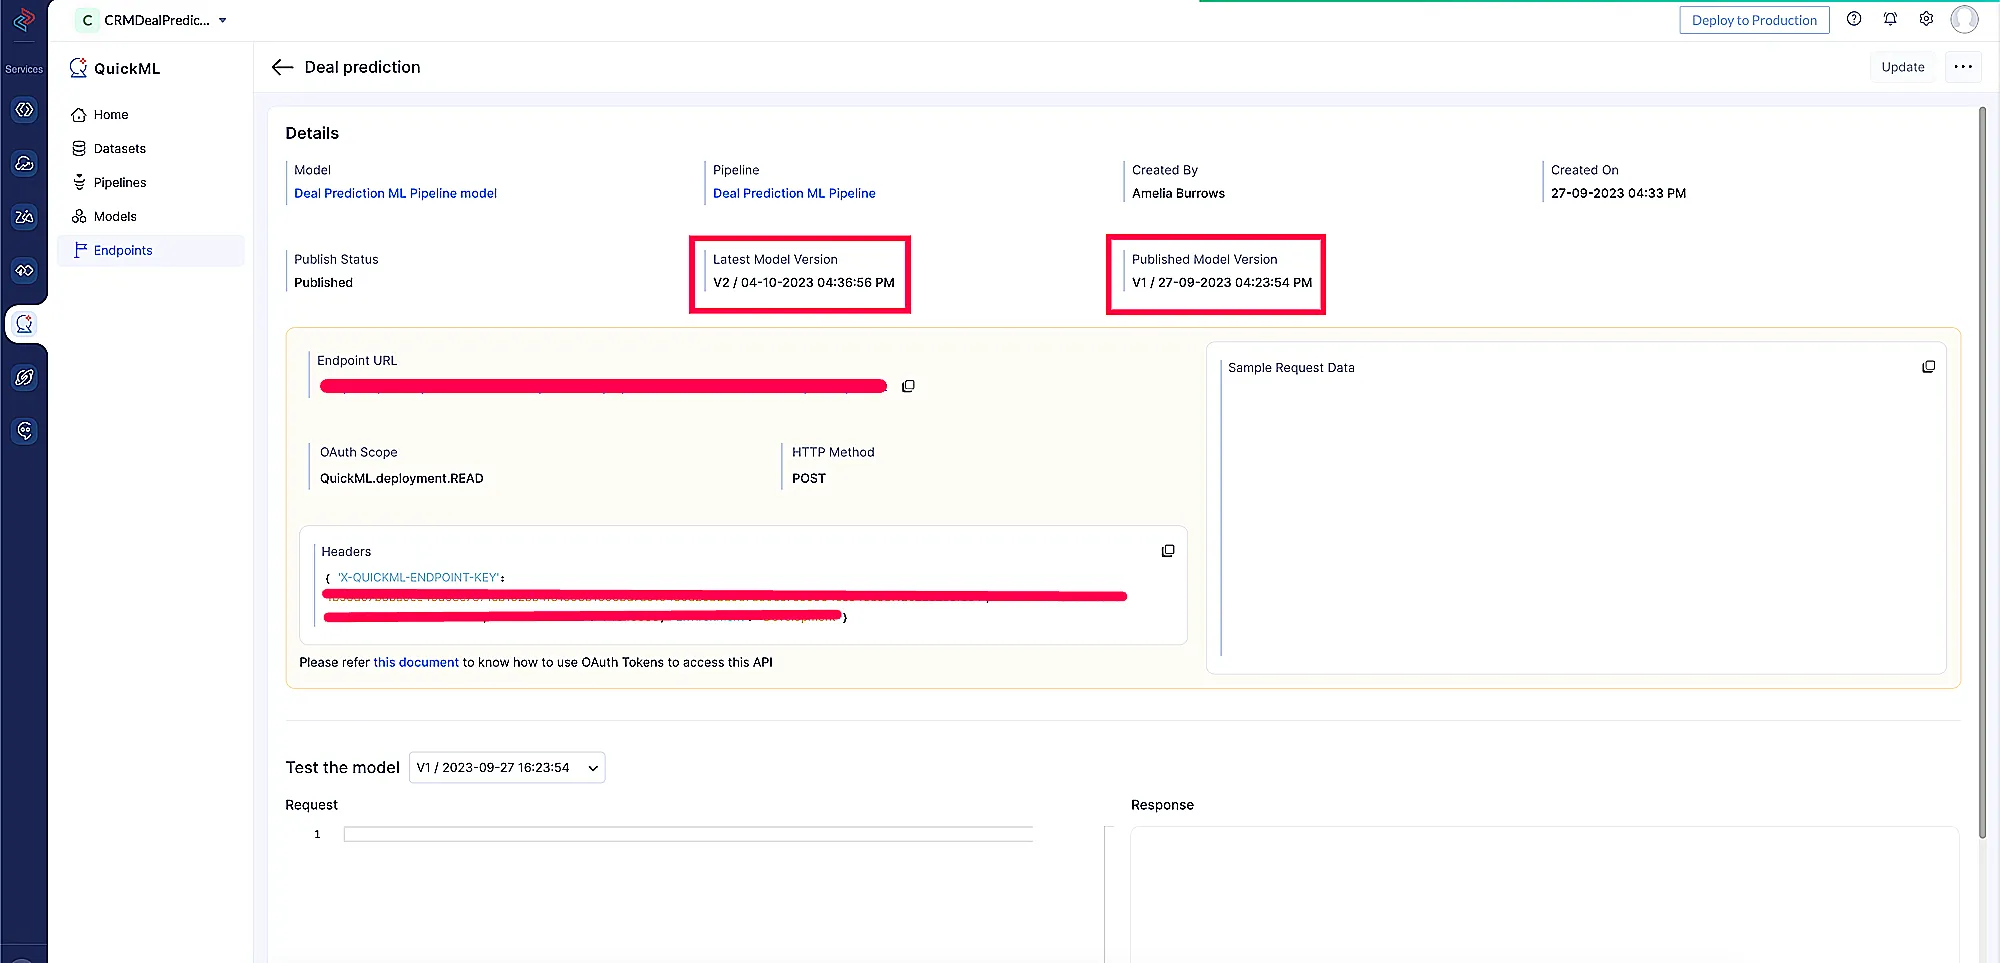
Published Model Version
Once a machine learning model has been generated using the QuickML pipeline, a user can choose to publish it as an endpoint with a specific model version. This allows users to deploy and use the model to make accurate predictions.
Models are versioned whenever there is change in pipeline stage configurations for the pipeline execution.
Model tester
In order to check the accuracy of the model, a Test the Model component w.r t model versions has been integrated in QuickML endpoints module, in which live requests can be made within the web app using Endpoint URL to test the model’s inference.
Model Explanation Chart
Each input feature in the data used for training the machine learning model has an impact on the model’s predictions. However, these models exhibit the black box behaviour, making it harder to understand how it arrived at those predictions. Quantifying the contribution of each feature to the final prediction is challenging, which hinders our understanding of the model’s behavior.
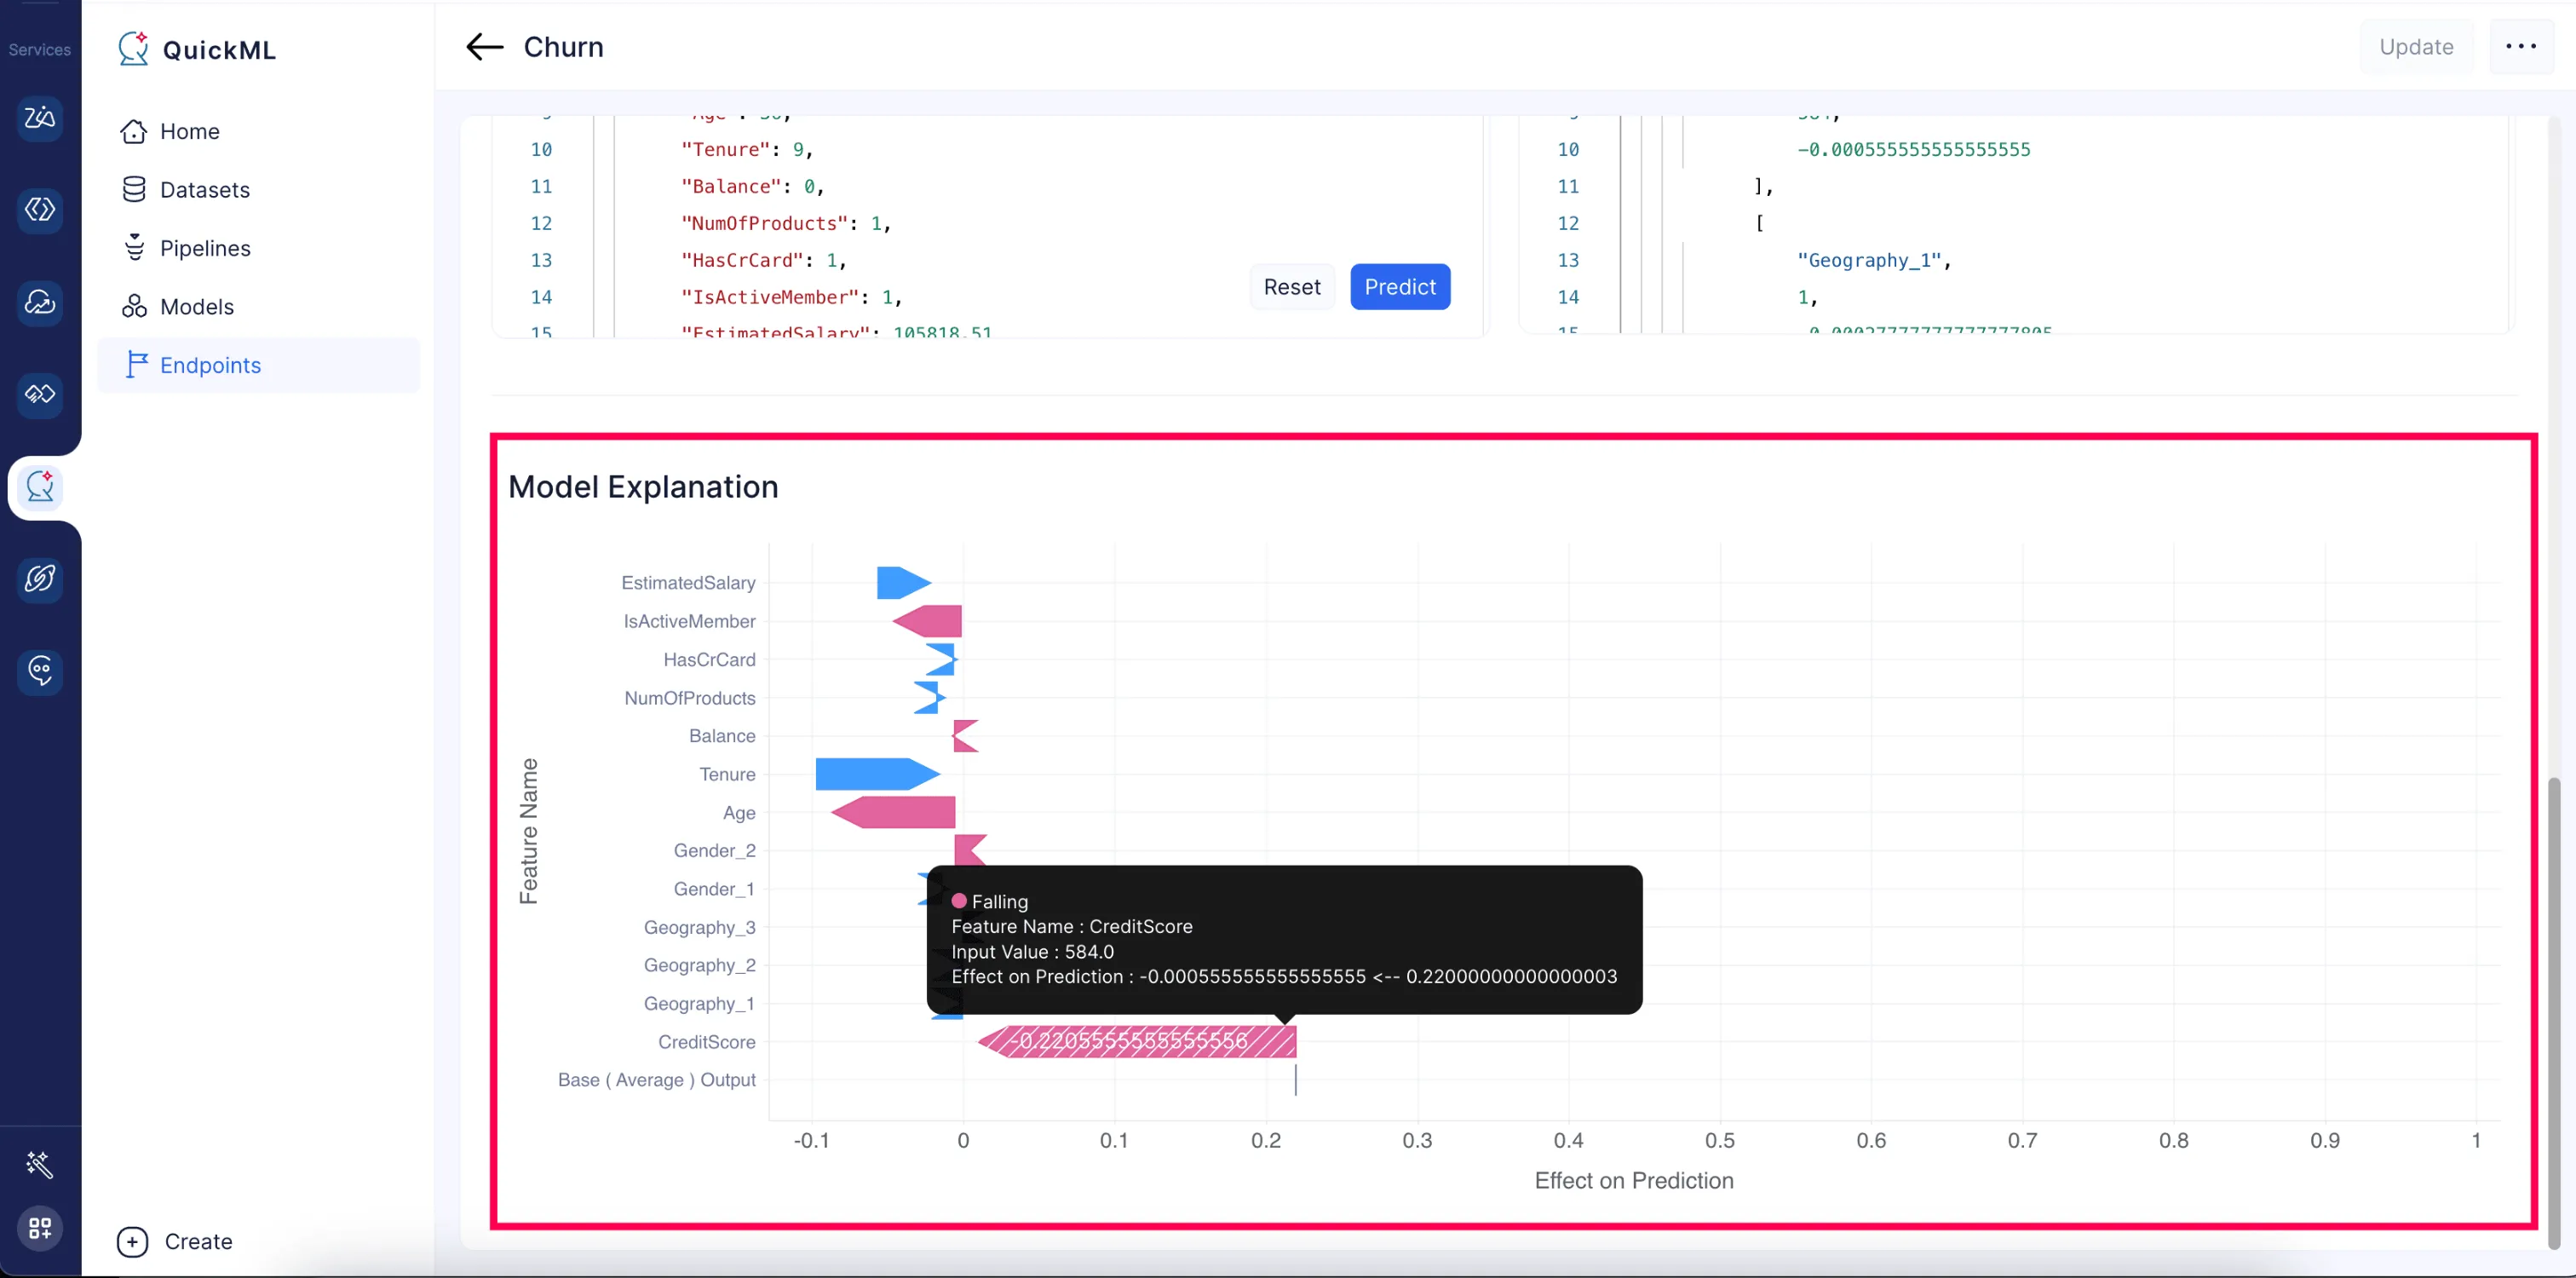
To address this issue, QuickML has created a Model Explanation Chart. This chart shows the effect on prediction on the x-axis and the list of features on the y-axis.
For each feature, the effect on prediction is quantified by SHAP (SHapley Additive exPlanations) values, which explains the decision of the machine learning model. These values help to understand and interpret the model’s decisions and increase transparency. The distribution of values on the x-axis indicates whether the respective feature has a positive or negative impact on the prediction, along with its score.
This chart is located on the endpoint details page, as shown below.

In summary, the Model Explanation Chart in QuickML shows the influence of each feature on the final prediction result for a given input.
Quick ref video on model explanation chart view.
A quick overview of the model explanation chart located in the endpoint details page shows the impact score of each feature on the prediction in the response box and visual representation of the impact in the chart above.
Endpoints Authentication
The live endpoints are exposed via REST APIs from QuickML service and they can be accessed with two modes:
- External OAuth2 authentication
- Internal authentication
External OAuth2 authentication
The endpoints that are exposed as REST APIs are authenticated with the Zoho accounts OAuth2 mechanism. Users can make the prediction calls externally by generating the tokens from the accounts console.
- Prediction guidelines: To make the REST API calls, the user should provide the below given details,
- Request URL: Deployment Url provided in details
- HTTP Method: POST
- Headers :
{
    'X-QUICKML-ENDPOINT-KEY' : ************************,
    'Authorization': 'Zoho-oauthtoken ',
    'CATALYST-ORG': ********
    'Environment': , 'Development/Production'
}
To generate an access token, please follow the steps in this document,
- Scope: QuickML.deployment.READ
Last Updated 2025-02-19 15:51:40 +0530 IST
Yes
No
Send your feedback to us


