Models
Once an ML pipeline is successfully executed, a respective ML model is created. This model view can be used to gain an understanding of its internal metrics.
The list of models created can be viewed on the Models page along with the status of each model as seen below.

Model Metrics
QuickML users will have the access to view the model metrics for each version, which provide valuable insights into the performance of the machine learning models. These metrics serve as essential indicators to assess the accuracy and effectiveness of the model in making predictions.
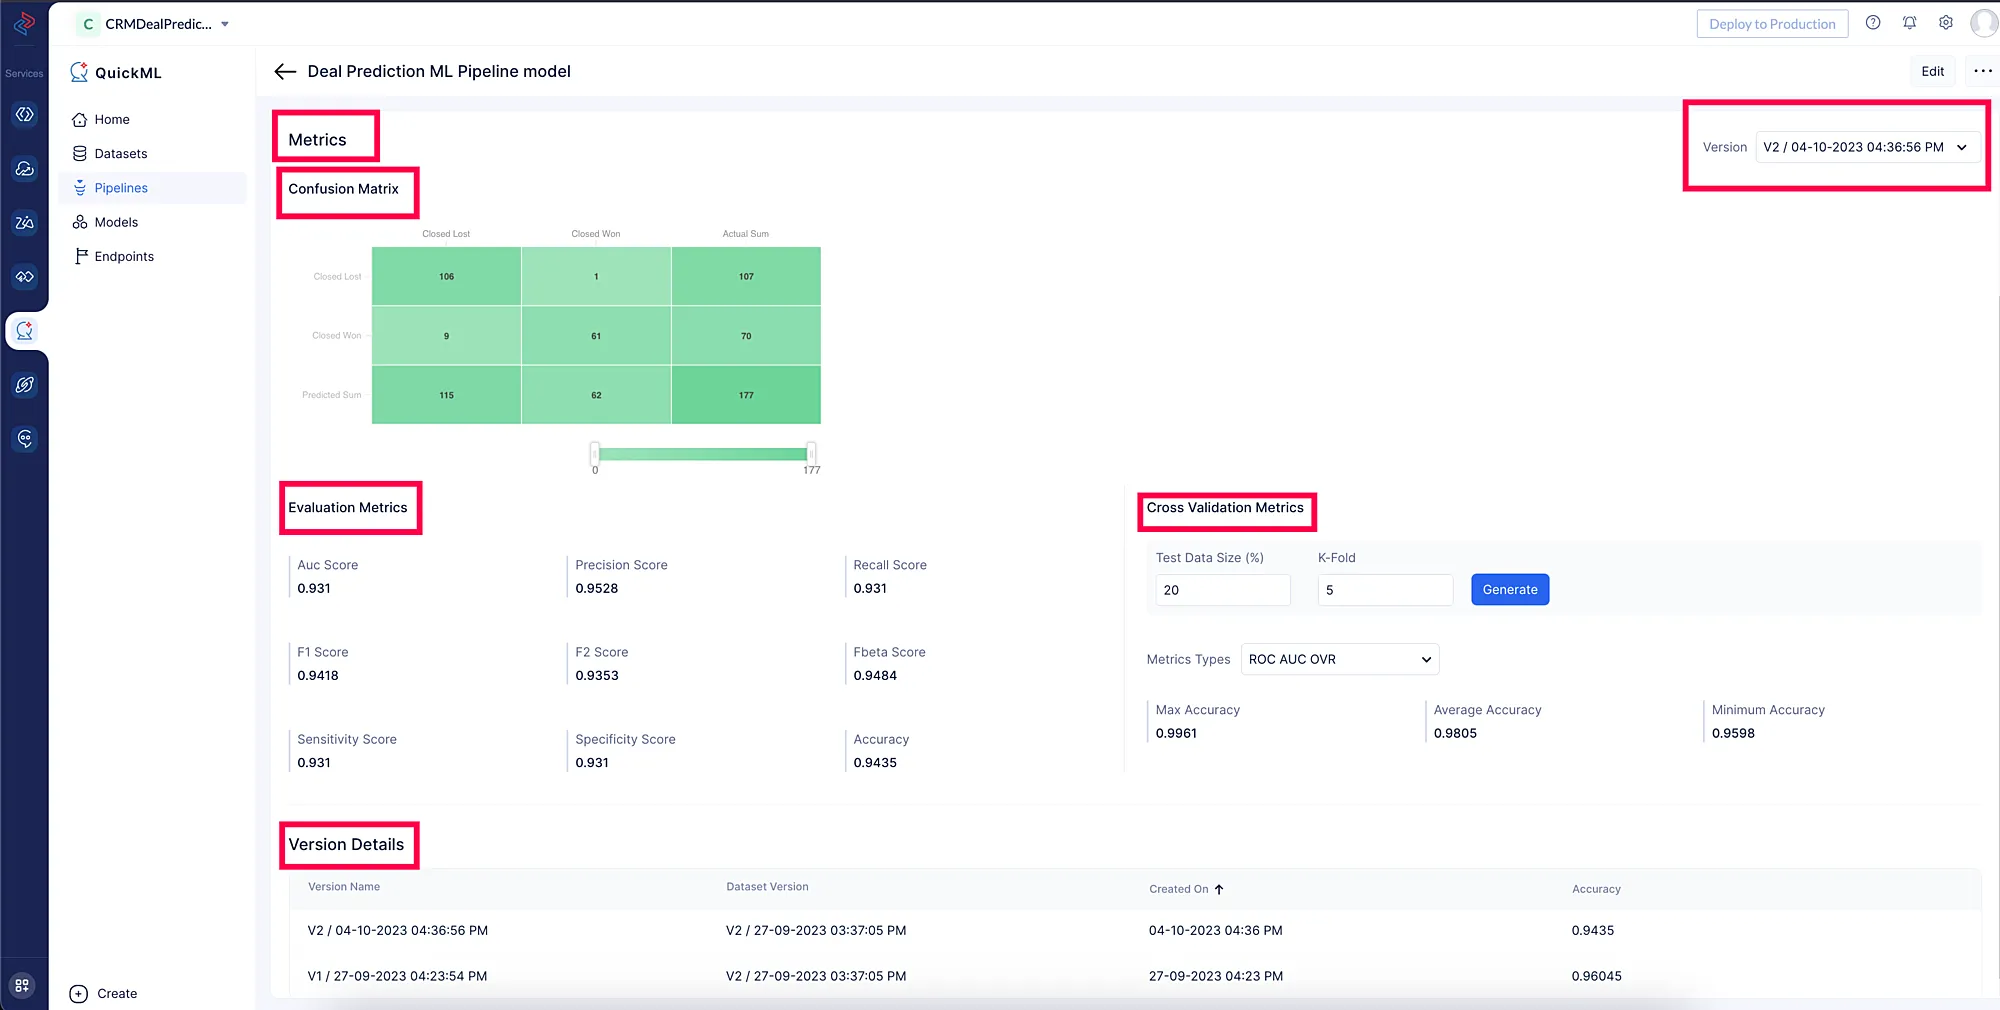
QuickML users have access to the following metrics.
Confusion matrix
In machine learning, a confusion matrix is used to measure the performance of a classification model. In simple terms, a confusion matrix is a summary of the number of correct and incorrect predictions made by the machine learning model. The matrix displays the number of true positives (TP), true negatives (TN), false positives (FP), and false negatives (FN) as shown below.
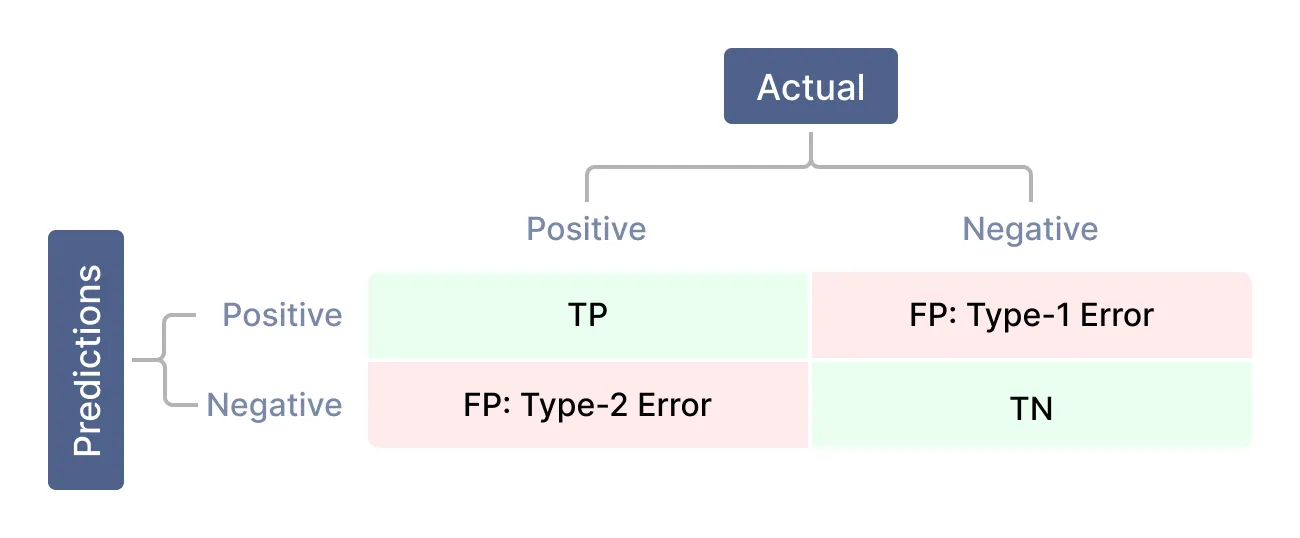
TP: True Positive is the count of instances where both predicted and actual values are positive.
TN: True Negative is the count of instances where both predicted and actual values are negative.
FP: False Positive is the count of instances where the model predicted them as positive but the actual values are negative.
FN: False negative is the count of instances where the model predicted them as negative but the actual values are positive.
Usecase
Let’s explain the confusion matrix with a use case: to predict airline’s passenger satisfaction with flight service.
Brief explanation: An airline gathers information about its passengers, including their demographics, flight information, and survey responses regarding their satisfaction with the airline’s service. After that, the airline applies this information to create a machine learning classification model that predicts whether the passenger is satisfied or neutral/dissatisfied.
Let’s evaluate the performance of a classification model using a confusion matrix in QuickML as shown below:
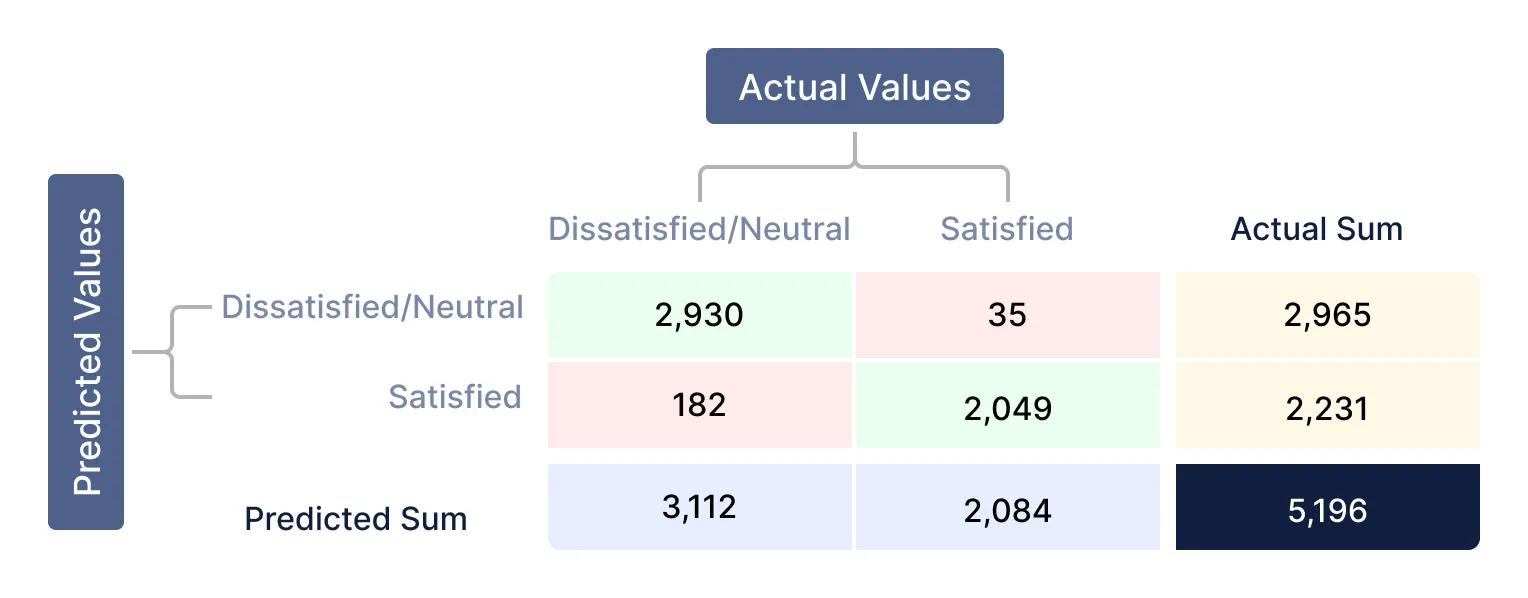
Values listed down from the confusion matrix:
| Total response count | 5,196 | True Positive (TP) | 2,930 | False Negative (FN) | 182 | False Positive (FP) | 35 | True Negative (TN) | 2,049 |
|---|
Commonly used performance metrics to evaluate any classification model are as follows.
Accuracy score: The proportion of correctly predicted instances among the total instances.
Accuracy = TP+TN/Total Responses = (2,930+2,049)/5,196 = 0.958Precision score: Precision is a measure of how accurate the model’s positive predictions are. It is calculated as the ratio of true positive predictions to the sum of true positive and false positive predictions.
Precision = TP/(TP+FP)= 2,930/(2,930+35) = 0.988Recall score: Recall score, also known as sensitivity, is the percentage of actual positive cases that a model correctly predicts. It is calculated by dividing the number of true positive predictions by the sum of the true positive and false negative predictions.
In simpler terms, a recall score measures how well a model can identify all of the positive cases in a dataset. A high recall score means that the model is good at finding all of the positive cases, while a low recall score means that the model is missing a lot of positive cases.
Recall score = TP/(TP+FN) = 2930/3112 = 0.941F1 score: The harmonic mean of precision and recall, providing a balanced assessment of the model’s performance.
F1 Score = 2*Recall*Precision/(Recall+Precision)
        = 2*0.941*0.988/(0.941+0.988)
        = 0.9639
From the above metrics, we can infer a few conclusions about the model.
- The airline model accurately predicted 4,979 passengers’ level of satisfaction where as, 182 are incorrectly predicted as satisfied and 35 as dissatisfied/neutral.
- It has good performance with an accuracy of 95.8%, a precision of 98.8%, and a recall of 94.1%. However, it has missed 182 satisfied passenger predictions. Hence, the model should be fine-tuned to increase the recall score, which then would identify all the satisfied passengers.
By examining these model metrics in QuickML, we can gain deeper insights into the performance of any machine learning model and make informed decisions on model selection and optimization. This will empower users to fine-tune their models and improve predictive accuracy.
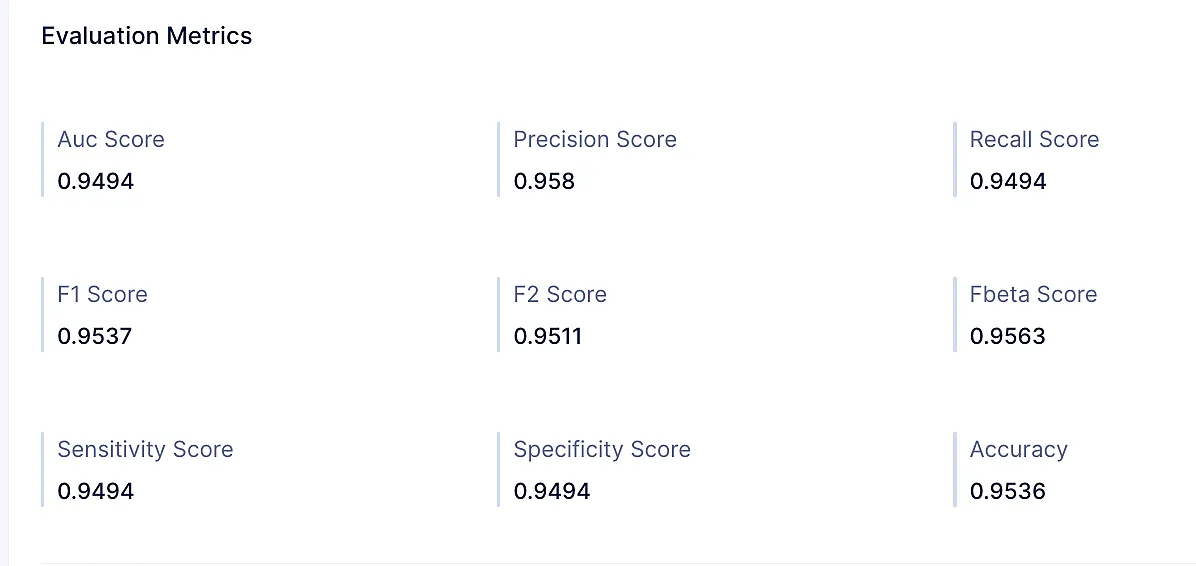
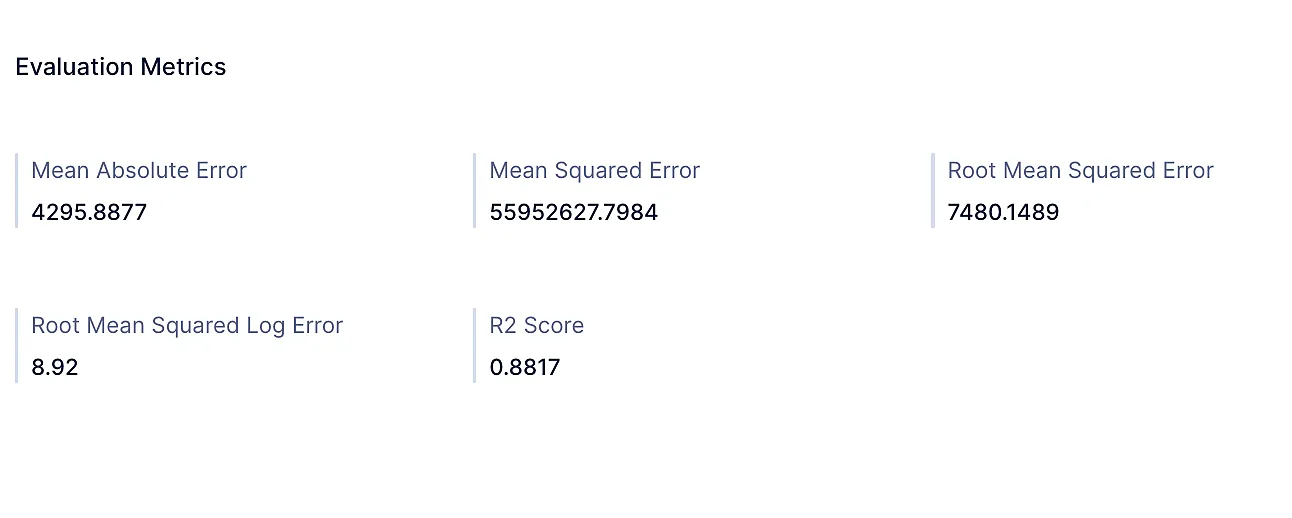
Evaluation metrics
QuicML shows the below evaluation metrics regarding classification and regression models created.
-
Classification
-
Regression
-
Recommendation
-
Time Series
Cross validation metrics
Cross validation is a method for evaluating the performance of a machine learning model by splitting the training data into k folds, training the model on k-1 folds, and evaluating the model on the remaining fold. This process is repeated k times, and the average performance of the model on the k folds is used to evaluate its overall performance.
In simpler terms, cross validation works by training the model on a subset of the training data and then evaluating its performance on the remaining subset of the training data. This is repeated multiple times, and the average performance of the model on all of the subsets is used to evaluate its overall performance. It helps to ensure that the model is not over fitting the training data and that it will generalize well to new data.
QuickML provides you a plethora of cross validation metrics to track performance for both classification or regression models.
The list of metric types provided in cross validation is below:
-
Classification Model
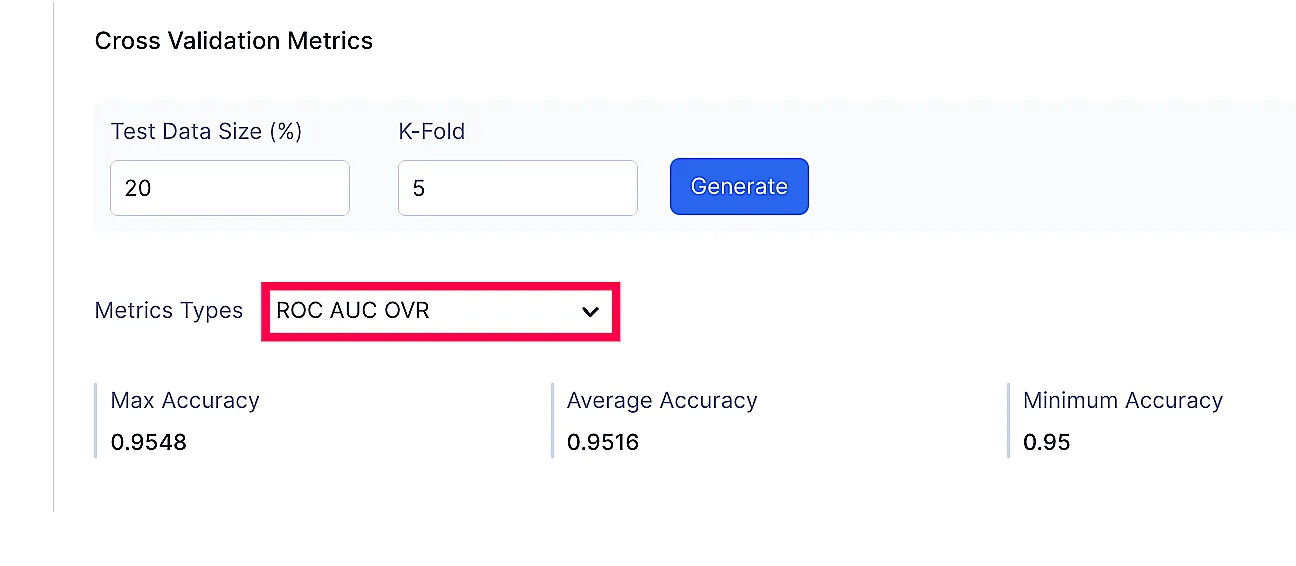
Metrics Types:
- ROC AUC OVR
- ROC AUC OVO
- ROC AUC OVR weighted
- ROC AUC OVO weighted
- Balanced accuracy
- Average precision
- F1 score
- F1 macro
- F1 micro
- F1 samples
- F1 weighted
-
Regression Model
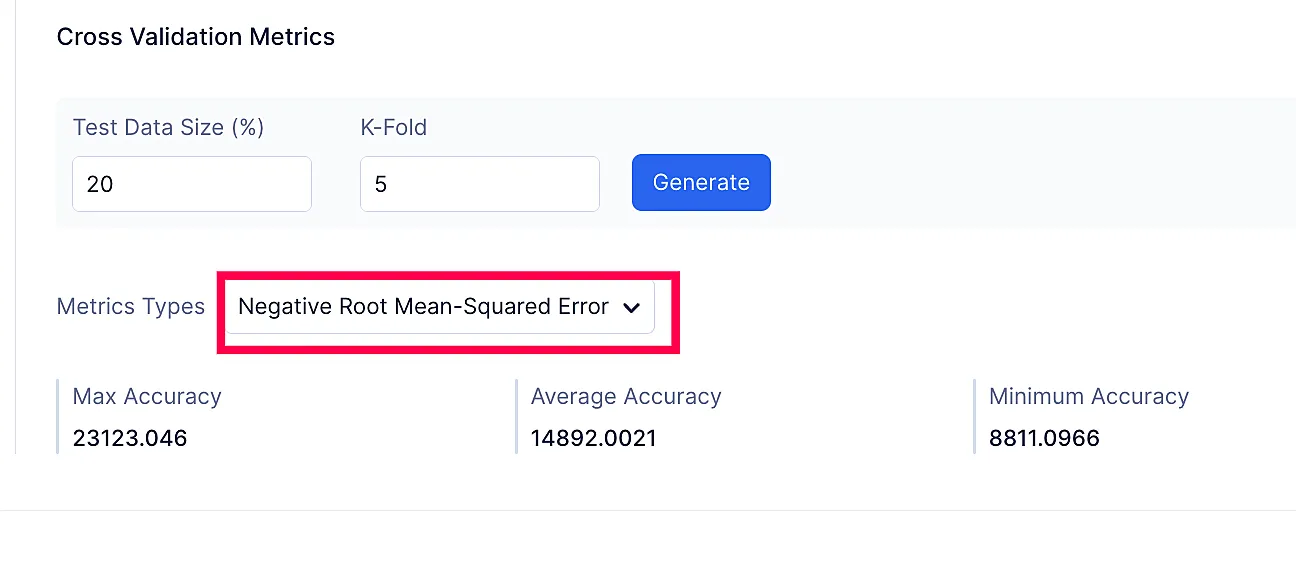
Metrics Types:
- Negative mean-squared error
- Negative mean-squared log error
- Negative root mean-squared error
- Negative mean absolute error
- Negative median absolute error
- Negative mean poisson deviance
- Negative mean gamma deviance
- Negative log loss
- Negative brier score
- R2 score
Model Versions
Model versioning is the process of tracking and managing different versions of a machine learning model.
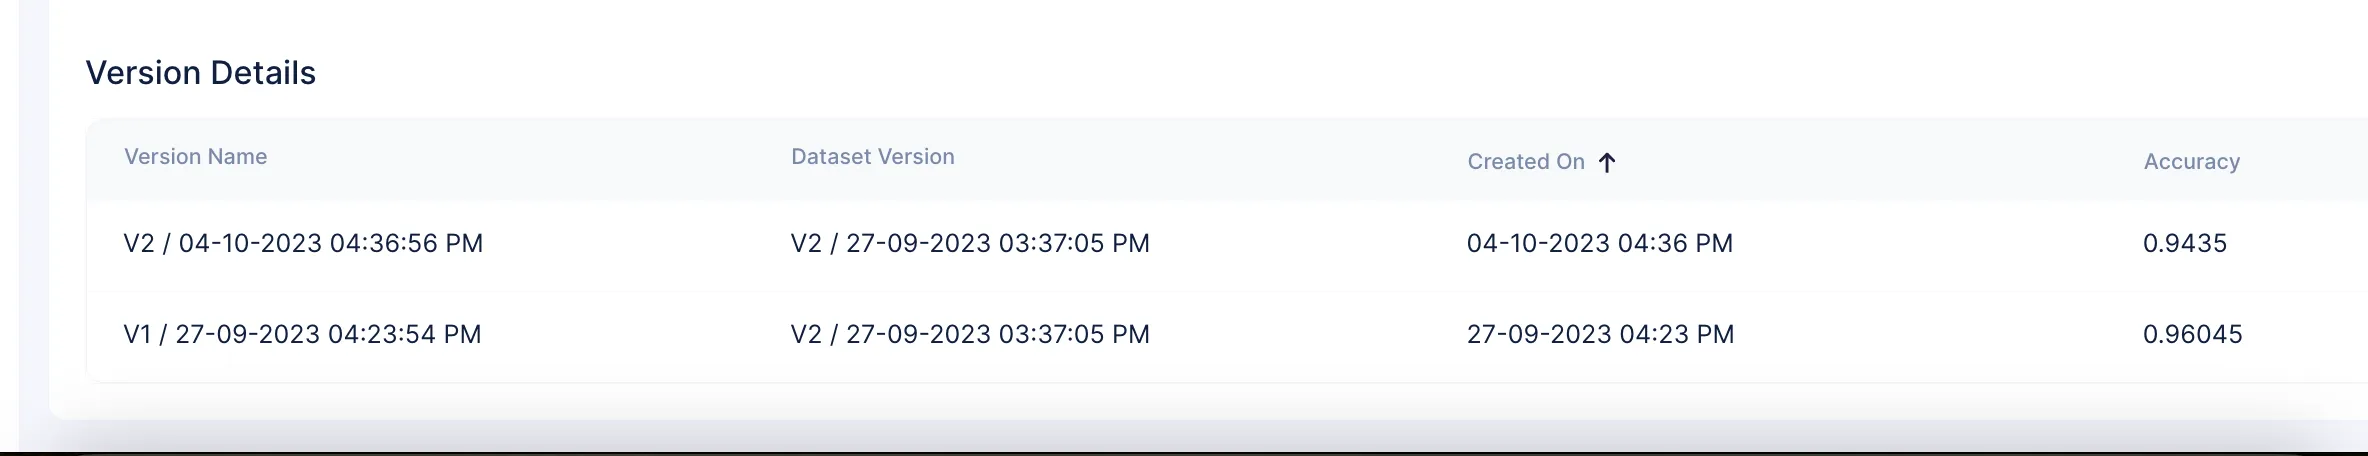
This is important because it allows you to compare different versions of the model, track its performance, and select the best version for deployment. Model versioning can also help you roll back to a previous version of the model if necessary.
Feature Importance
Idenitfying the importance of each input feature used in building a machine learning model can help you track how they will affect the quality of the model and its decision making progress.
A feature importance score is calculated to quantify the importance; the higher the score for a feature, the larger the impact of the feature on the model that predicts the target variable. By quantifying the importance of each feature, it provides insights into the data and the model, allowing for better understanding, interpretation, and potential improvement of the model’s performance.
Feature importance can be calculated using various methods, such as permutation importance or mean decrease in impurity, or using model-specific techniques like the feature importances attribute in tree-based models.
Uses of Feature importance
Feature importance is also used to understand the relationship between input features and target variables, similar to the correlation matrix. Highly relevant features that impact the model are identified using the importance score.
- Dimensionality Reduction: Feature importance assists in reducing the dimensionality of the model by keeping features with higher scores and removing those with lower scores from the training data. This simplification reduces bias, removes noise, and speeds up model training, ultimately generating a better-performing model.
- Model Performance: By focusing on the most relevant features, feature importance helps to optimize the model for better performance and improve its predictability.
- Stakeholder Insights: Feature importance provides stakeholders with insights into which features have the highest impact on the model’s predictions and helps in understanding the model’s behaviour.
In short, feature importance explains the significance of each feature on the model.
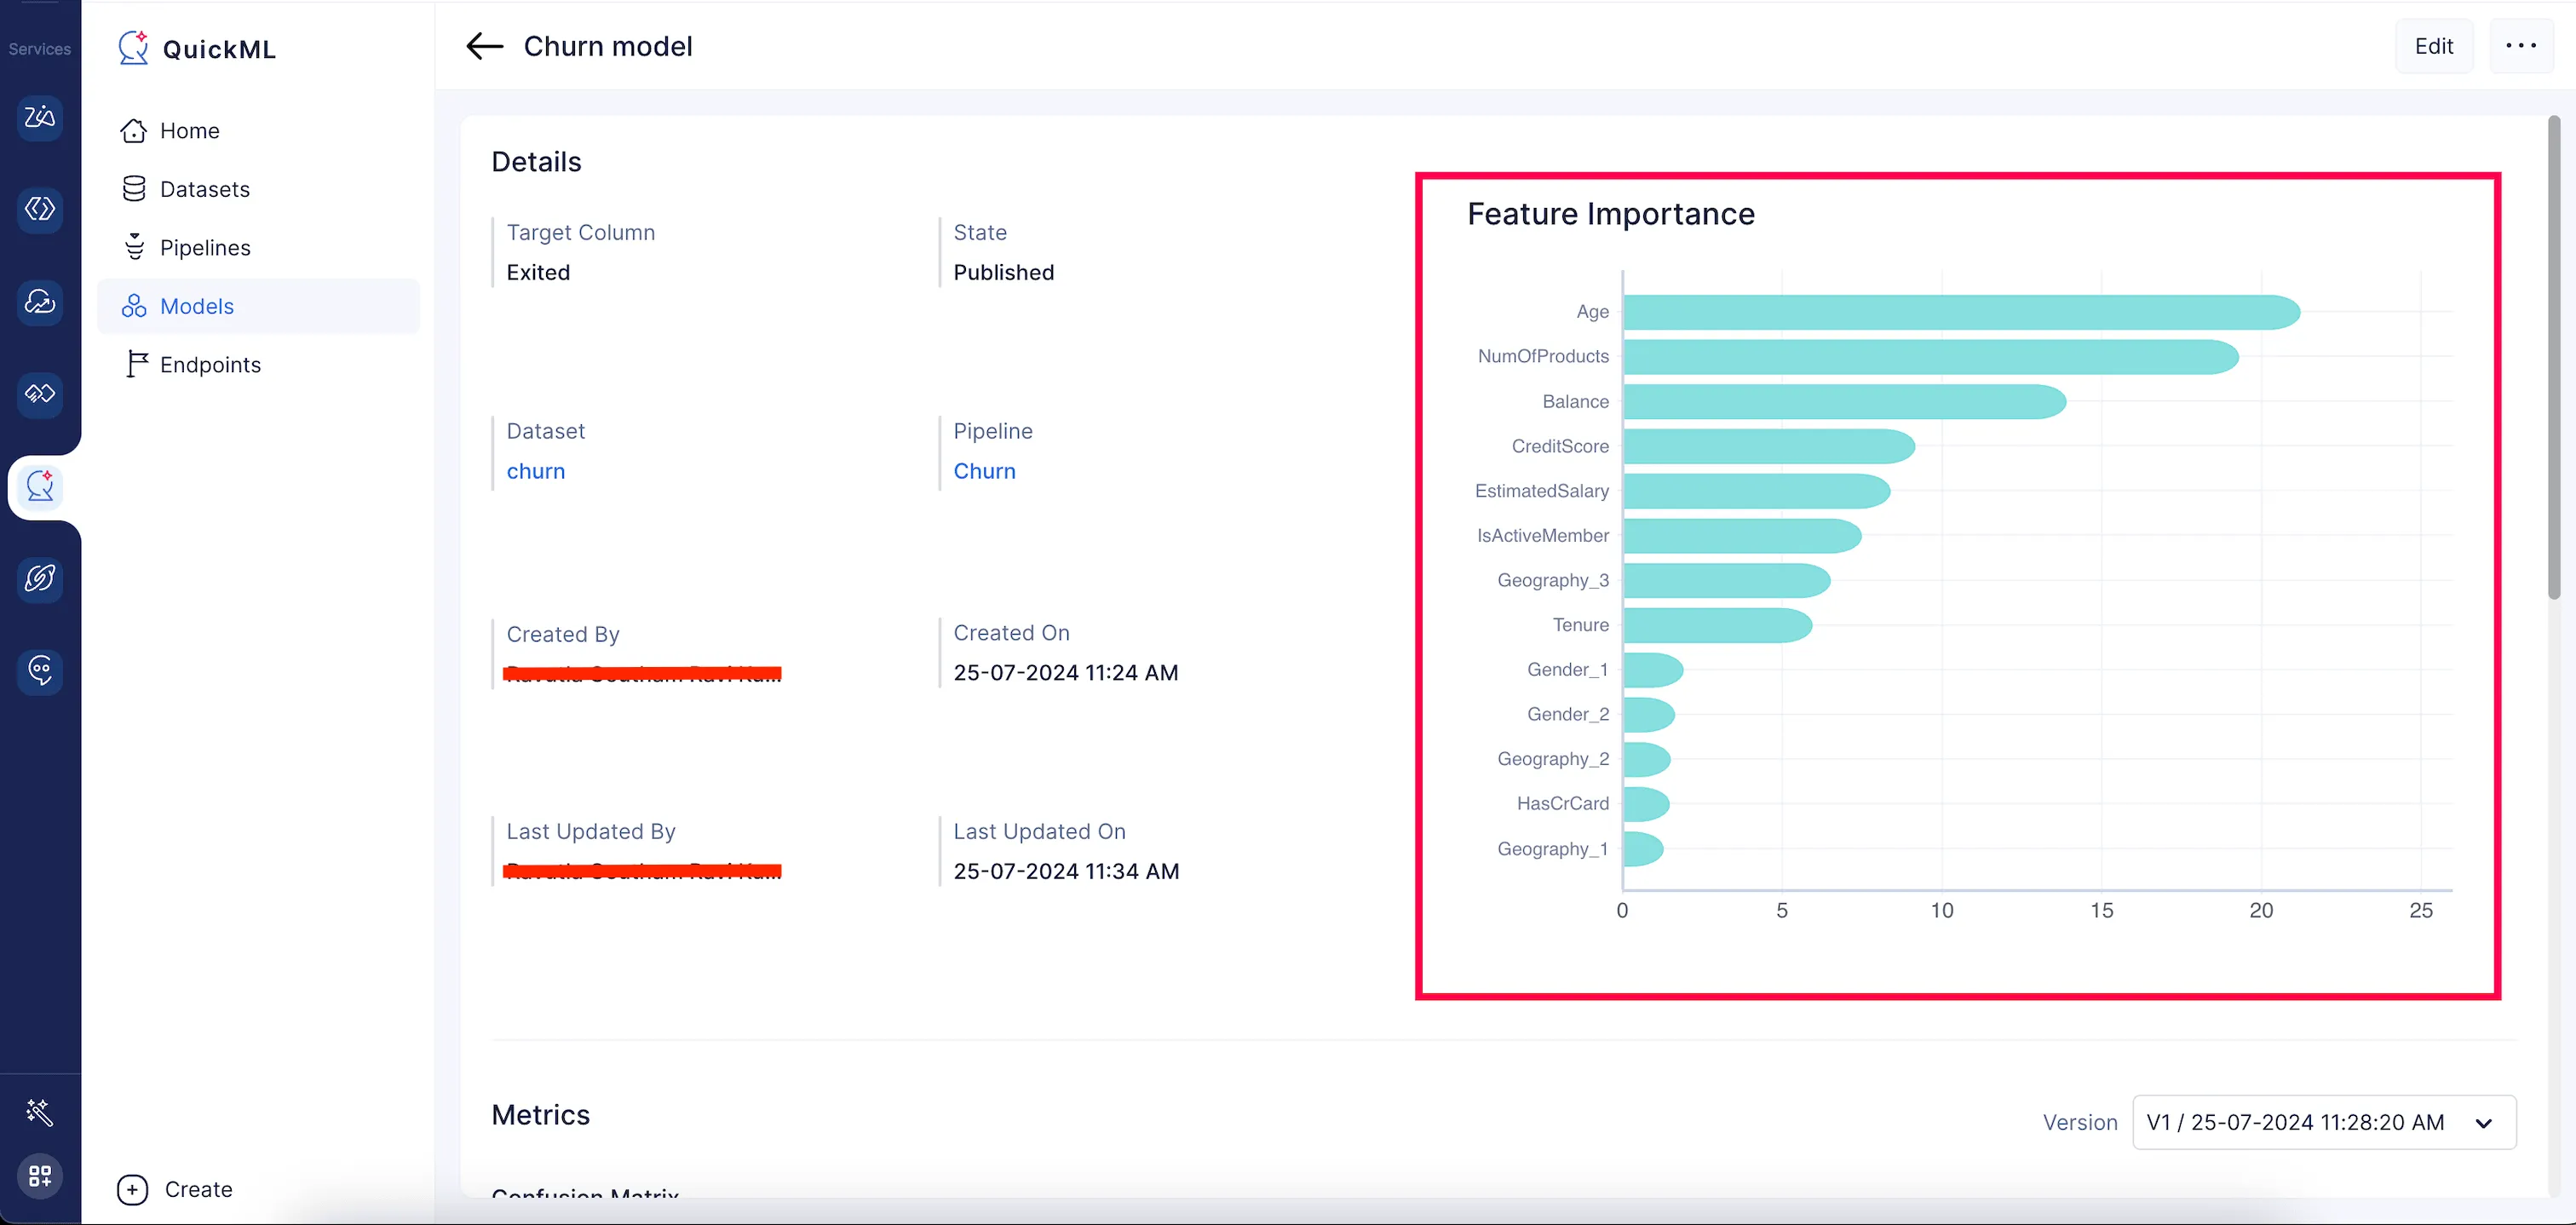
In the QuickML model details page, a bar chart is generated to visually depict the feature importance score of the top 20 features in descending order, and the rest will be categorized as others.
Last Updated 2025-10-09 21:41:25 +0530 IST
Yes
No
Send your feedback to us