Coverage
Here is how the Coverage tab looks.
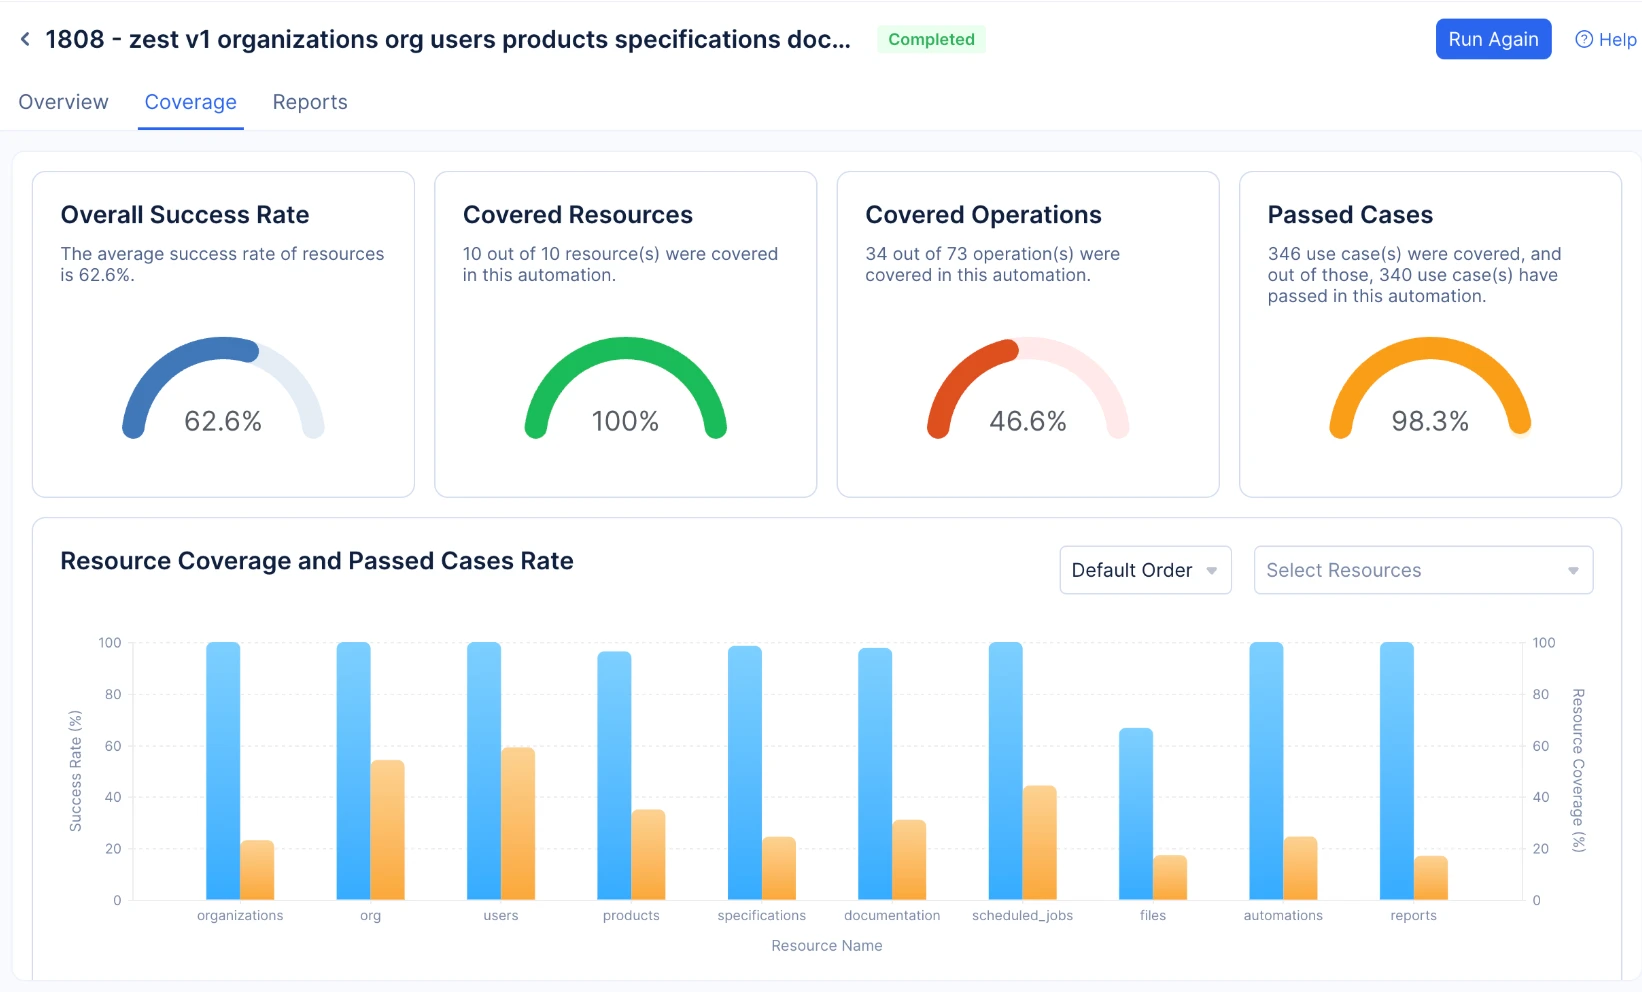
The Coverage Page page gives you a graphical representation of the following details.
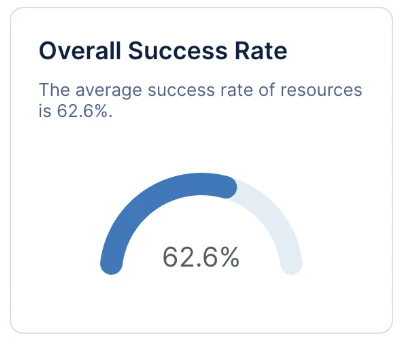
Overall Success Rate
The average success rate of resources.
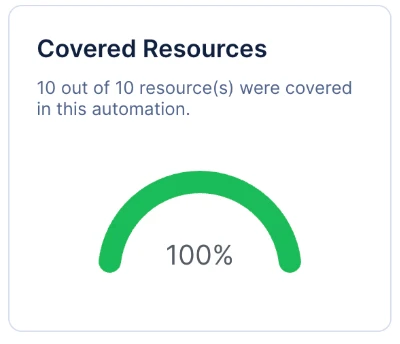
Covered Resources
The number of resources covered in the automation.
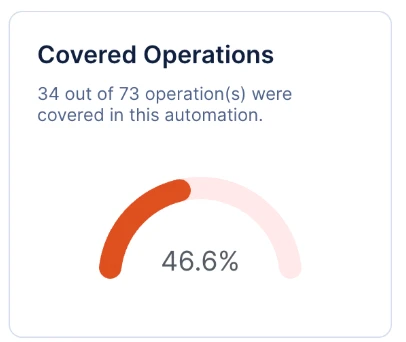
Covered Operation
The number of operations covered in the automation.
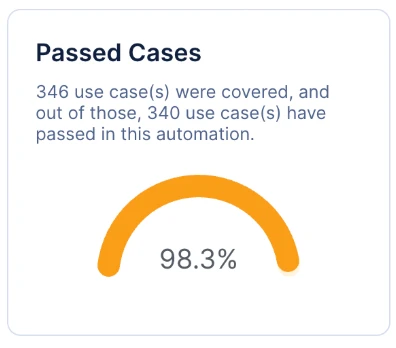
Passed Cases
The number of successful test cases in the automation
Resource Coverage and Passed cases rate
Visual Representation
The chart presents the Resource Names along the x-axis, representing the different resources being analyzed. On the y-axis, it shows the Success Rate, which indicates how well the test cases for each resource performed.
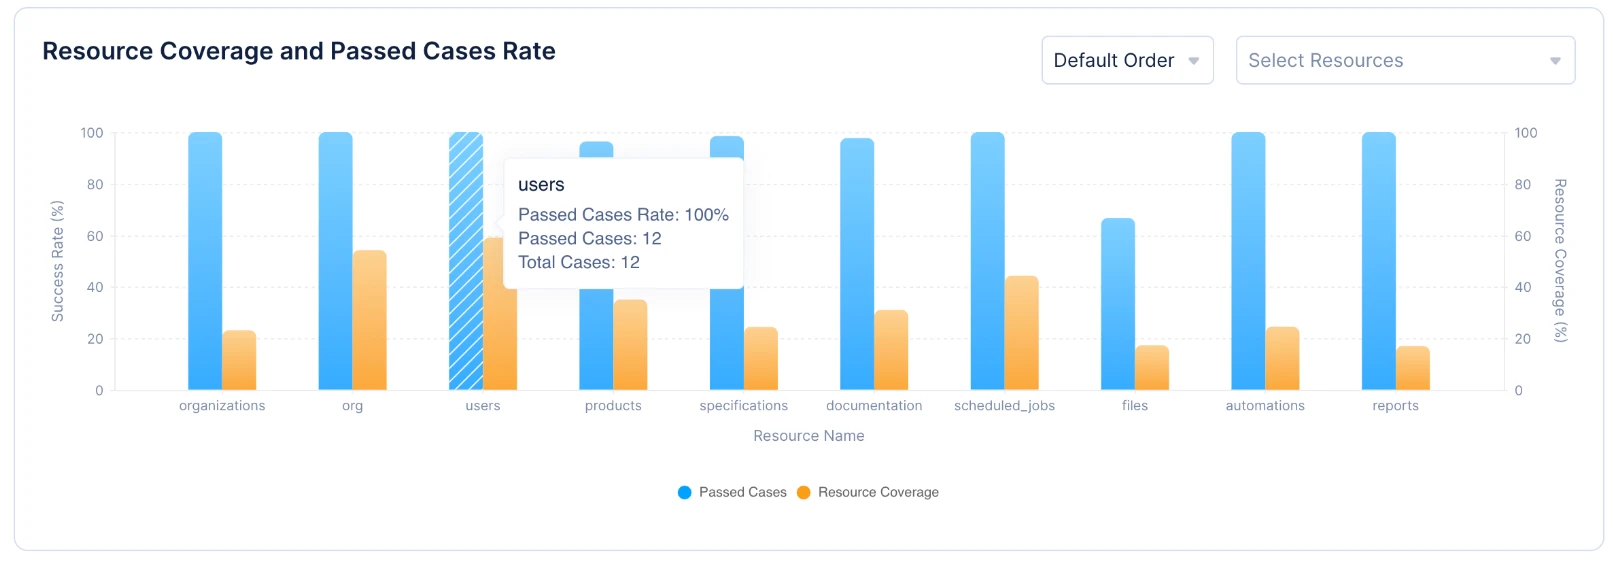
- Resource Coverage: The measurement of how many elements of your resource have been tested.
- Passed Cases: The proportion of test cases that successfully passed for each resource.
- Resource Coverage Percentage = (Number of covered elements / Total number of elements defined in ZSPEC) * 100
- Passed Cases Rate = (Number of passed test cases / Total number of test cases generated) * 100
Here element refers to the XML elements of ZSPEC file.
By displaying these metrics on the chart, it provides a clear overview of both the testing coverage and the success of the tests for each resource.
Tabular representation
The tabular representation shows the coverage details of the various elements of a resource.
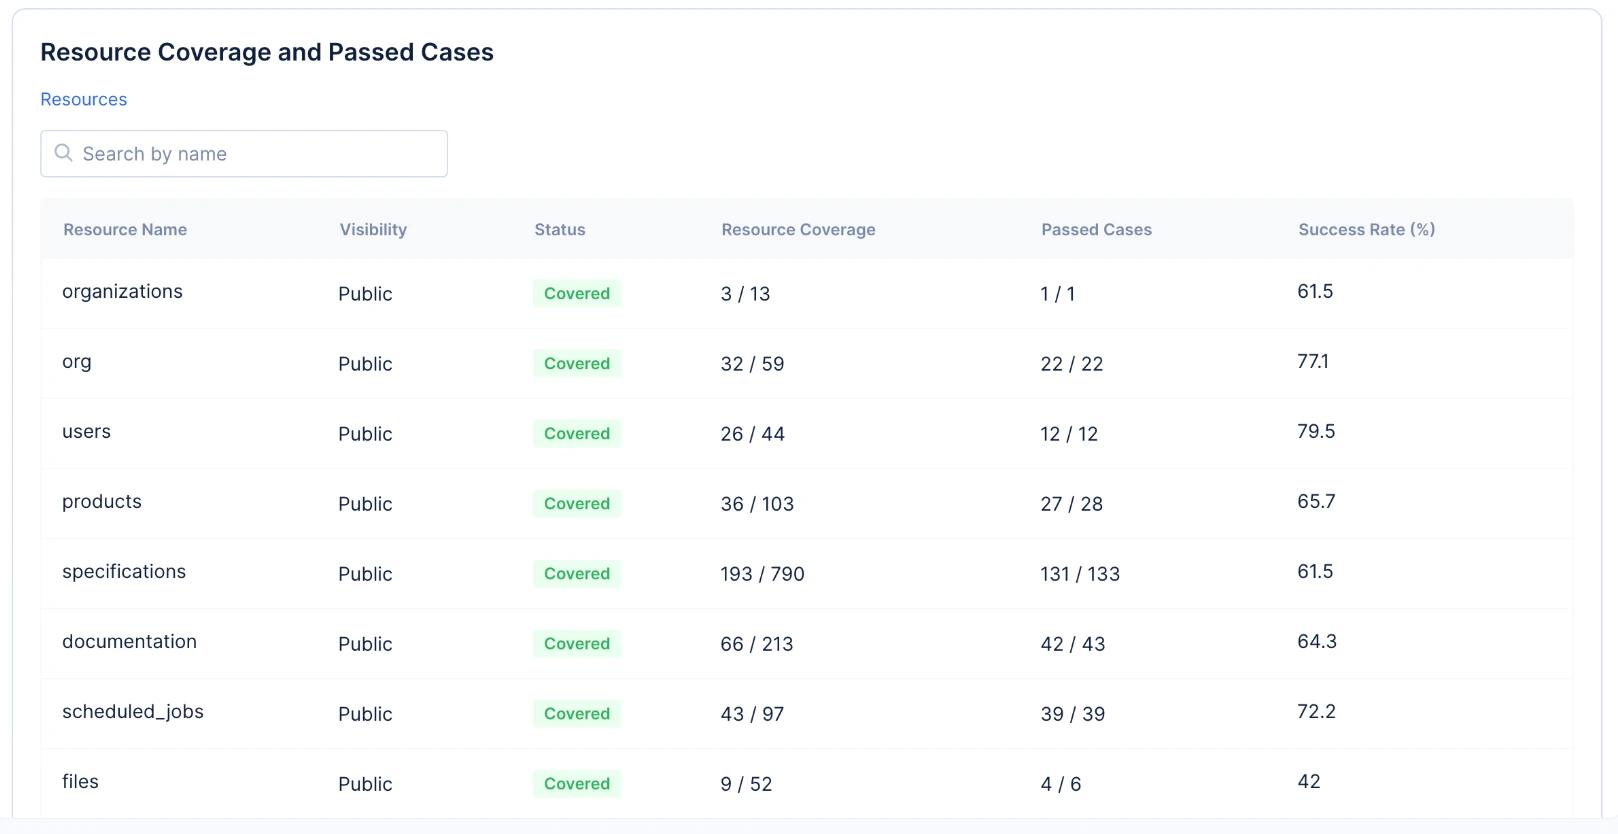
- Resource Coverage - Resource coverage is the ratio of the number of elements tested within a particular resource to the total number of elements available in that resource.
Resource Coverage = (Number of covered elements / Total number of elements defined in ZSPEC)
- Passed Cases - It is the ratio of successful test cases passed for a specific resource out of the total number of test cases created for that resource.
Passed Cases = (Number of passed test cases / Total number of test cases generated)
- Success Rate - This is calculated as the average of two key metrics— Resource Coverage and Passed Cases.
Success Rate = (Resource Coverage+Passed Cases/2)
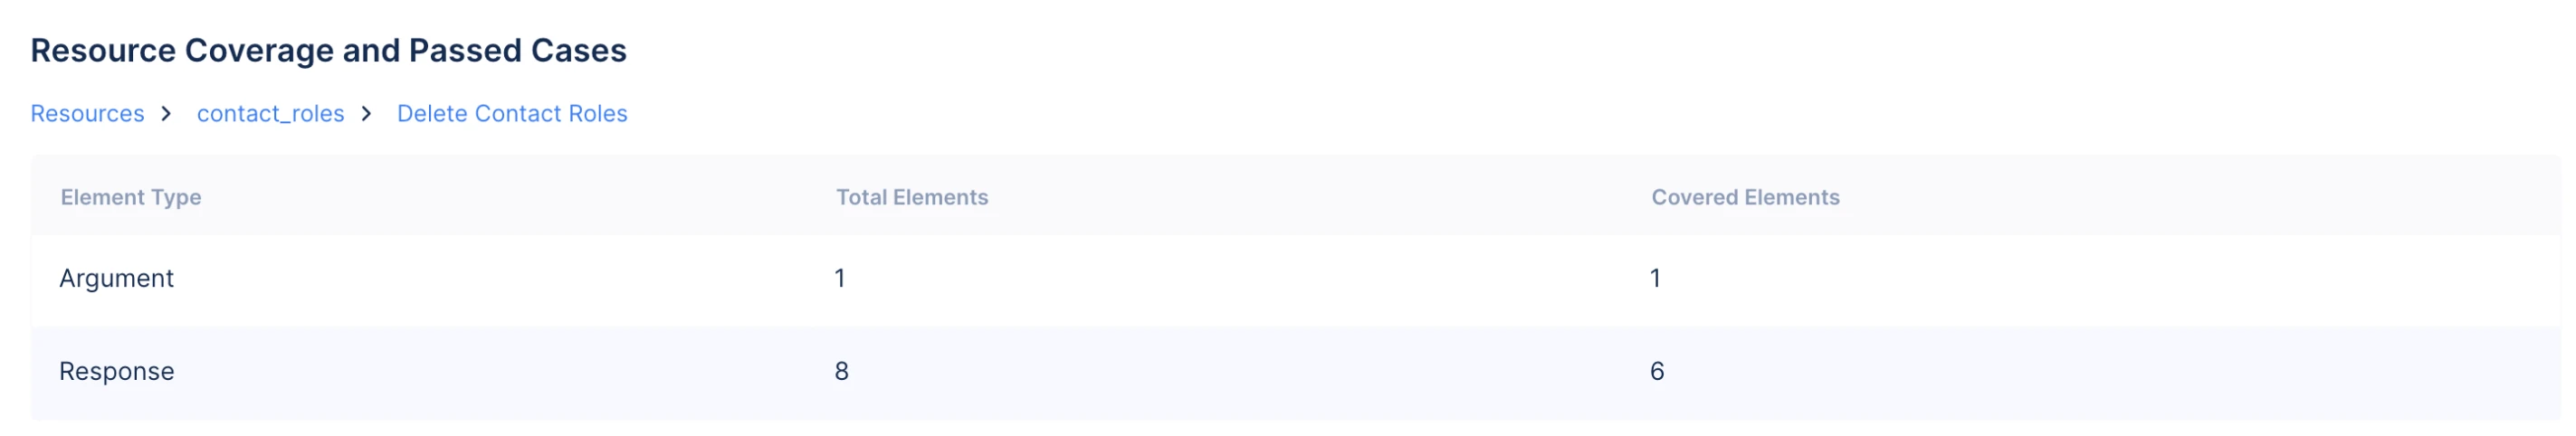
Here,
-
Total Elements refers to the number of elements that are of the element type including its sub-elements (elements that are inside it).
-
Covered Elements - The number of elements executed during the automation run. (elements that are inside it).
Last Updated 2025-06-03 18:19:55 +0530 IST
Yes
No
Send your feedback to us