Dashboard
The Analytics dashboard of Catalyst Signals provides a consolidated view of the event performances within a Catalyst project. It presents the data in an easy-to-understand format, allowing you to draw valuable insights. This includes analyzing trends, identifying patterns, and making informed decisions to optimize system performance and ensure seamless event processing.
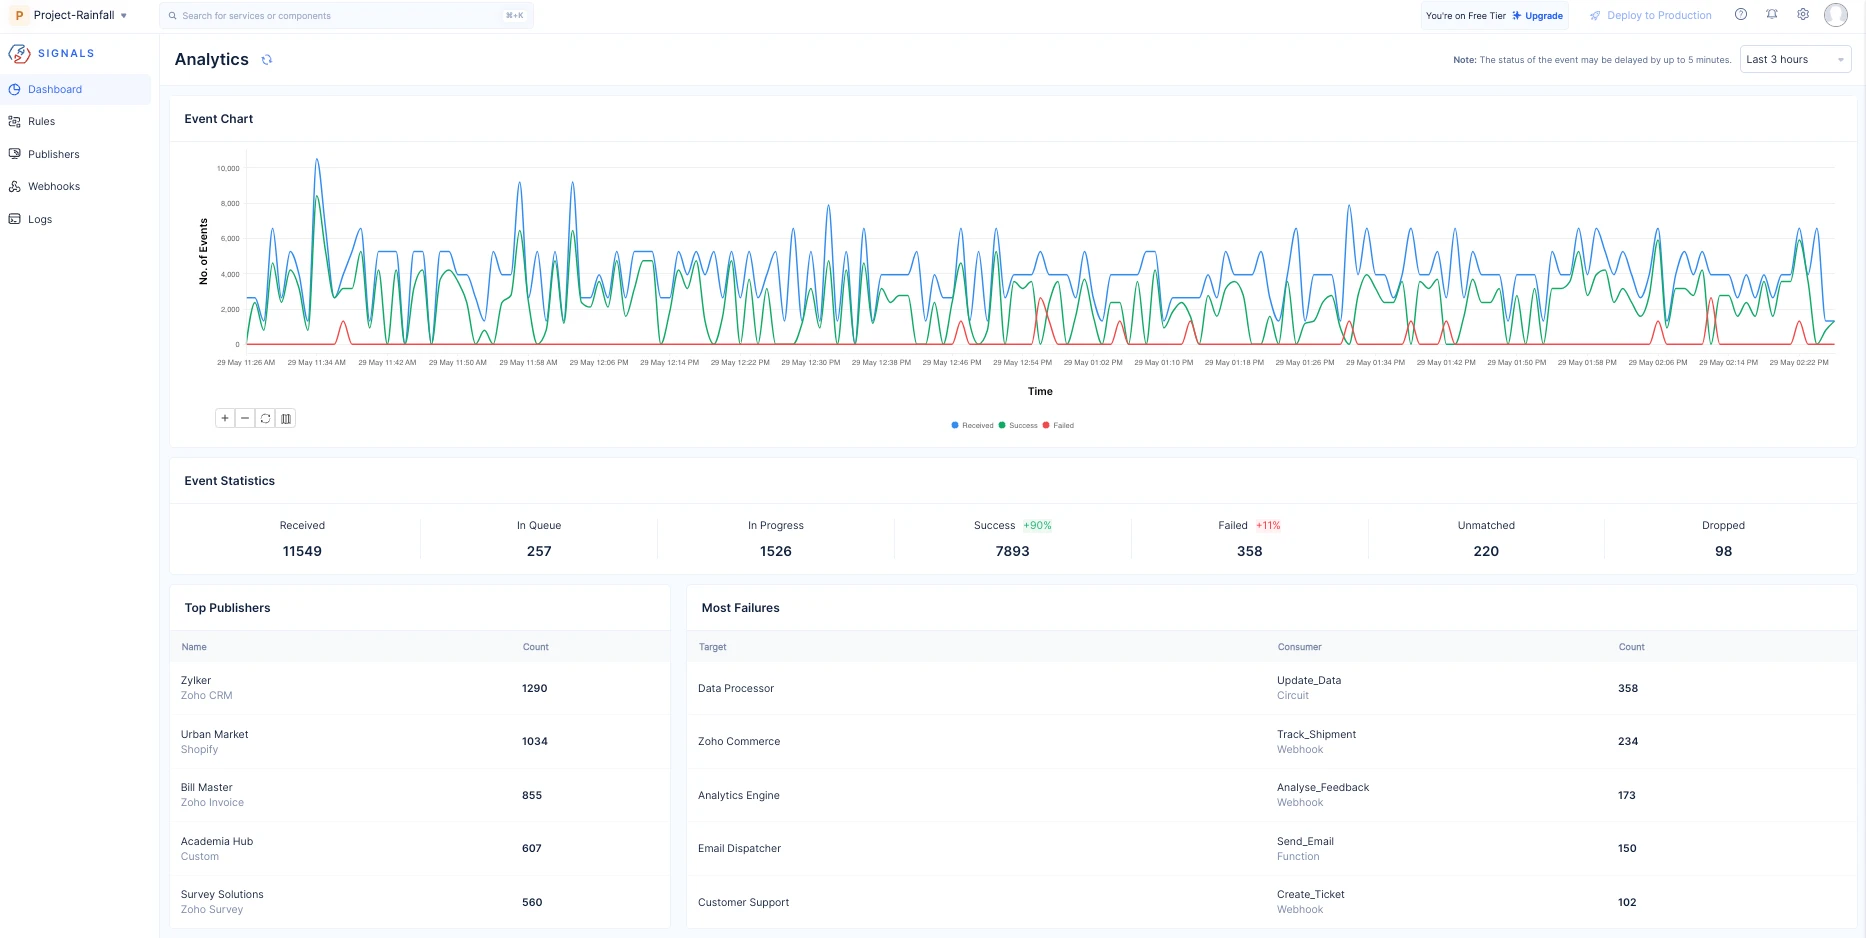
You can use the refresh icon in the title bar to get real-time updates of the event performances. The time drop-down in the top-left corner of the dashboard lets you adjust the time period of the data you find in the dashboard. The default view is set to the Last 3 hours and offers an incremental time period. You even have a range calendar to get a complete analysis of your required business periods.
Event Chart
The line graph illustrates the number of events processed in the Signals service over time, measured in minutes. It offers great flexibility by allowing you to adjust the time period, ranging from one minute interval to a maximum of 15 minutes. The icons below the chart help you adjust this interval with the help of a time scale.
The graph represents three distinct lines, each representing the status of the events.
- Received - All the events received in Signals from the publishers are denoted in blue color.
- Success - Events that have successfully met the rule conditions and delivered to the targets are represented in the green color.
- Failed - Events that have met the rule conditions but failed to reach the target due to any errors are denoted in the red color.
Visualizing the number of events processed over time and differentiating between event statuses help you to understand the performance, reliability, and overall health of your event rules.
Event Statistics
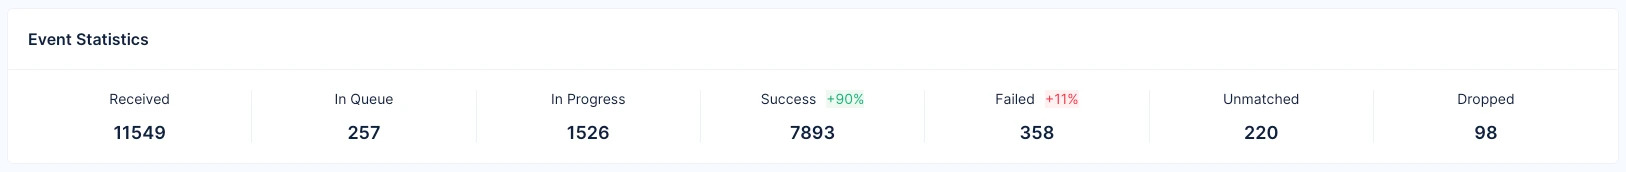
This statistics provide understanding into the number and percentage of events across different event processing status. It helps in understanding the anomalies and identifying areas of improvement to ensure an effective event processing. The following even statuses will be displayed:
- Received - This denotes the total number of events that have been received by Signals from all the publishers.
- In Queue - This represents the total number of events that have been received and not started to process.
- In Progress - This denotes the total number of events that are currently under event processing.
- Success - This indicates the total number of events that have been successfully delivered to the targets without encountering any errors.
- Failed - This represents the total number of events that failed to be delivered to the target due to any errors.
- Unmatched - This indicates the total number of events that did not meet the conditions configured in the rule filters or had no active rules or targets, and therefore were not processed.
- Dropped - This denotes the total number of events that are dropped when either the target or rule is disabled or deleted.
The Success and Failed statuses display the Key Performance Indicator metrics in terms of percentage relative to the selected time interval that is visible in the top-right corner of the title bar.
For example, if the period is set to Last 3 hours, the percentage will reflect the comparison with the previous 3 hours.
Top Publishers
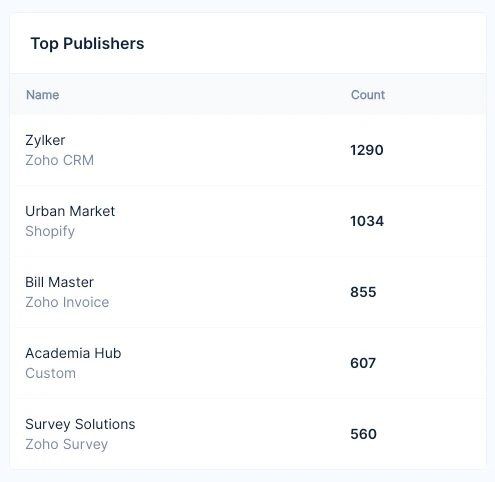
This element lists the top five publishers and their total number of events irrespective of their status. This helps you gain deeper understanding of which publishers are most active and effective in generating valuable events. Recognizing these sources of significant event traffic helps you to assess the impact of individual publishers on the overall event processing workflow.This assists you in taking data driven decisions to enhance the performance and effectiveness of their event processing workflows.
Most Failures
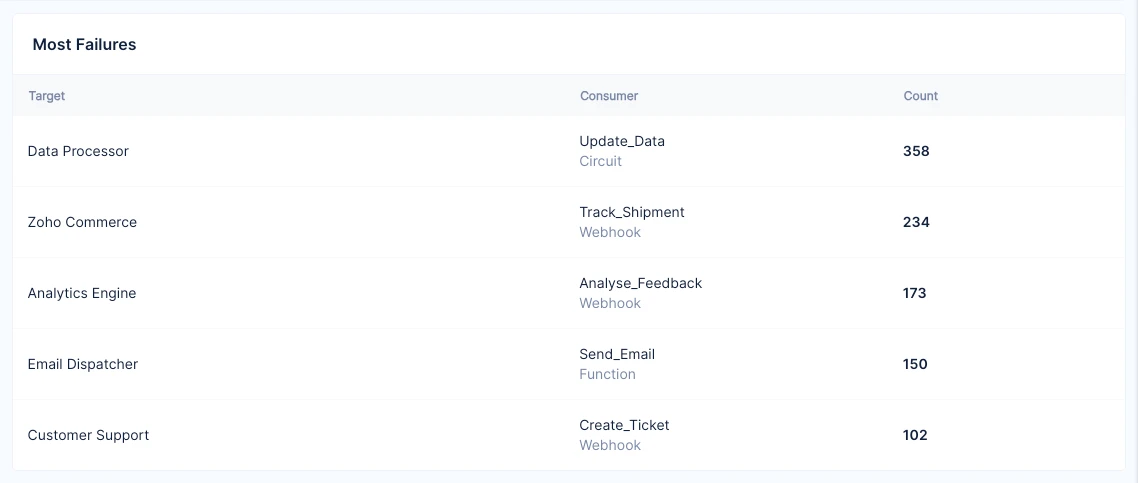
The element highlights the top five failure targets, along with the number of failed events and their associated consumer type and name. It helps you to pinpoint areas of concern within your event processing workflow. This information facilitates focused debugging and troubleshooting that allows you to collaborate more efficiently with relevant teams responsible for managing the affected targets.
Last Updated 2025-06-10 18:26:01 +0530 IST
Yes
No
Send your feedback to us