Code Debugger
Catalyst Zia AI Assistant’s Code Debugger debugs your code to identify errors, bugs, and problem areas effectively, and helps you address issues promptly. Debugging code is a fundamental part of the software development journey, which can be easily automated with the AI Assistant, ensuring speed and efficiency in your process.
The Code Debugger feature enables you to provide code blocks with potential bugs as the input prompt, and even supply error messages to refer to the error block. Zia AI Assistant then returns the errors identified in your code across two categories:
- Logical errors
- Syntax errors
The AI Assistant additionally returns the corrected code after resolving the identified errors in the original code. This helps you simply copy the corrected code and implement it in your codebase, after analyzing the corrections made by the AI.
To work with Zia AI Assistant’s Code Debugger:
- Access the feature by clicking Code Debugger after opening Zia AI Assistant.
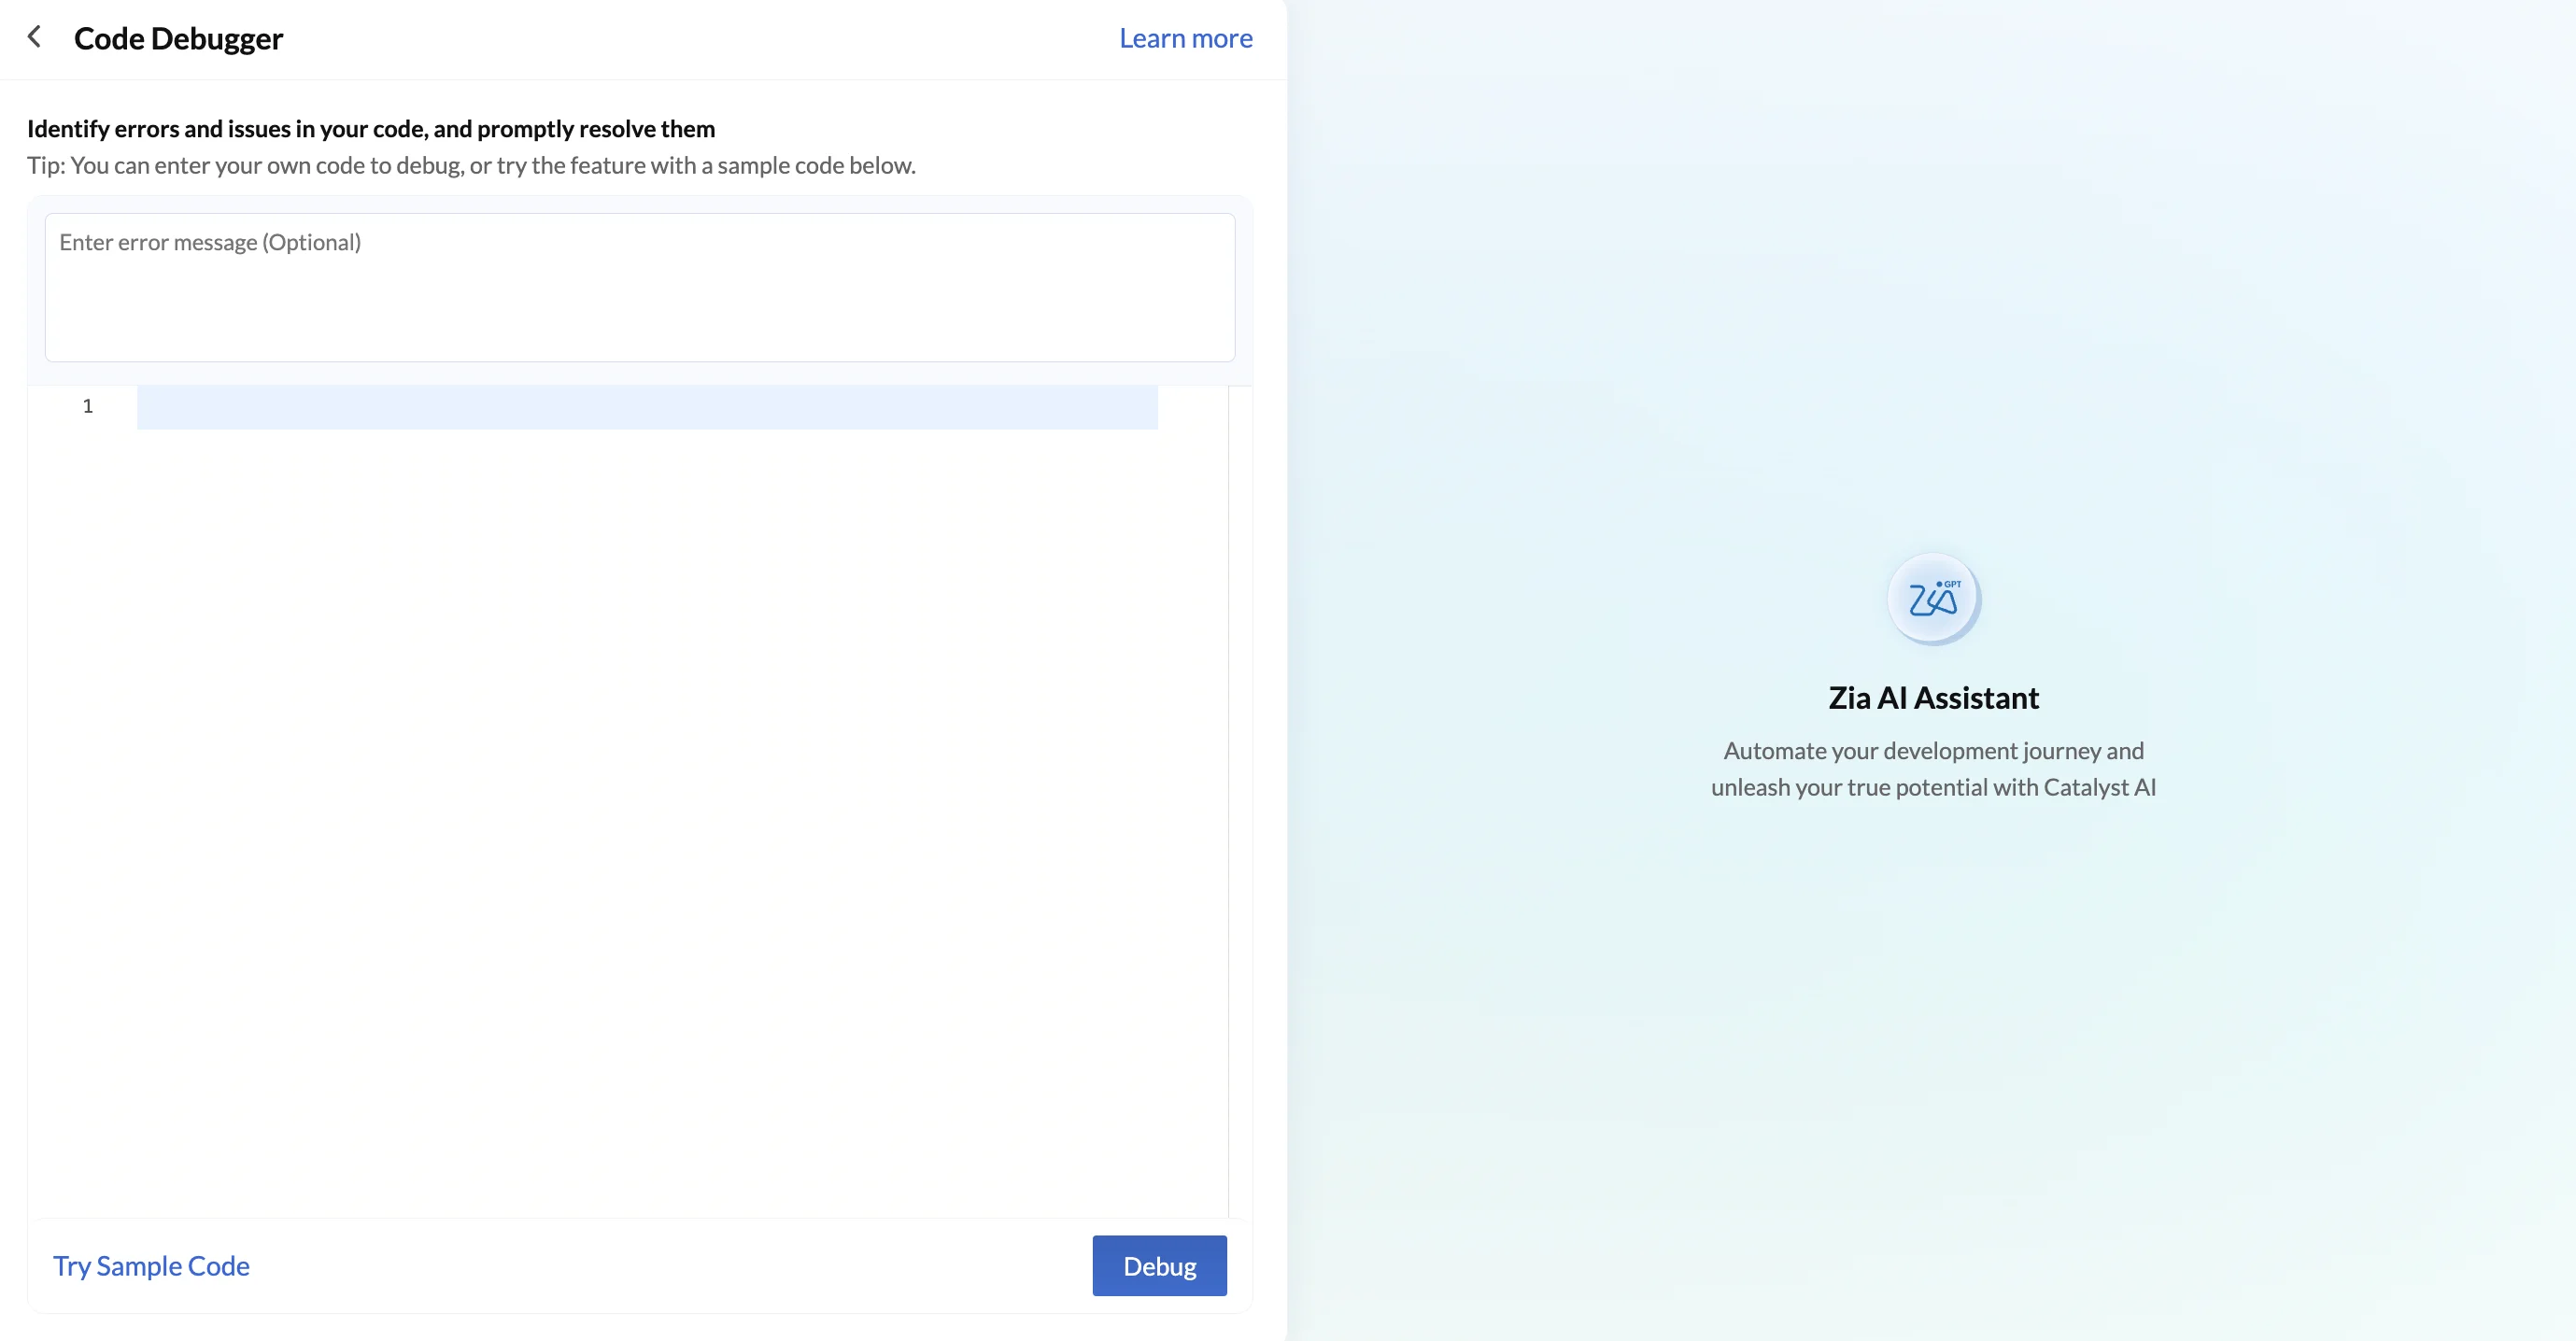
-
Enter the code to be debugged without needing to provide any additional input through the prompt, such as directions on what needs to be done like “Debug this code…”.
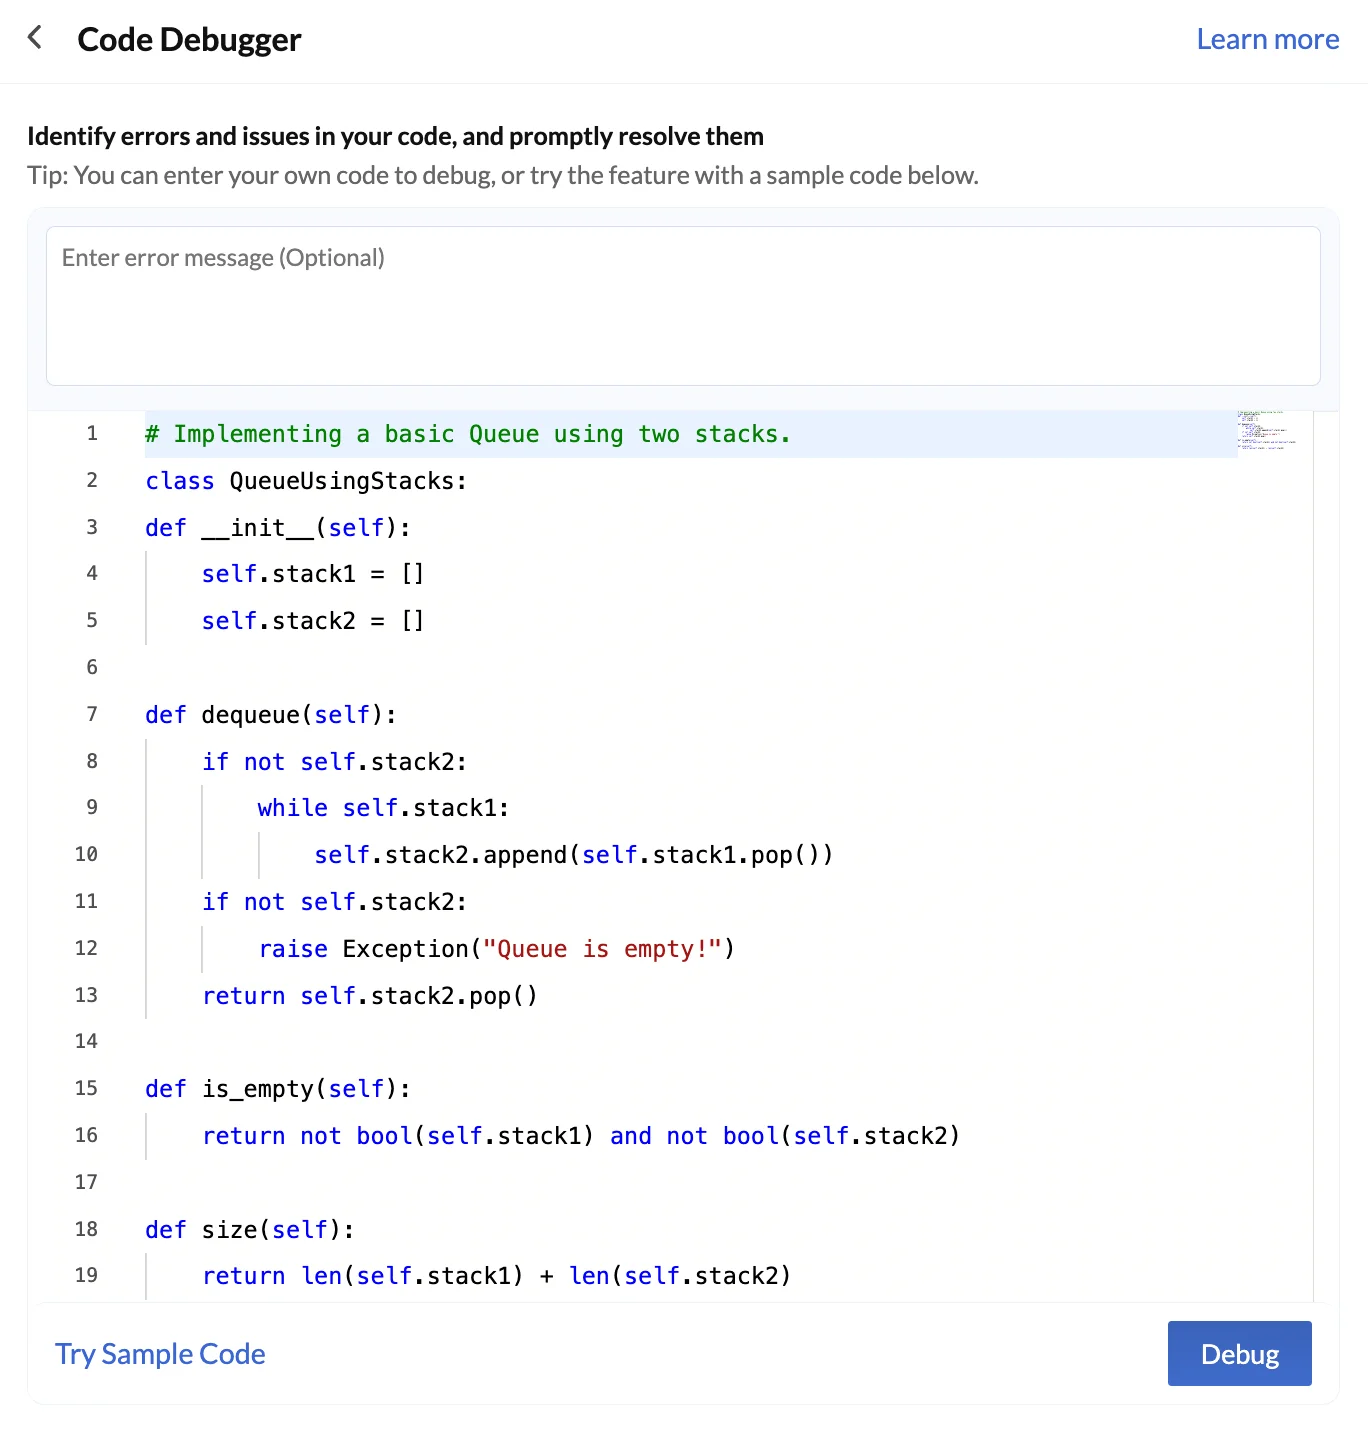
You can also try the feature with a sample code provided by Catalyst by clicking the Try Sample Code button. This will add a sample code with errors to the input window. You can click it multiple times to check different sample codes available in various programming environments in Catalyst to try.
-
You can additionally enter an error message to refer to the error block as per your needs.
-
Click Debug after you enter the input code. Zia AI Assistant will send the input prompt to OpenAI’s servers for processing. The result generated by OpenAI is fetched and displayed in the output window.
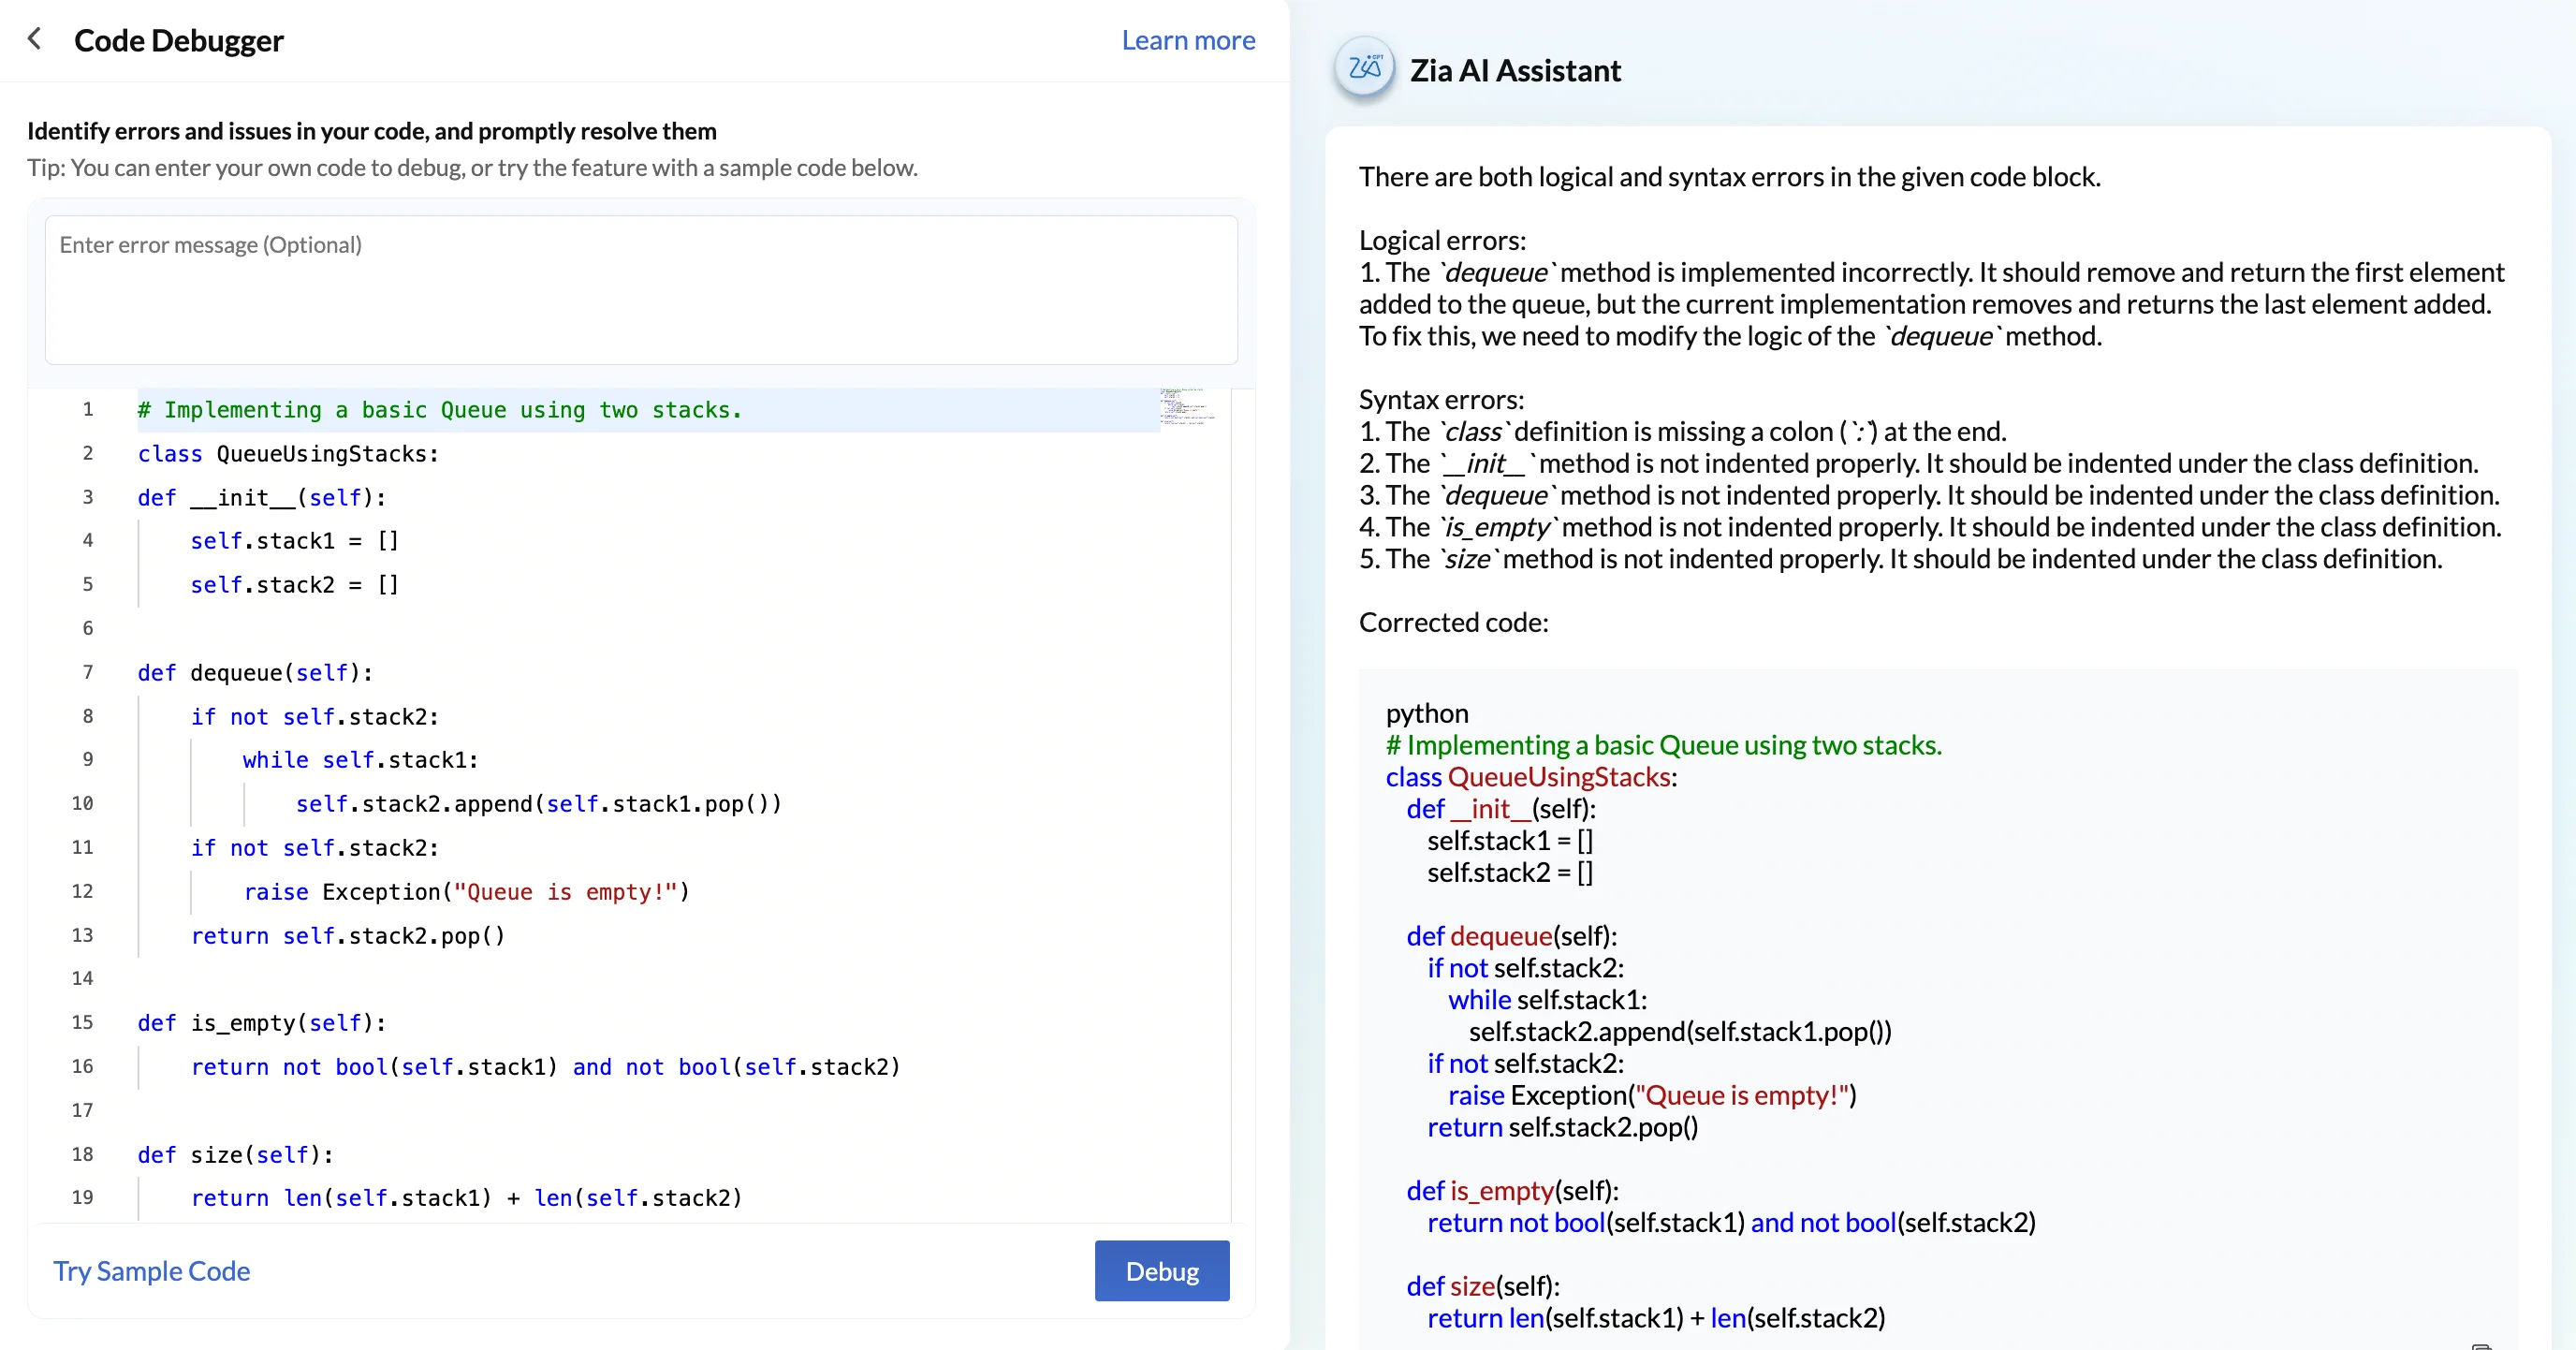
You can now analyze the logical and syntax errors in your code, if any, and use the corrected code provided.
Last Updated 2025-02-19 15:51:40 +0530 IST
Yes
No
Send your feedback to us