Launch Catalyst Functions Shell and Start Tunneling
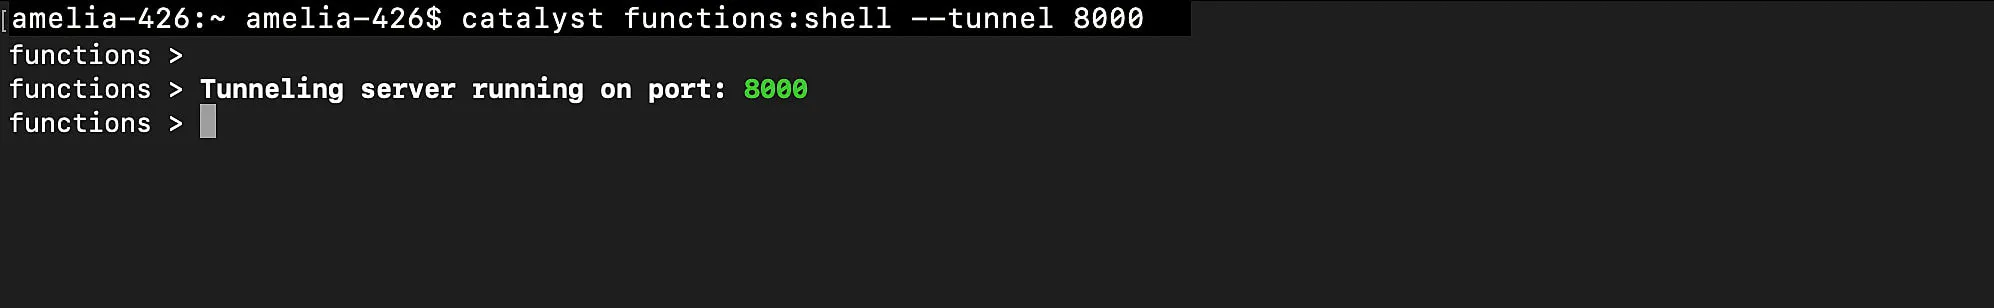
Launch Catalyst function shell using the following CLI command with the –tunnel option and specify the port number in which you generated the Tunneling URL.
This command will start tunneling your functions.
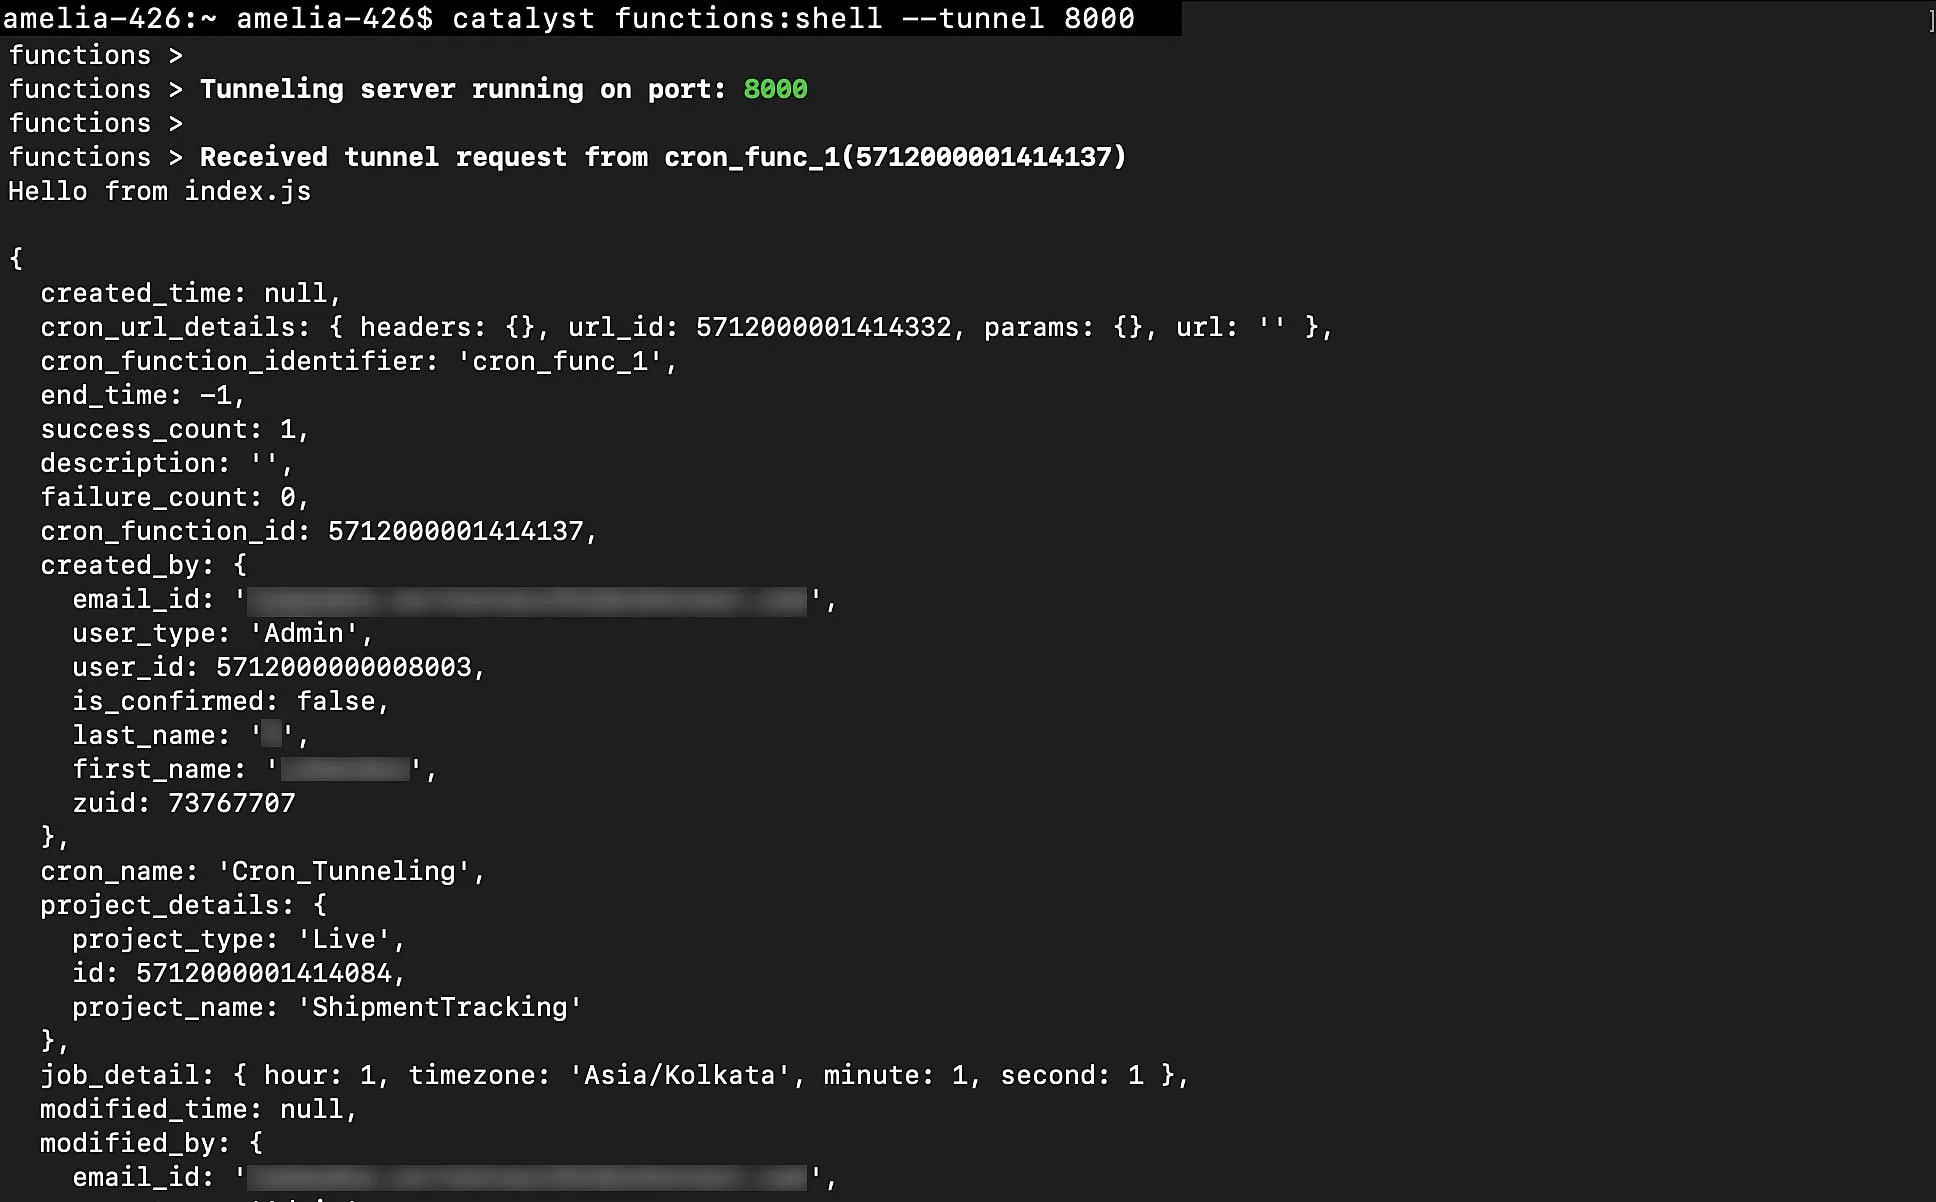
If you trigger the function, all the calls made will be routed locally, and you will be able to view their execution logs in the Catalyst CLI.
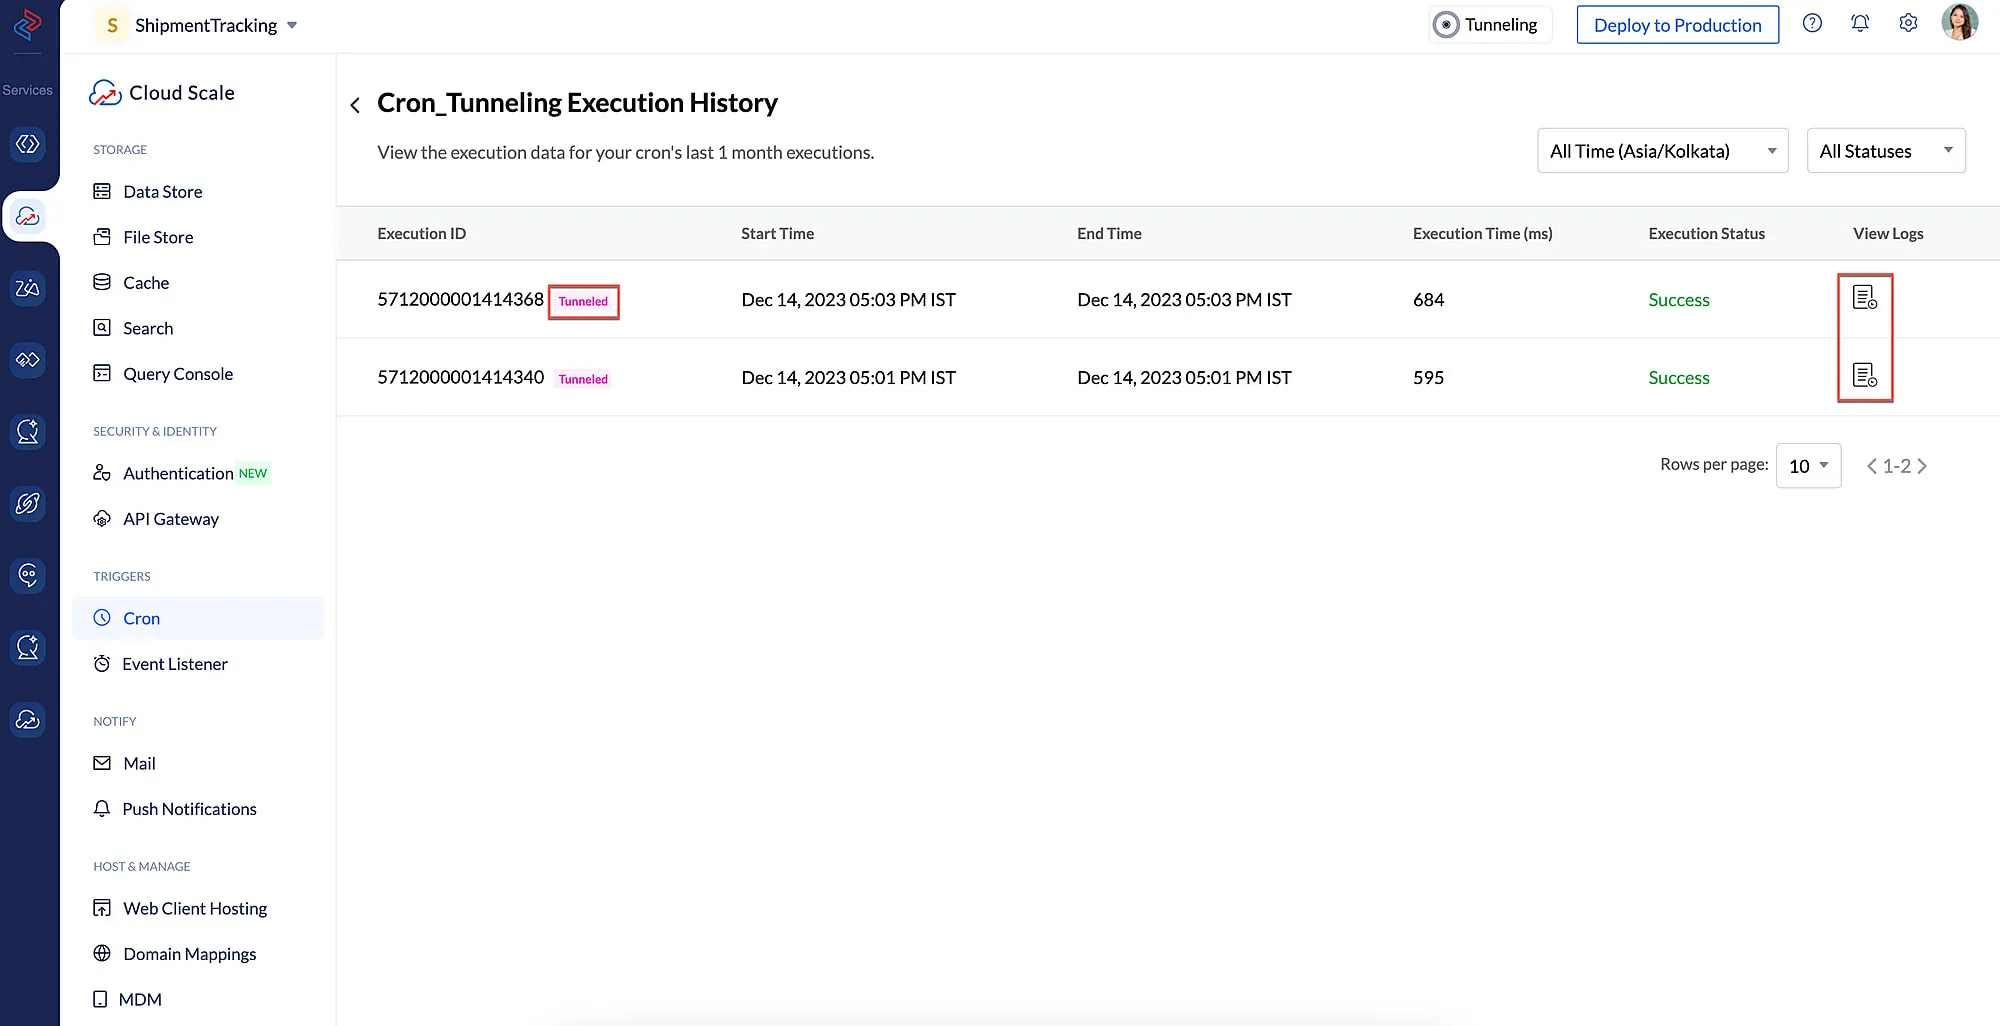
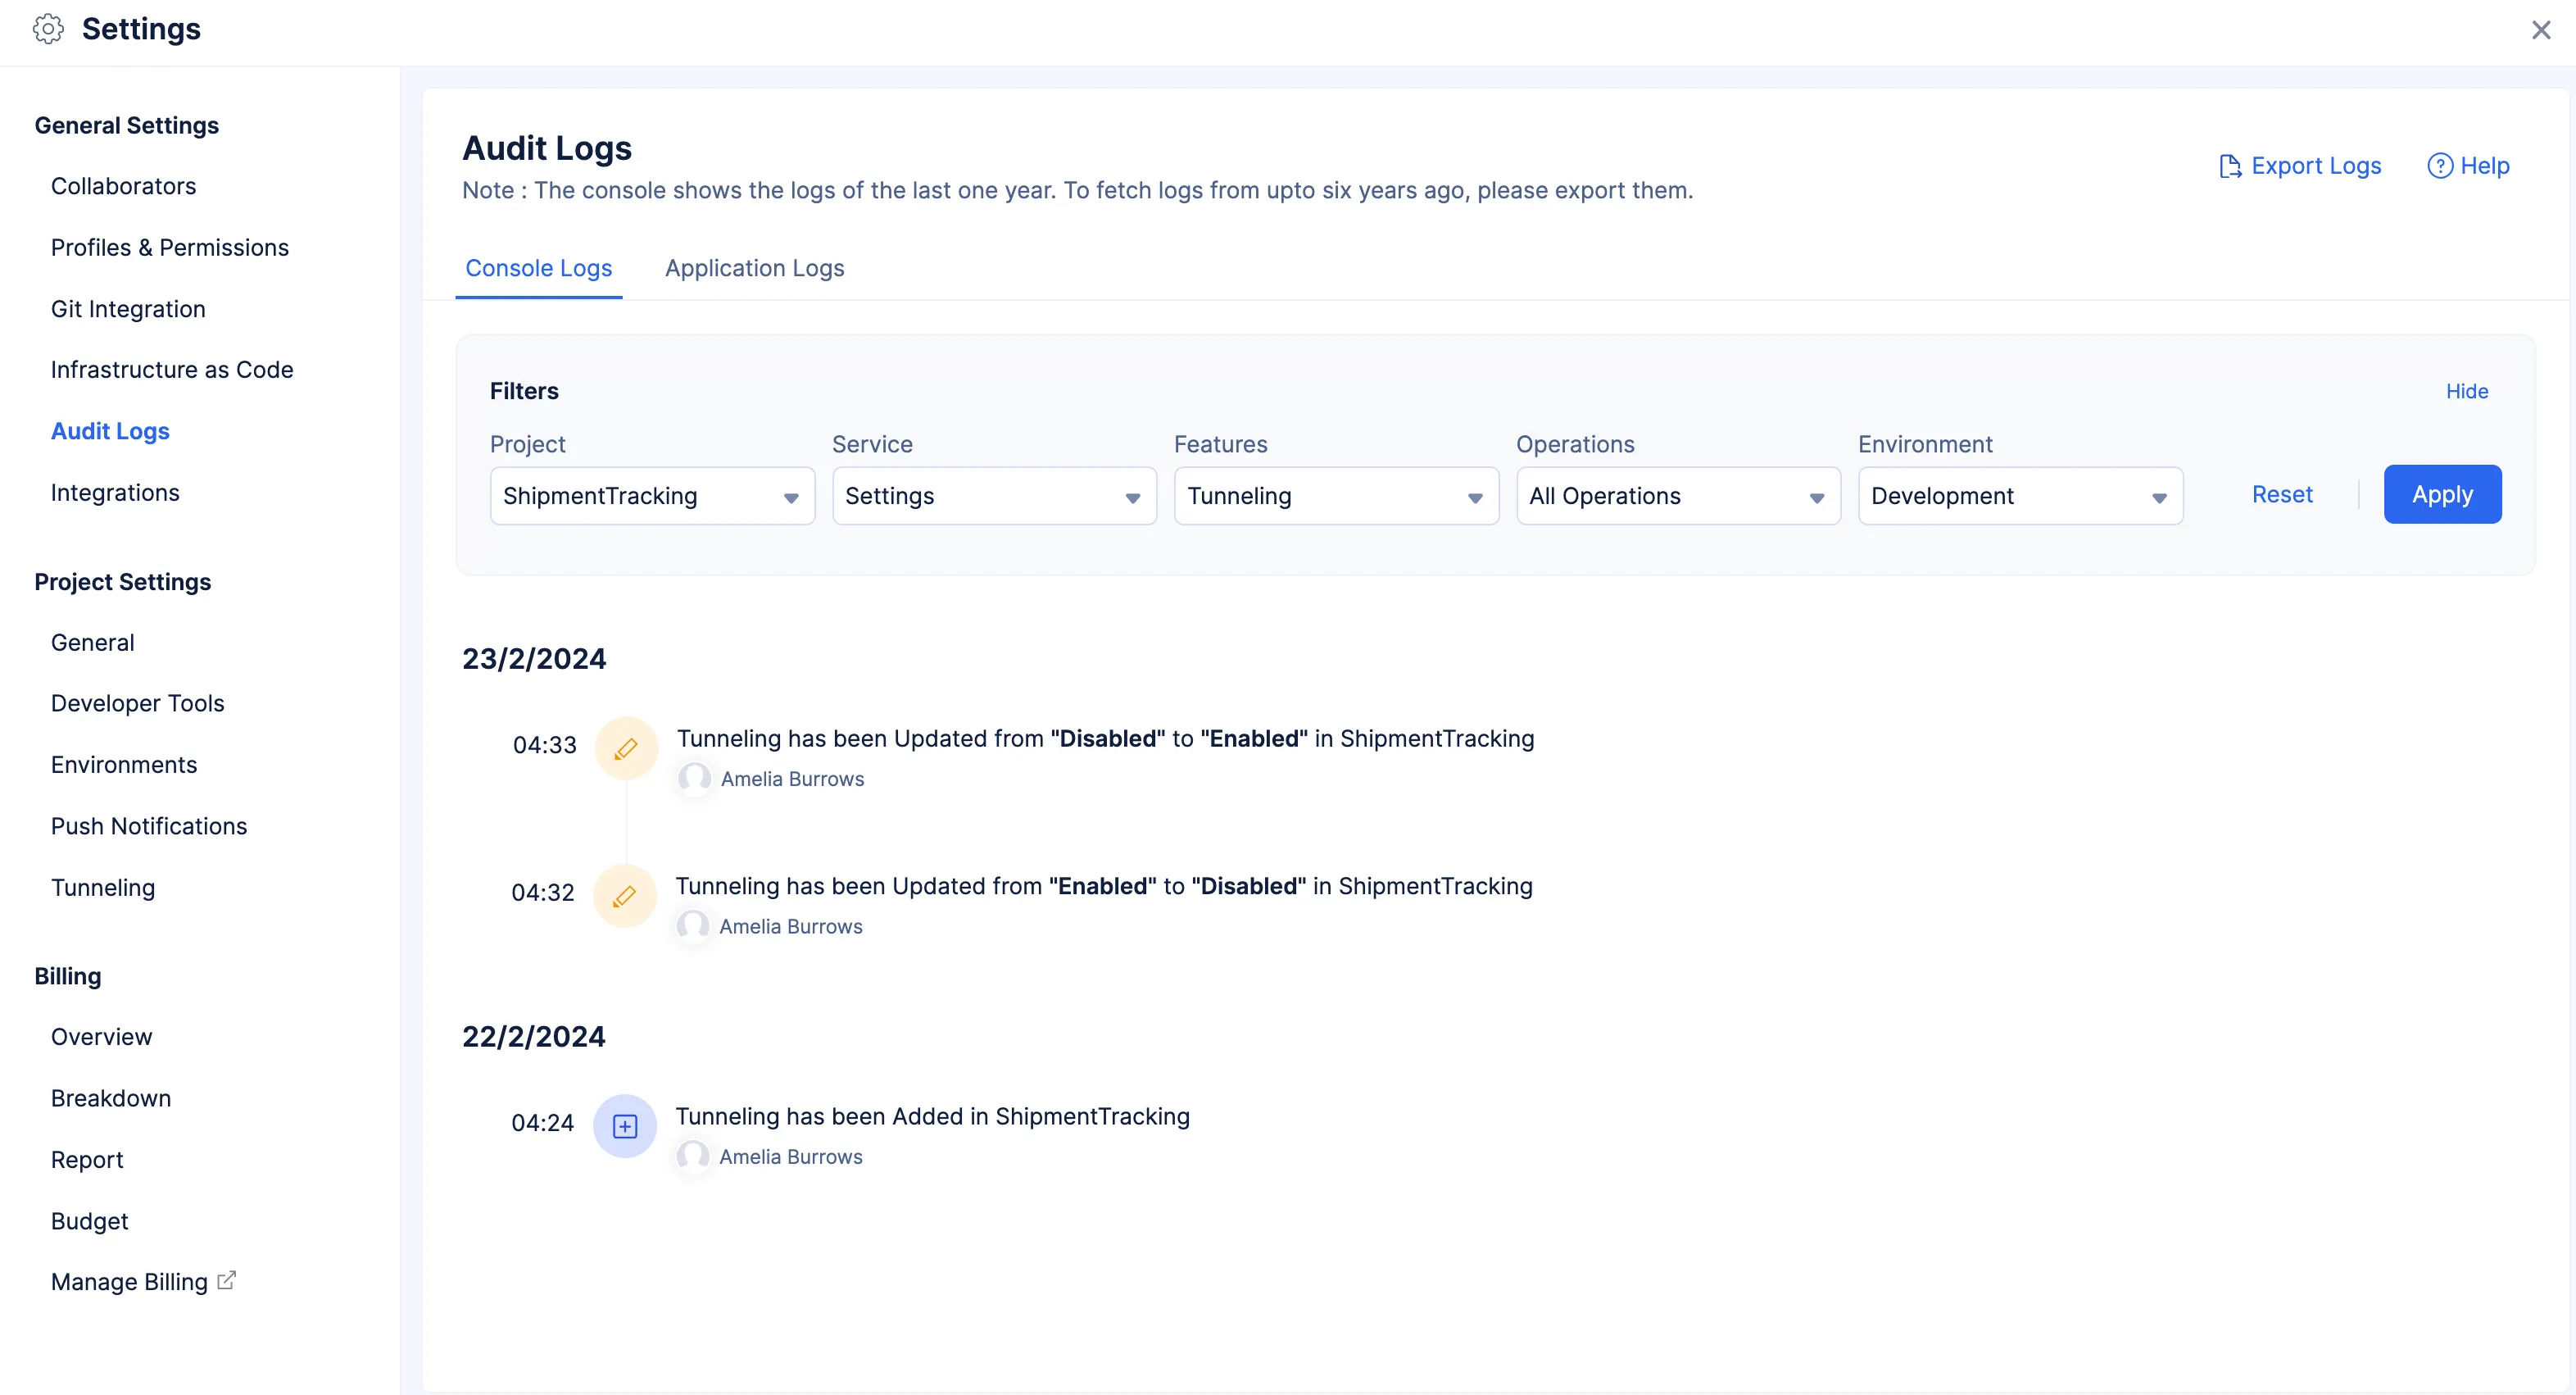
If you attempt to view the Execution History of the tunneled function present in the component’s section, it will be clearly indicated that the function has been tunneled.
If you further click the view-logs icon, you will be able to view details such as when and by whom the tunneling was enabled, and disabled.
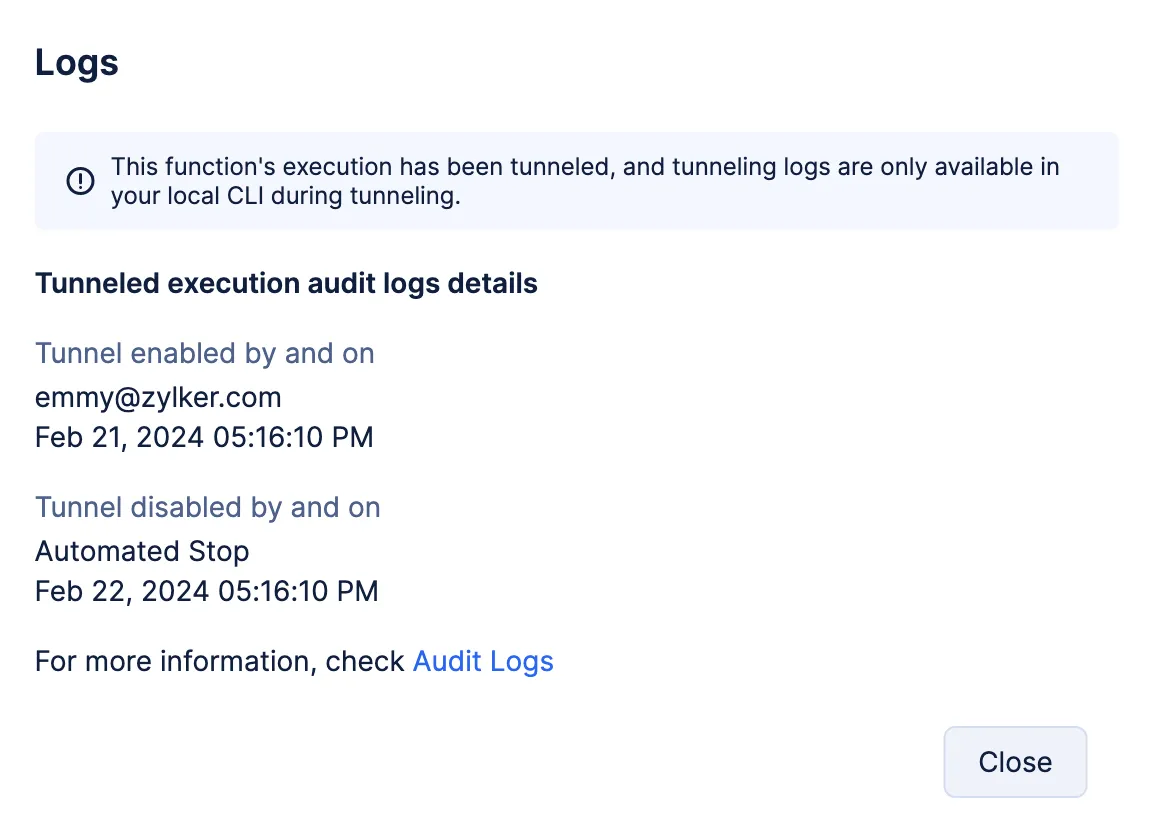
The same information can be found in the Audit Logs.
Now, execute the following CLI command to tunnel and debug your functions:
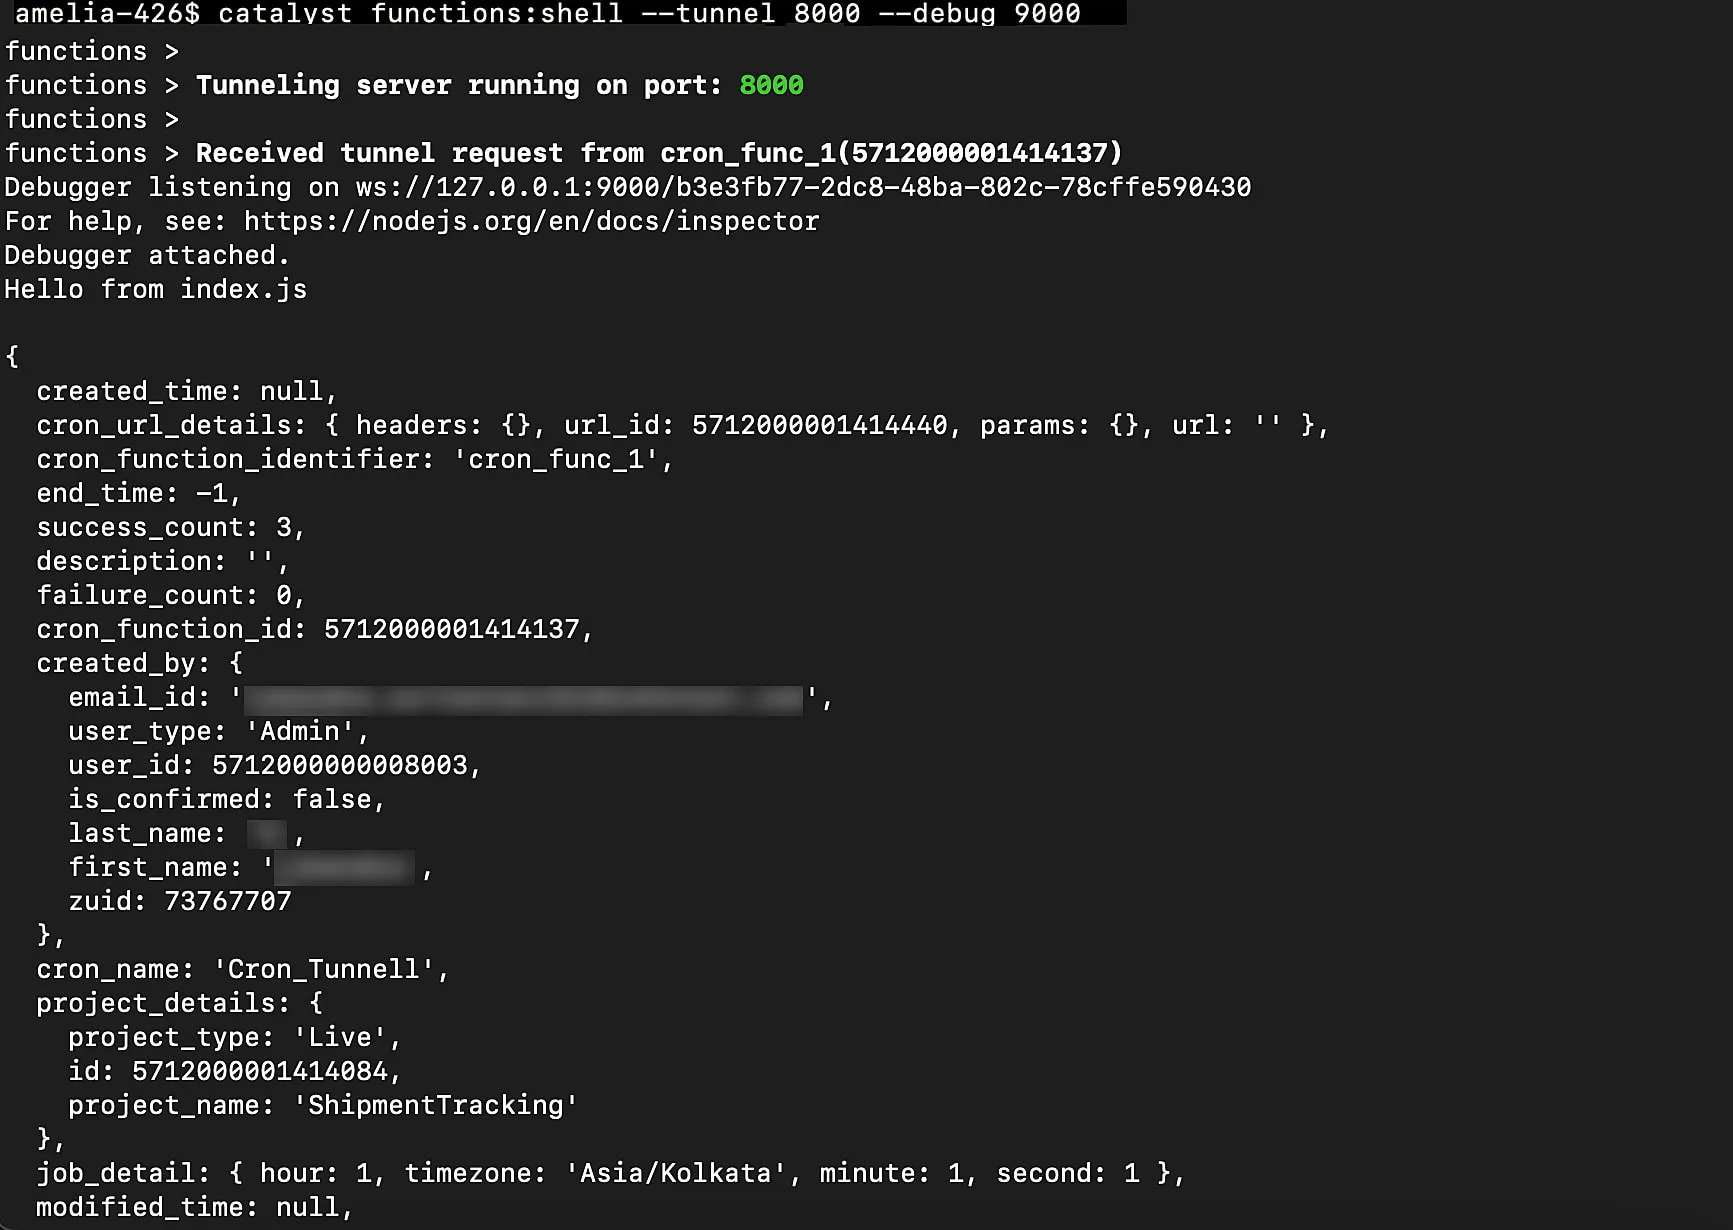
If you tunnel your function and choose to debug, you have to implement additional IDE configurations. You can find the steps to configure your IDE’s debugger for debugging tunneled functions from this section.
Last Updated 2025-08-28 12:01:44 +0530 IST
Yes
No
Send your feedback to us