Configure IDE to Debug Python Functions
For the purposes of this help documentation we are going to illustrate how to configure debugging preferences of Python non-HTTPS and Integration functions in Visual Studio Code.
If you wish only to tunnel your functions and you have used the following CLI command then no IDE configurations is required.
This command will only tunnel your functions and publish the logs of the functions in the Catalyst CLI.
Configure your VS Code IDE’s debugger in the following manner:
-
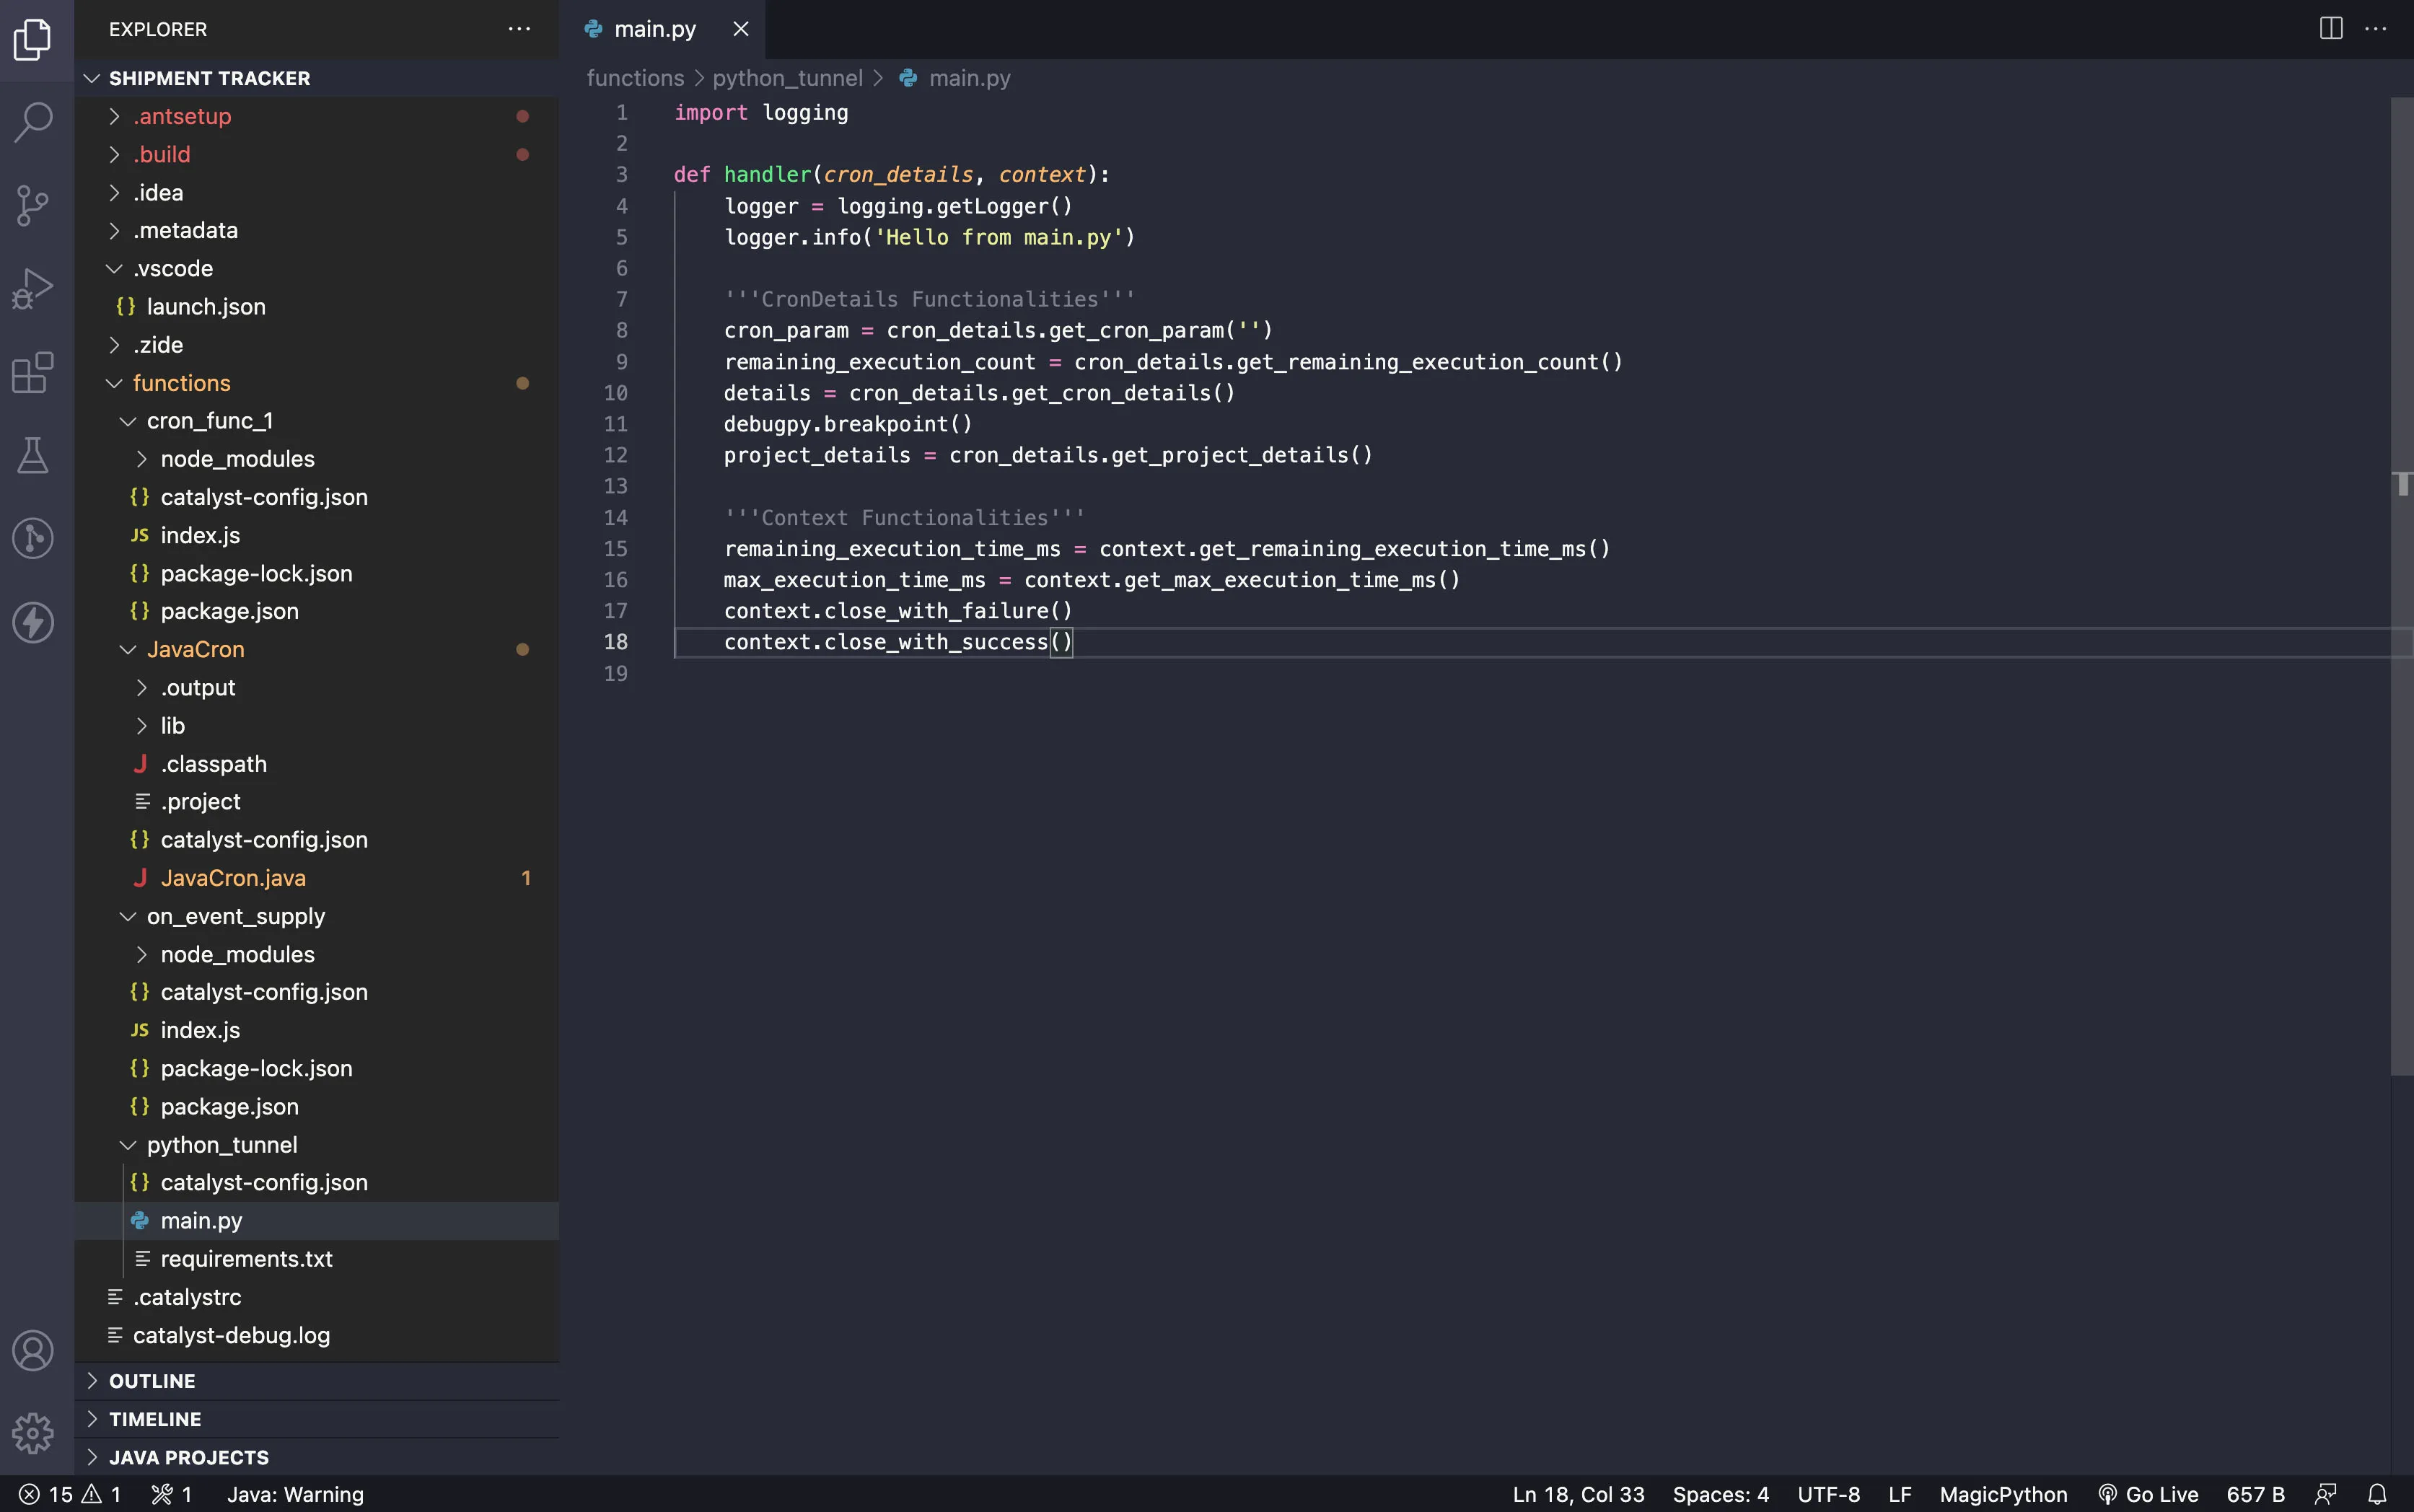
Ensure you have all the functions you need to debug in the local machine, and open the concerned project in VS Code.
-
Click the Run/Debug button present in the menu-bar and create a launch.json file, by clicking the “create a launch.json file” option.
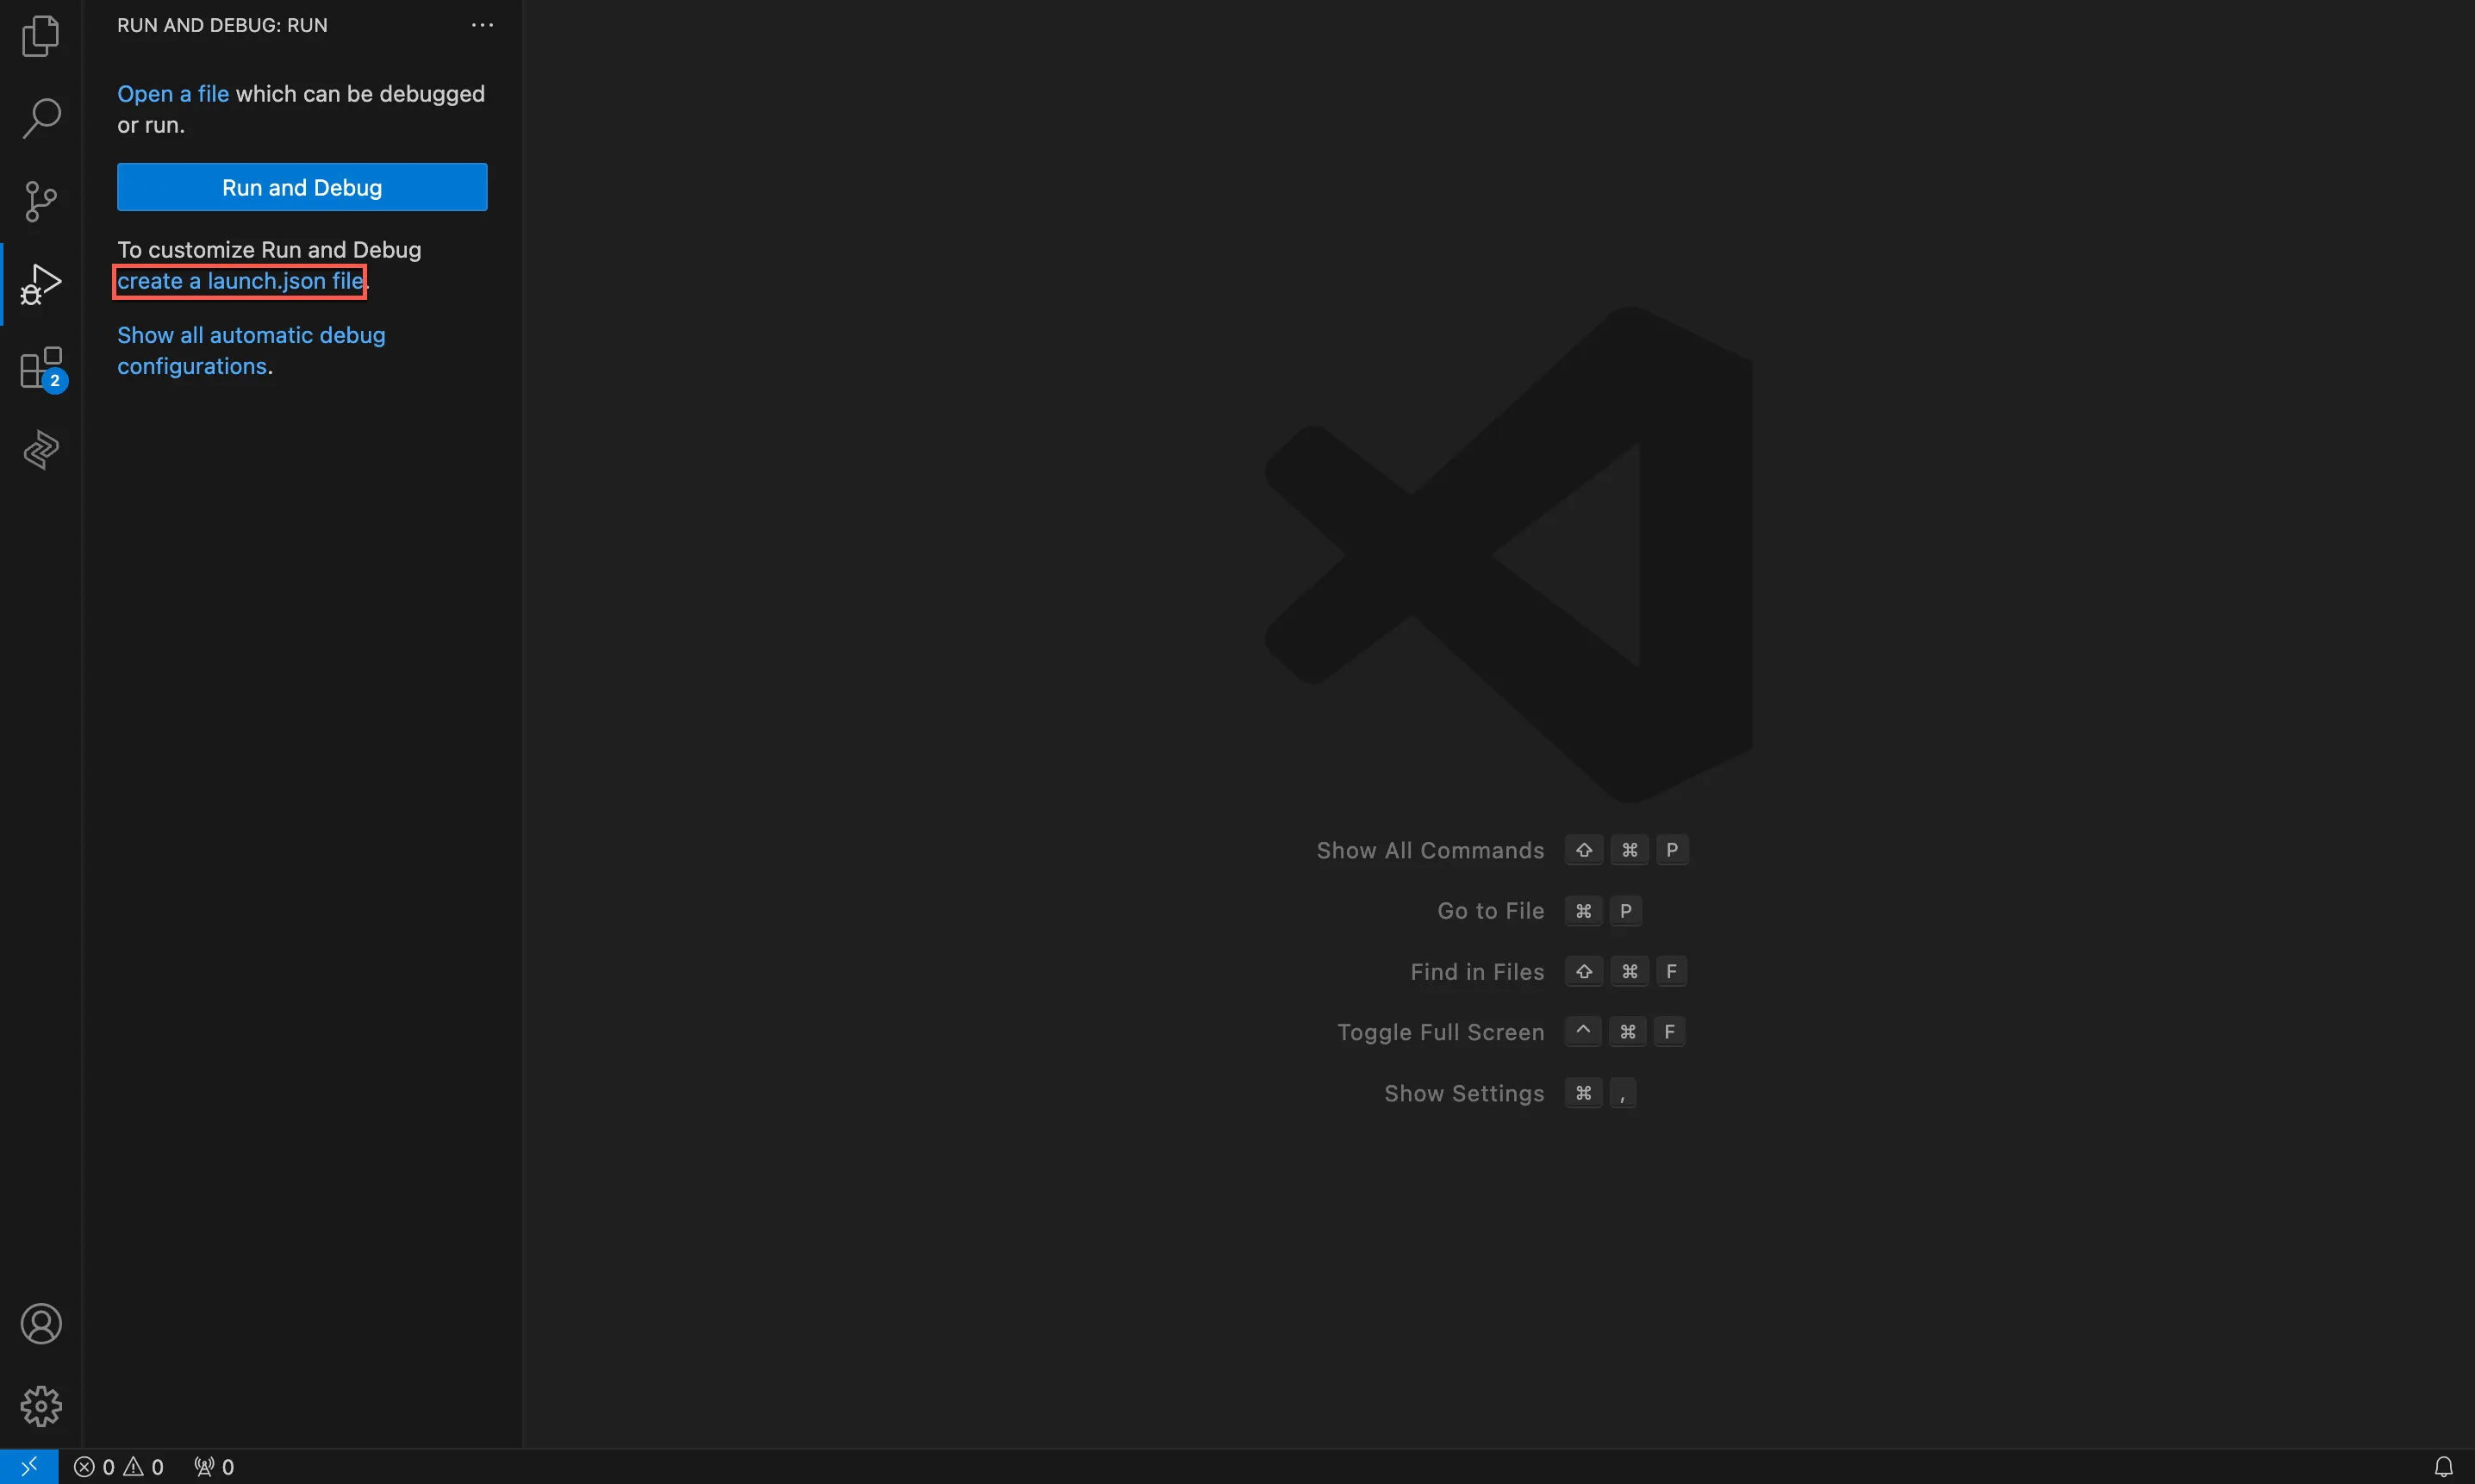
This is how the launch.json file appears before you begin configurations.
- Copy the JSON snippet below and paste it as value in the “configurations” JSON key.
"configurations":[{
        "name": "Python: Current File",
        "type": "debugpy",
        "request": "attach",
        "connect": {
            "host": "127.0.0.1",
            "port": 9001 //the debug port number which you have specified in the catalyst functions:shell --tunnel 8001 --debug 9001.
        },
        "justMyCode": true
}],
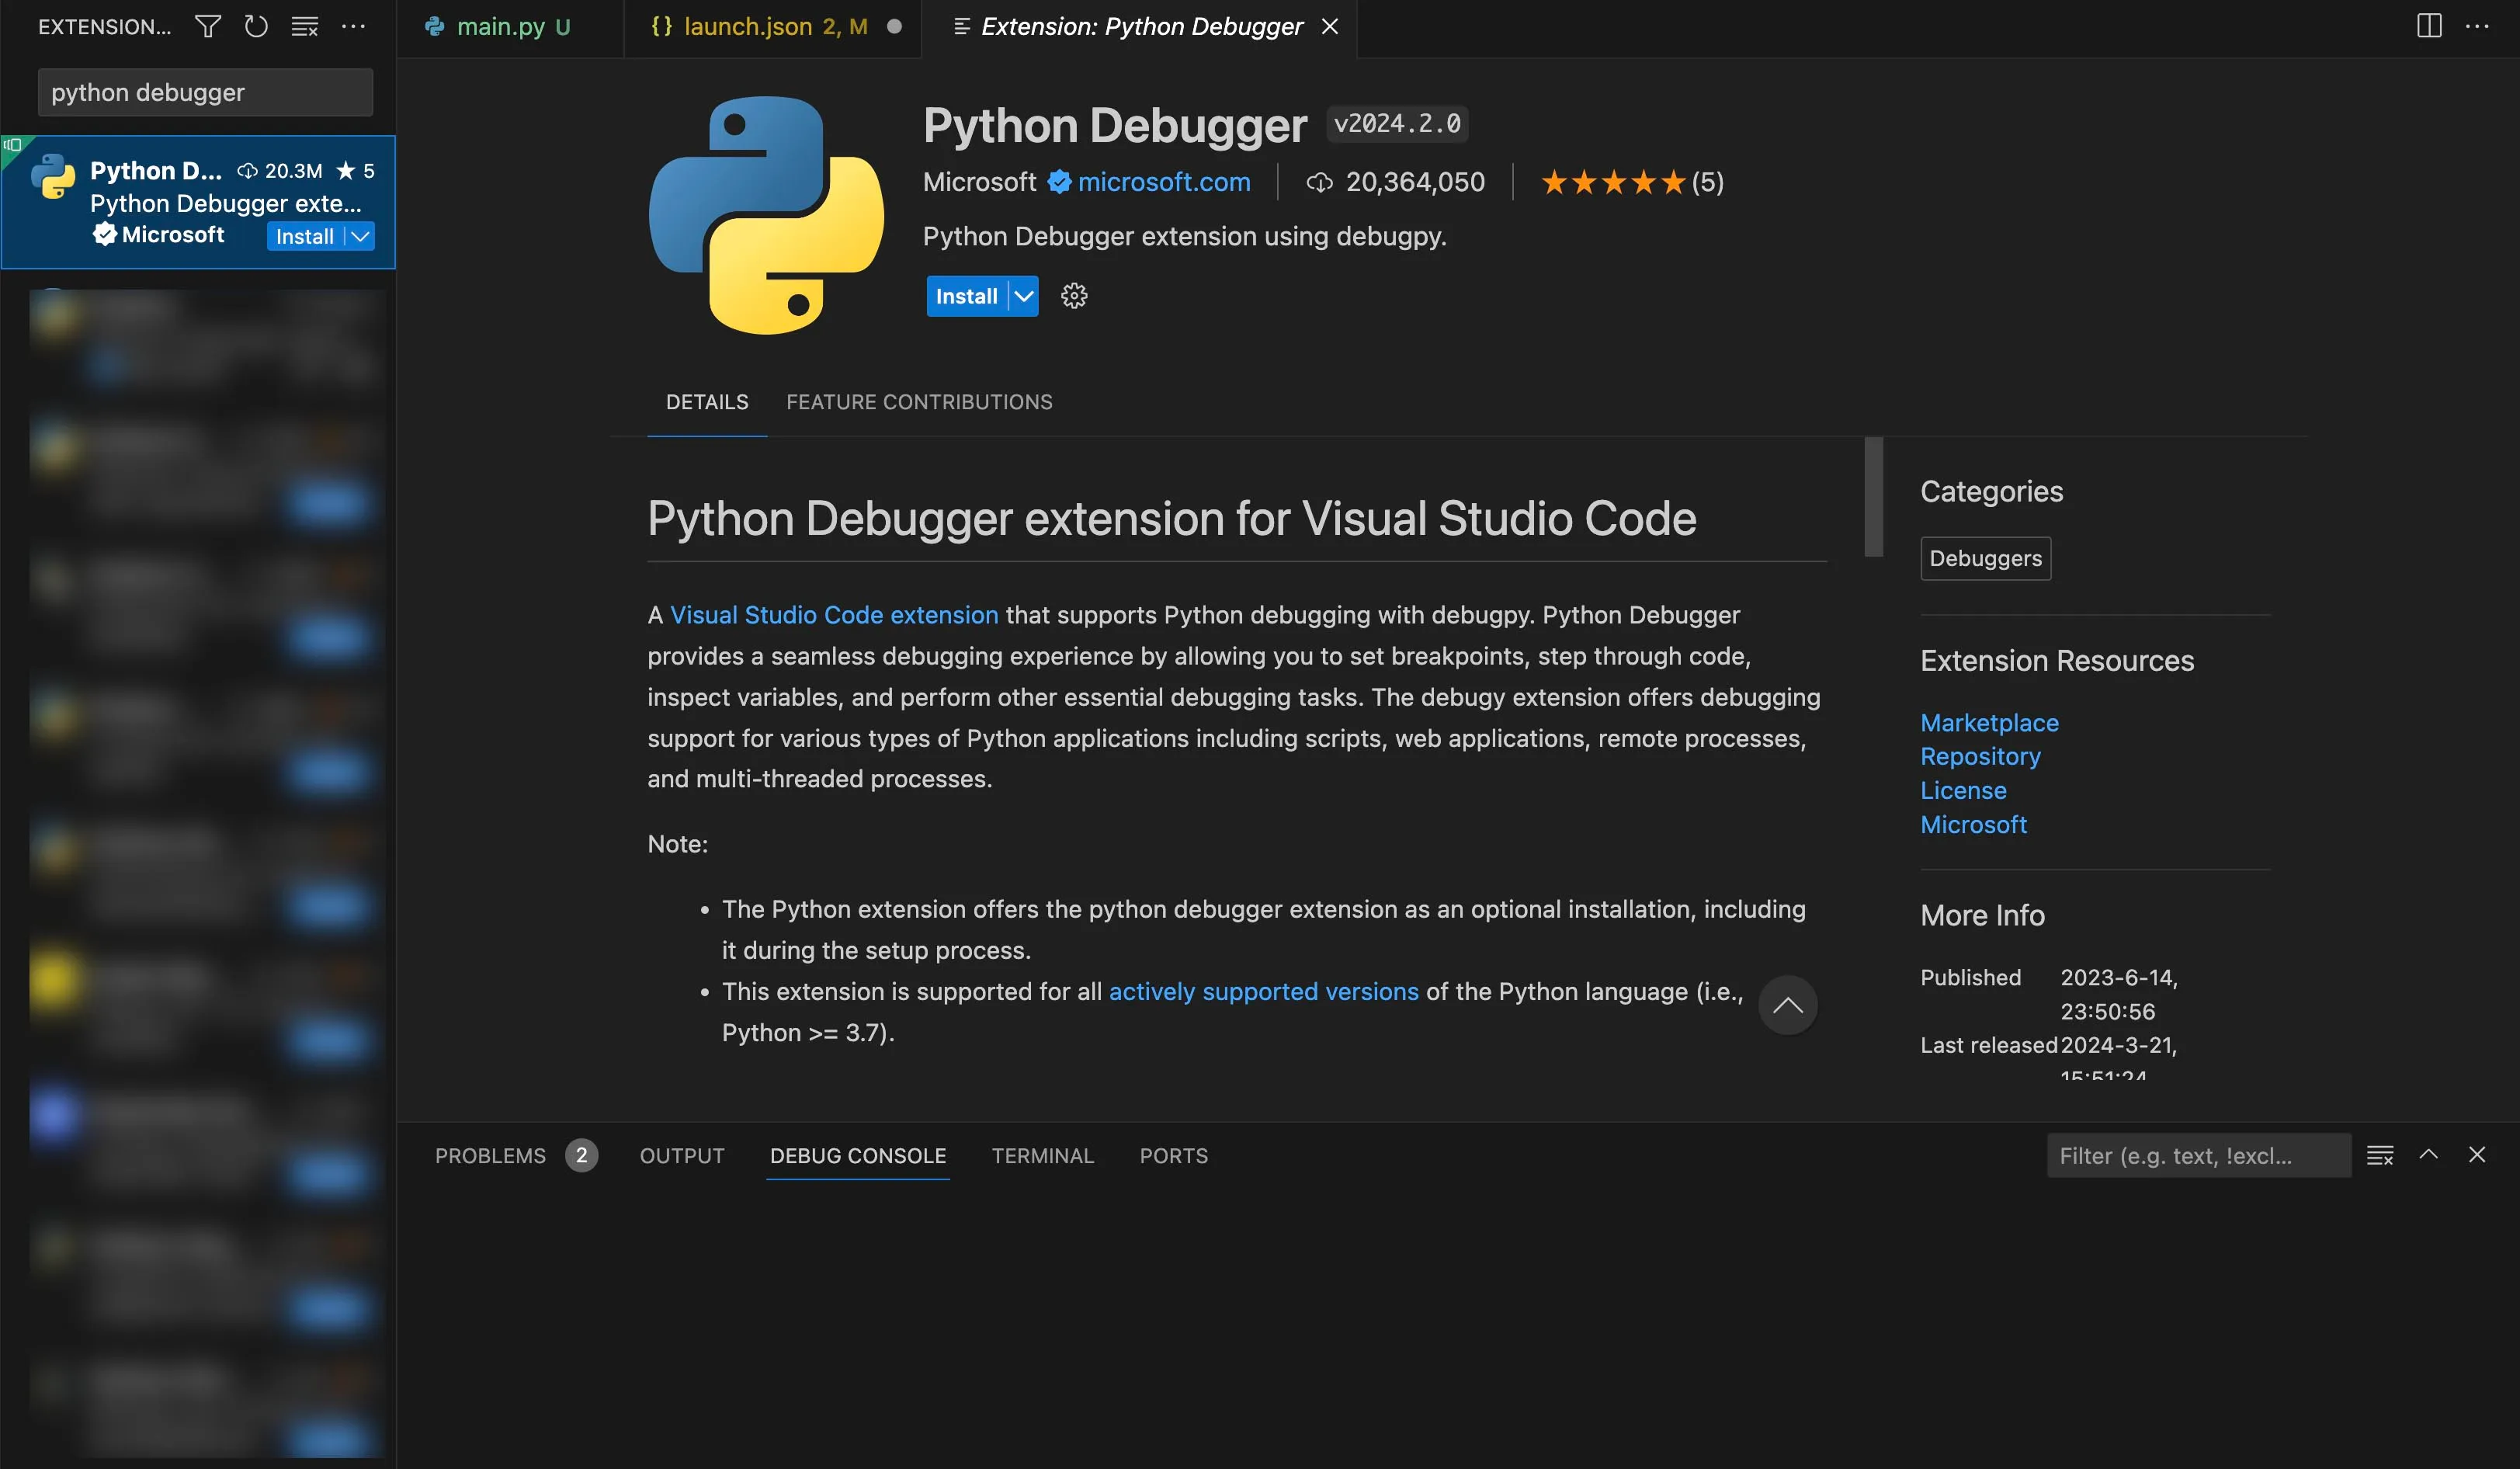
- Install the Python Debugger VS Code extension to be able to debug python fuctions in Visual Studio Code IDE.
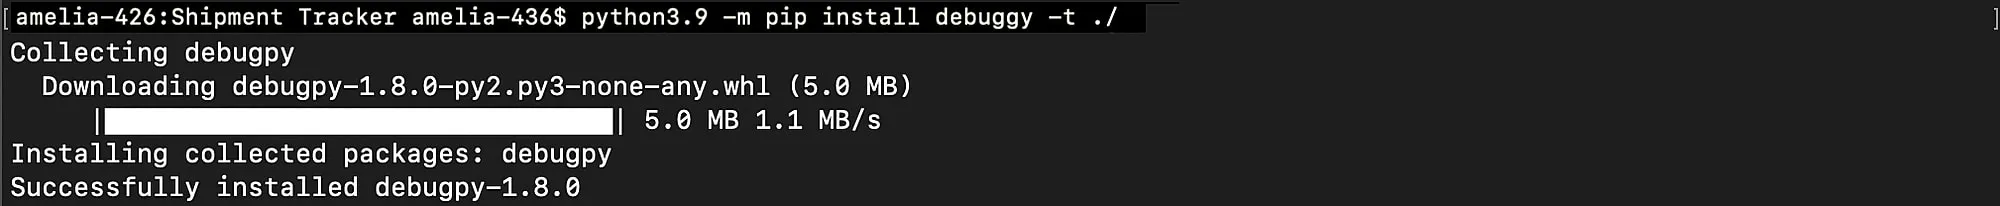
- Install debugpy in the Python function’s source directory using the following command:
- Copy the following code lines and paste them in the very beginning of your function code:
import debugpy
  debugpy.listen(9001) #specify the port for debugging
    print("Waiting for debugger to attach")
    debugpy.wait_for_client()
    print("debugger attached")
- Use the debugpy.breakpoint() function anywhere in the main python code file to introduce a breakpoint.

Last Updated 2025-11-19 20:37:41 +0530 IST
Yes
No
Send your feedback to us