Configure IDE to Debug Node.js Functions
For the purposes of this help documentation we are going to illustrate how to configure debugging preferences of Node.js non-HTTPS and Integration functions in Visual Studio Code.
If you wish only to tunnel your functions and you have used the following CLI command then no IDE configurations is required.
This command will only tunnel your functions and publish the logs of the functions in the Catalyst CLI.
Configure your VS Code IDE’s debugger in the following manner:
-
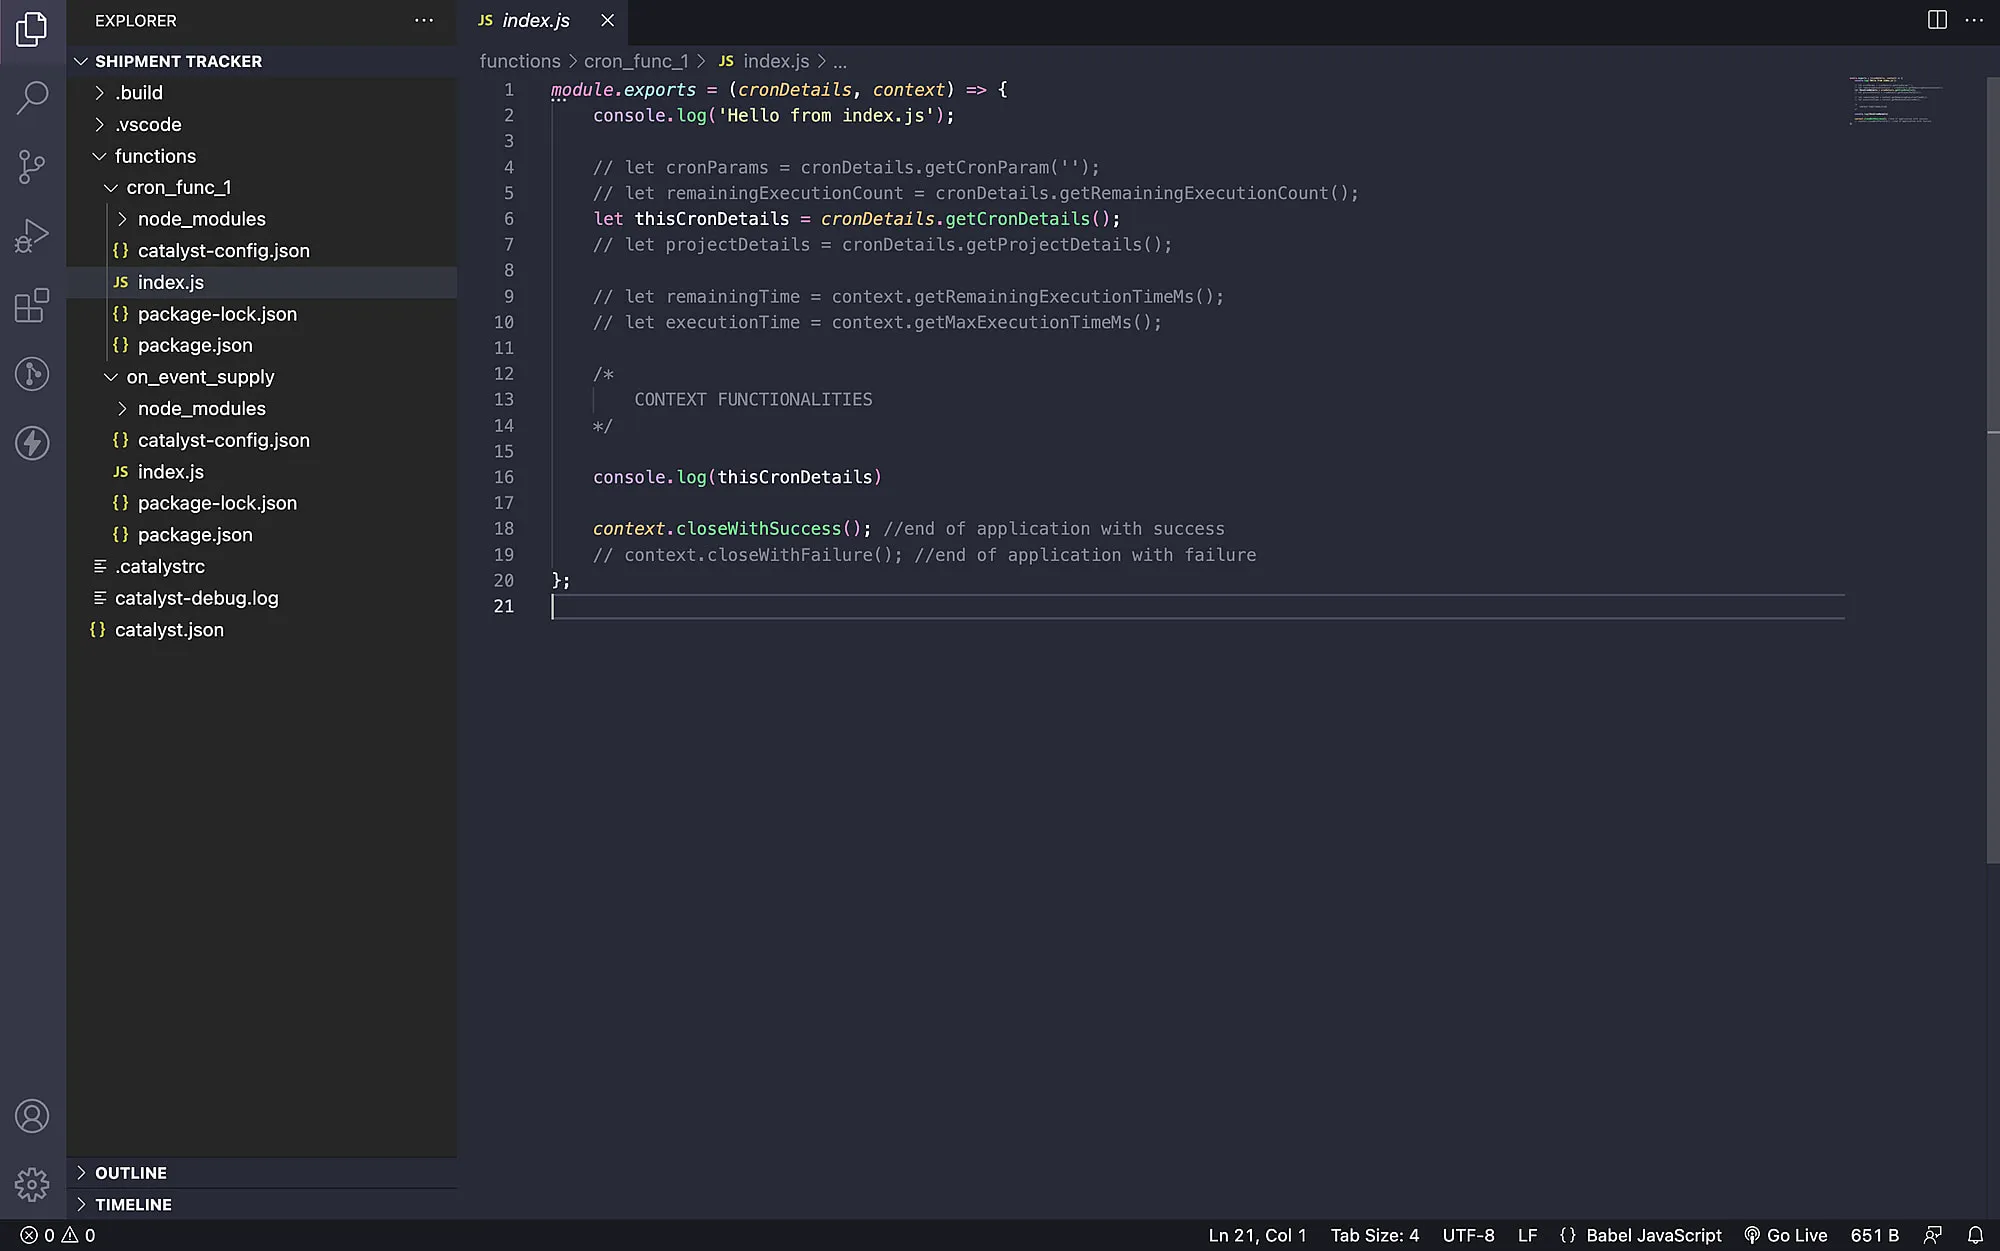
Ensure you have all the functions you need to debug in the local machine, and open the concerned project in VS Code.
-
Click the Run/Debug button present in the menu-bar and create a launch.json file, by clicking the “create a launch.json file” option.
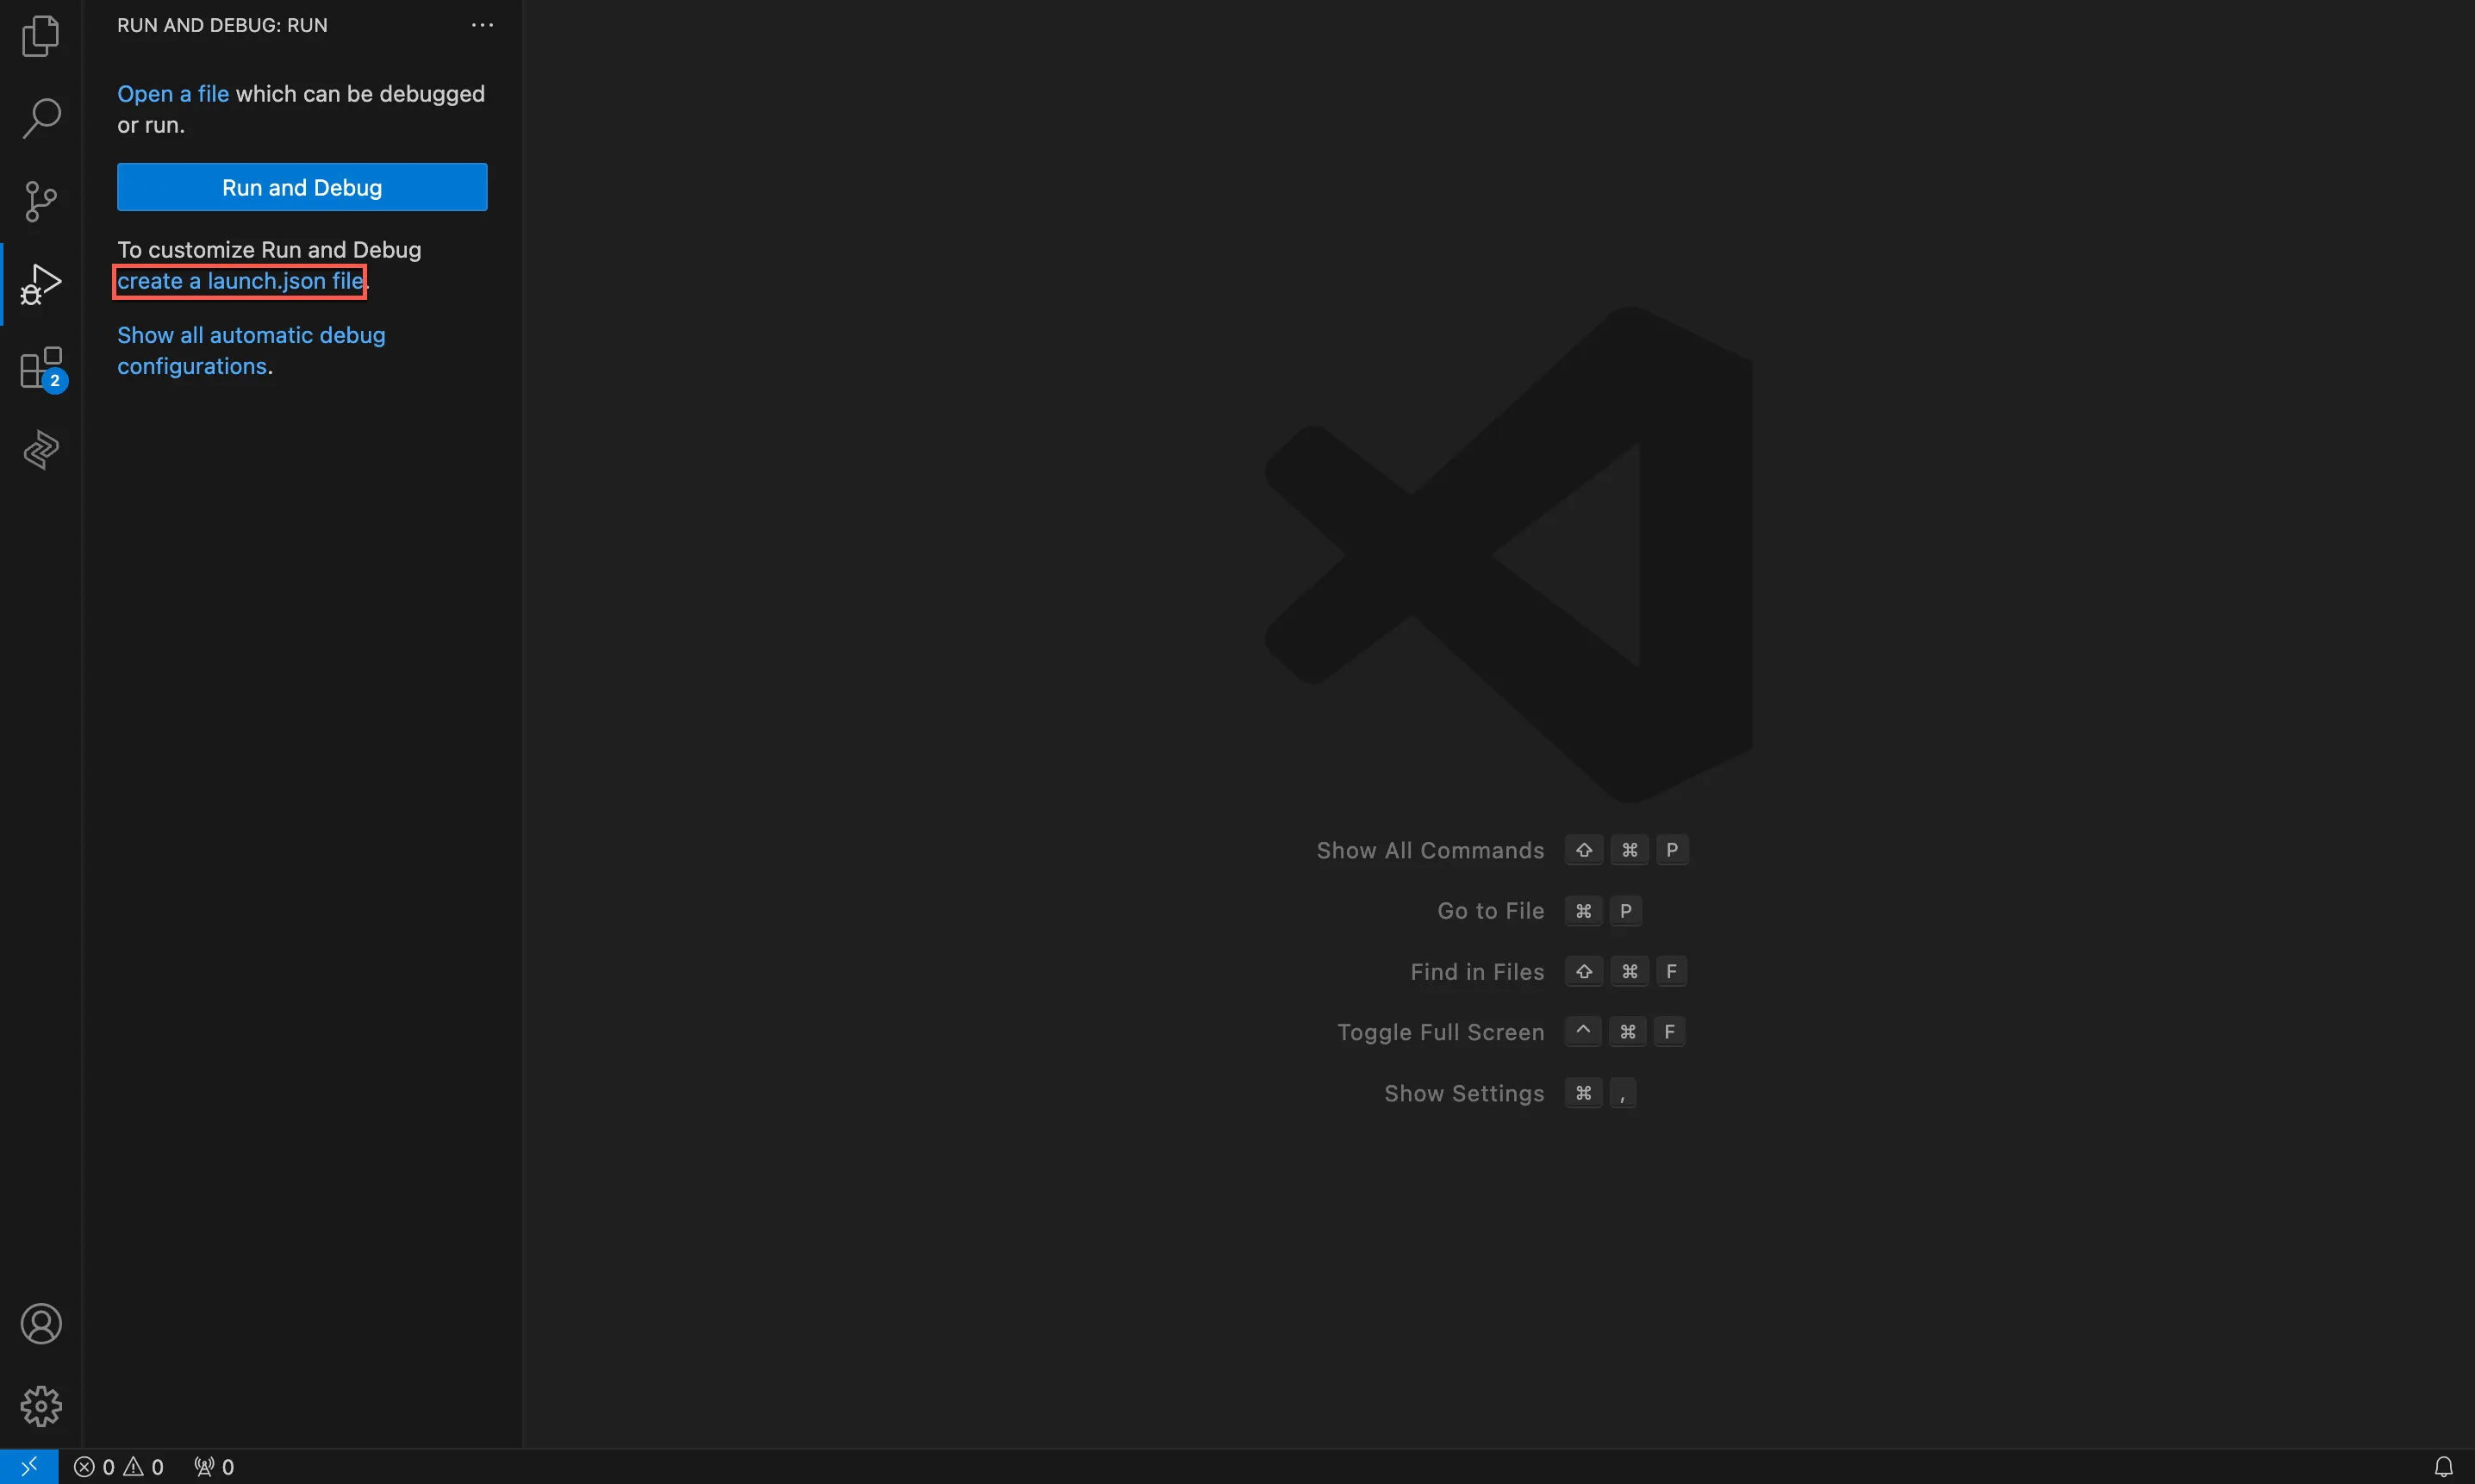
This is how the launch.json file appears before you begin configurations.
- Copy the JSON snippet below and paste it as value in the “configurations” JSON key.
"configurations": [{
			"name": "cron_fun",  // name can be any name but having the same function name will be helpful while debugging
            		"type": "node",
            		"request": "attach",
            		"address": "localhost",
          		  "port": 9001, // The debug port number you specified in the catalyst functions:shell --tunnel 8001 --debug 9001. The port number can be any number which is not being used by any other processes
            		"localRoot": "/Users/jack/tun_cli/functions/cron_fun" //Exact path where the function folder is present
    }],
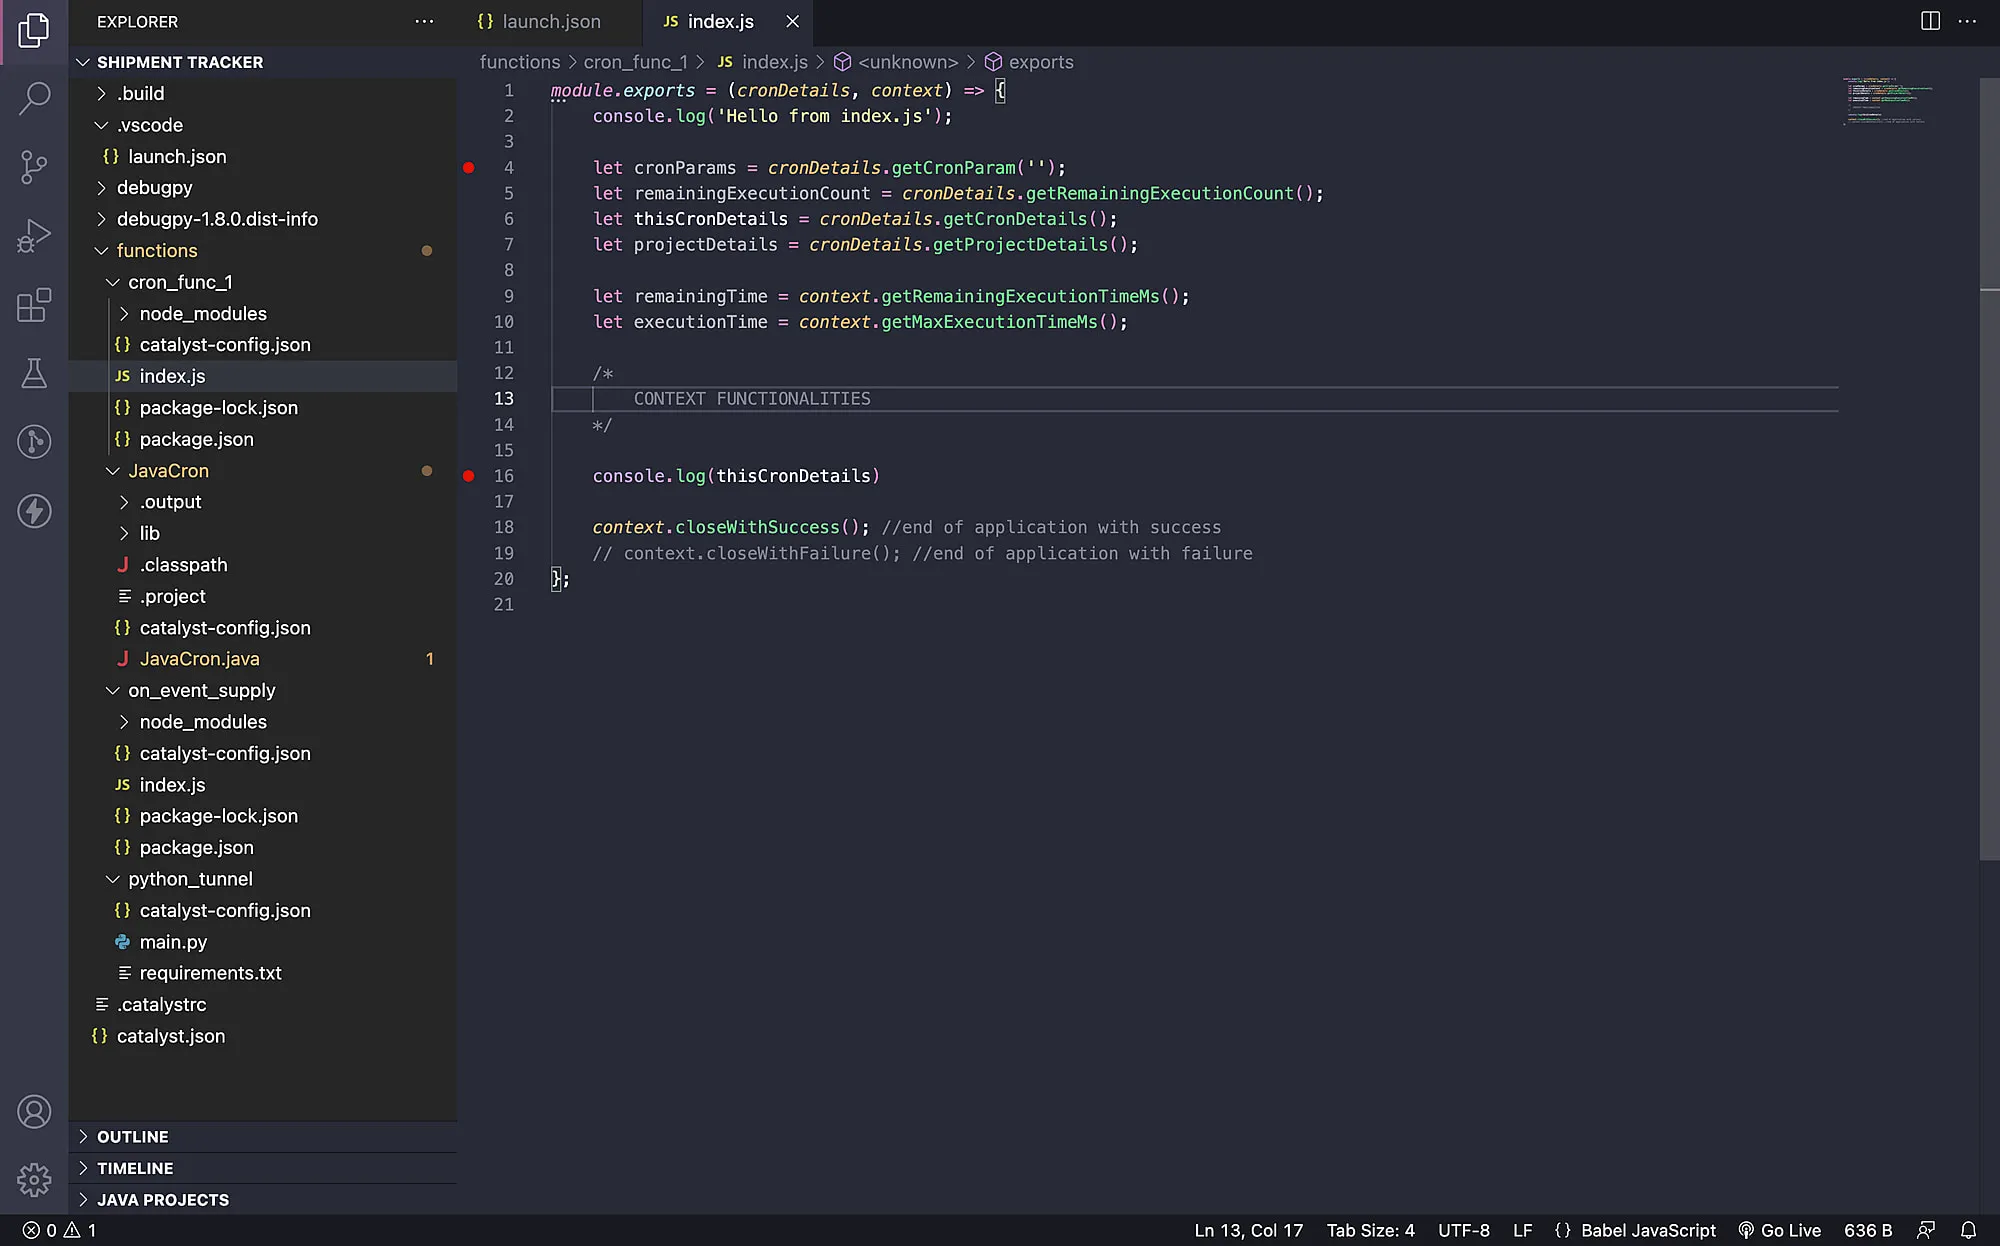
- Save this file and apply the breakpoints in your required lines of code and proceed to the next step.
Last Updated 2025-11-19 20:37:41 +0530 IST
Yes
No
Send your feedback to us