Debug Tunneled Node.js Functions
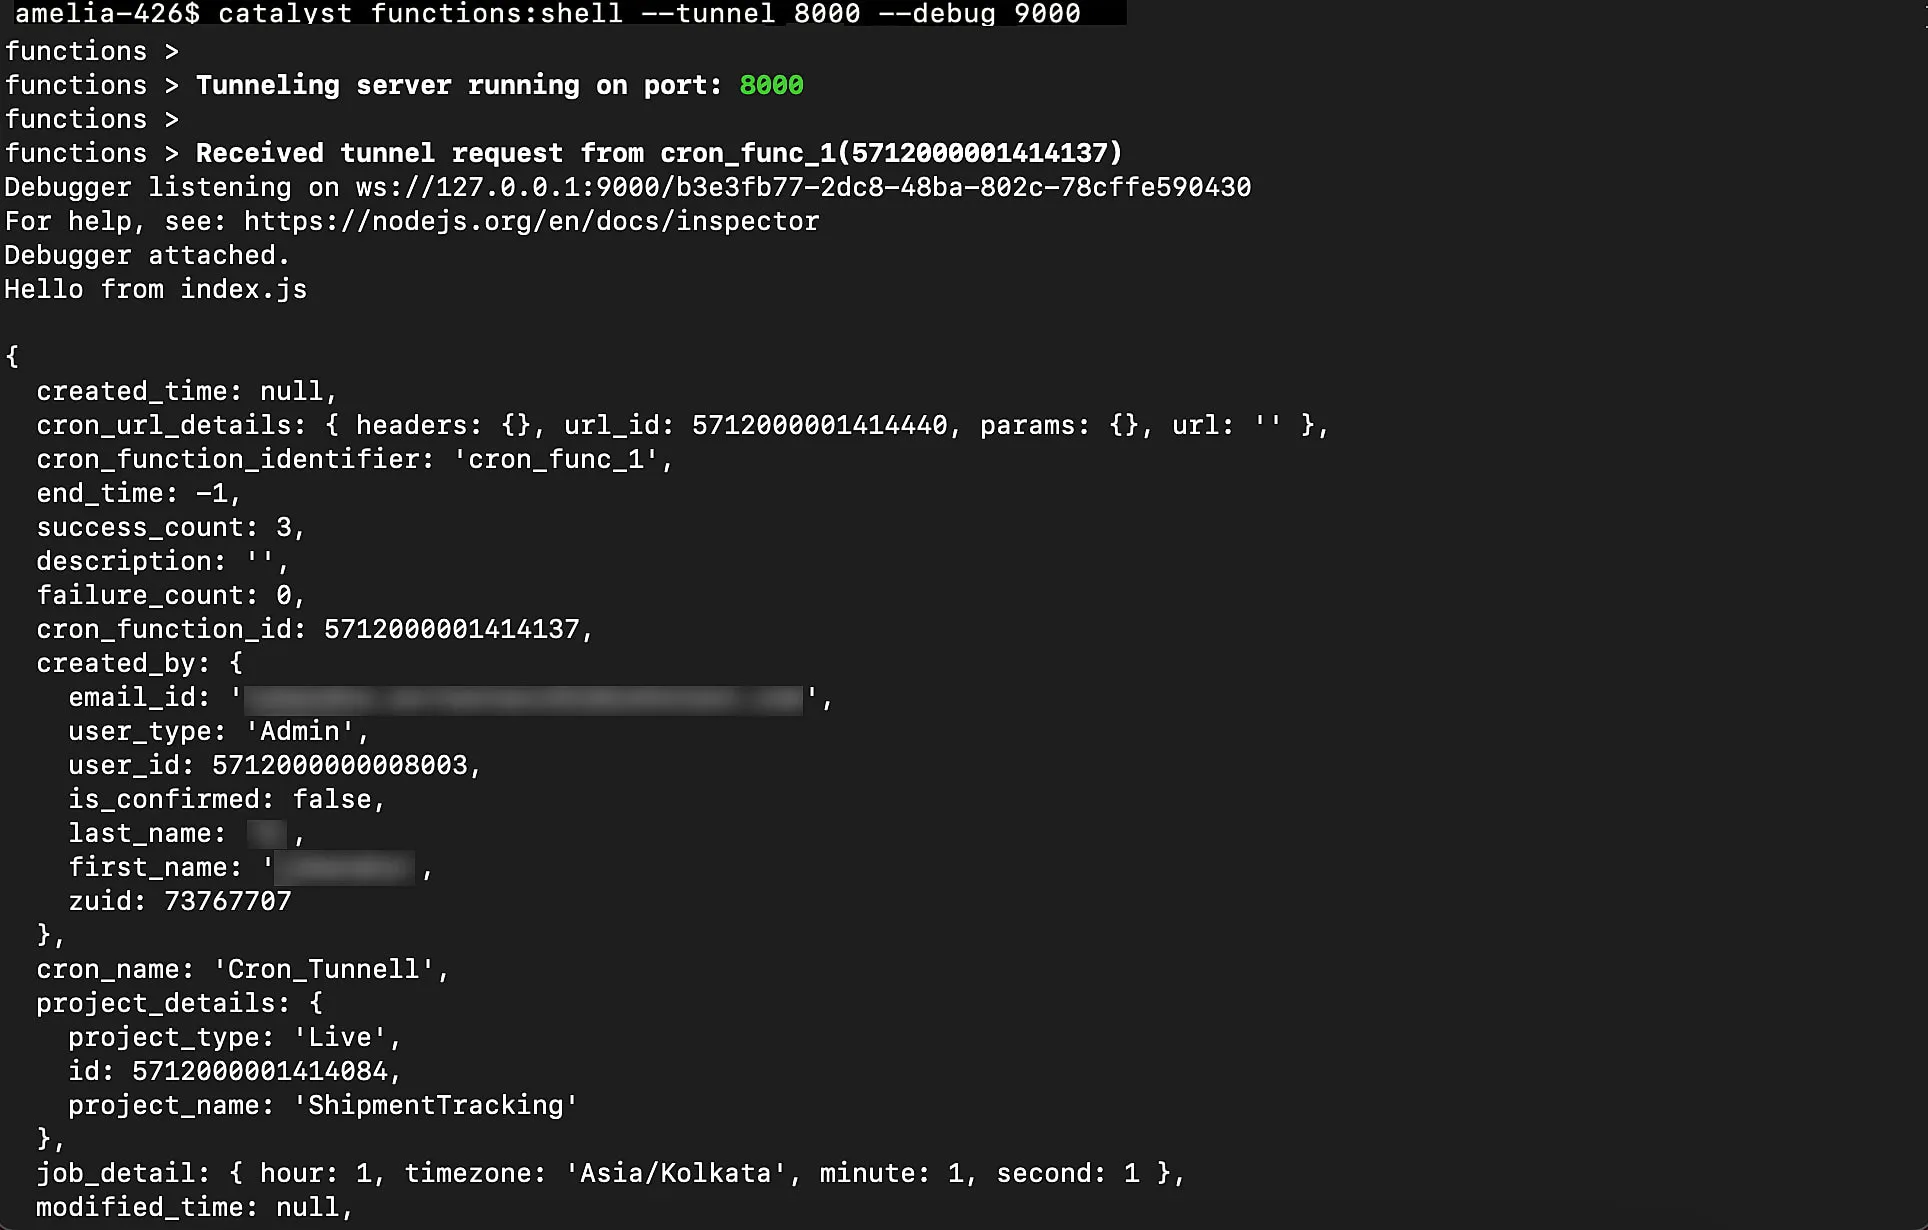
Trigger the tunneled functions in Catalyst web, and confirm that the debugger has been attached by viewing the Catalyst CLI, for a message resembling the one shown in the image below:
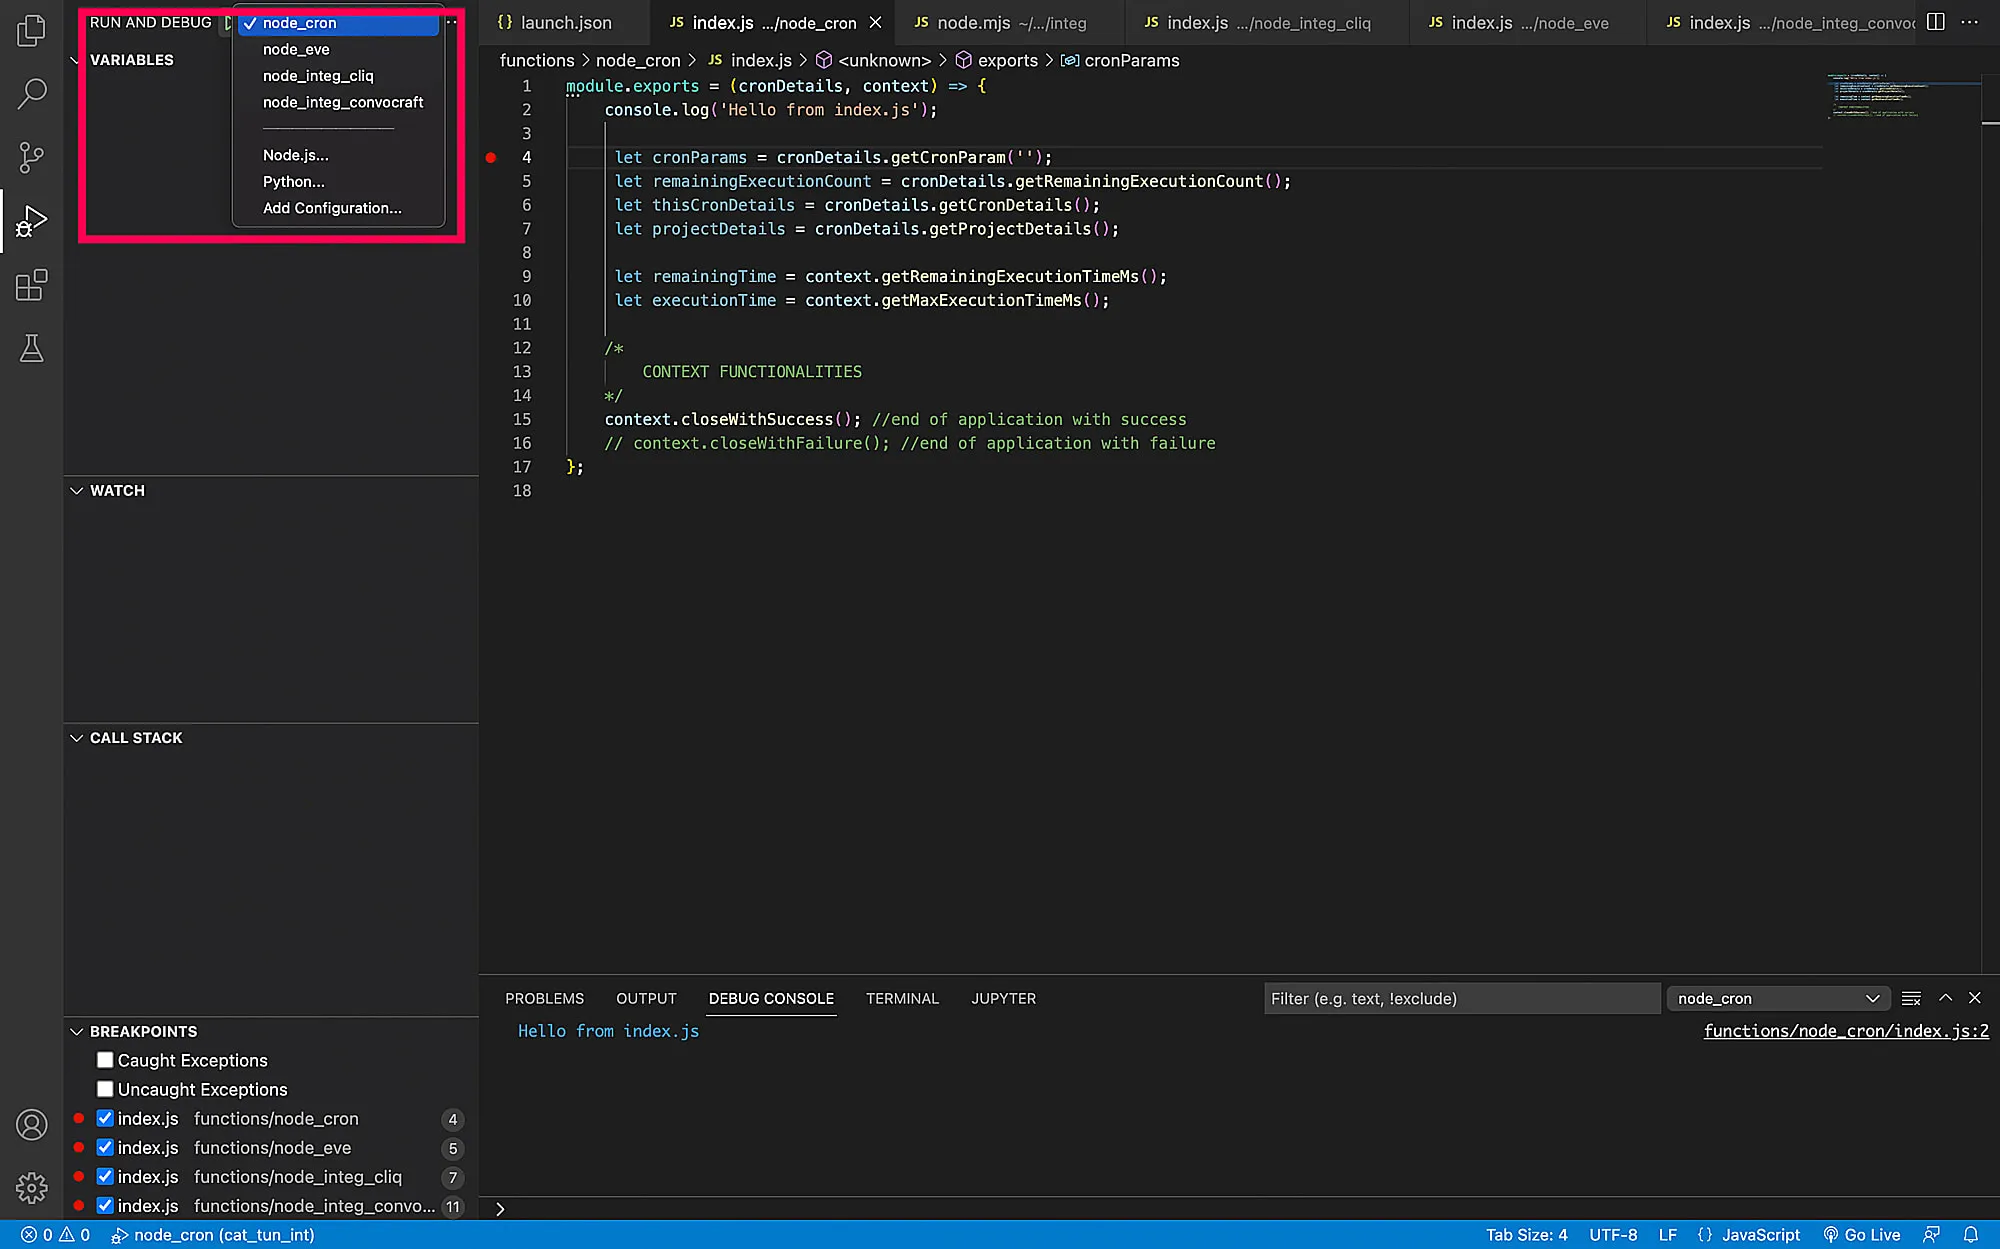
For the purpose of this help documentation, we aren going to ilustrate debugging of tunneled Node.js functions using Visual Studio Code IDE. Depending on the IDE you are using the following steps might vary.
-
Click the Run/Debug icon and select the functions you wish to debug.
-
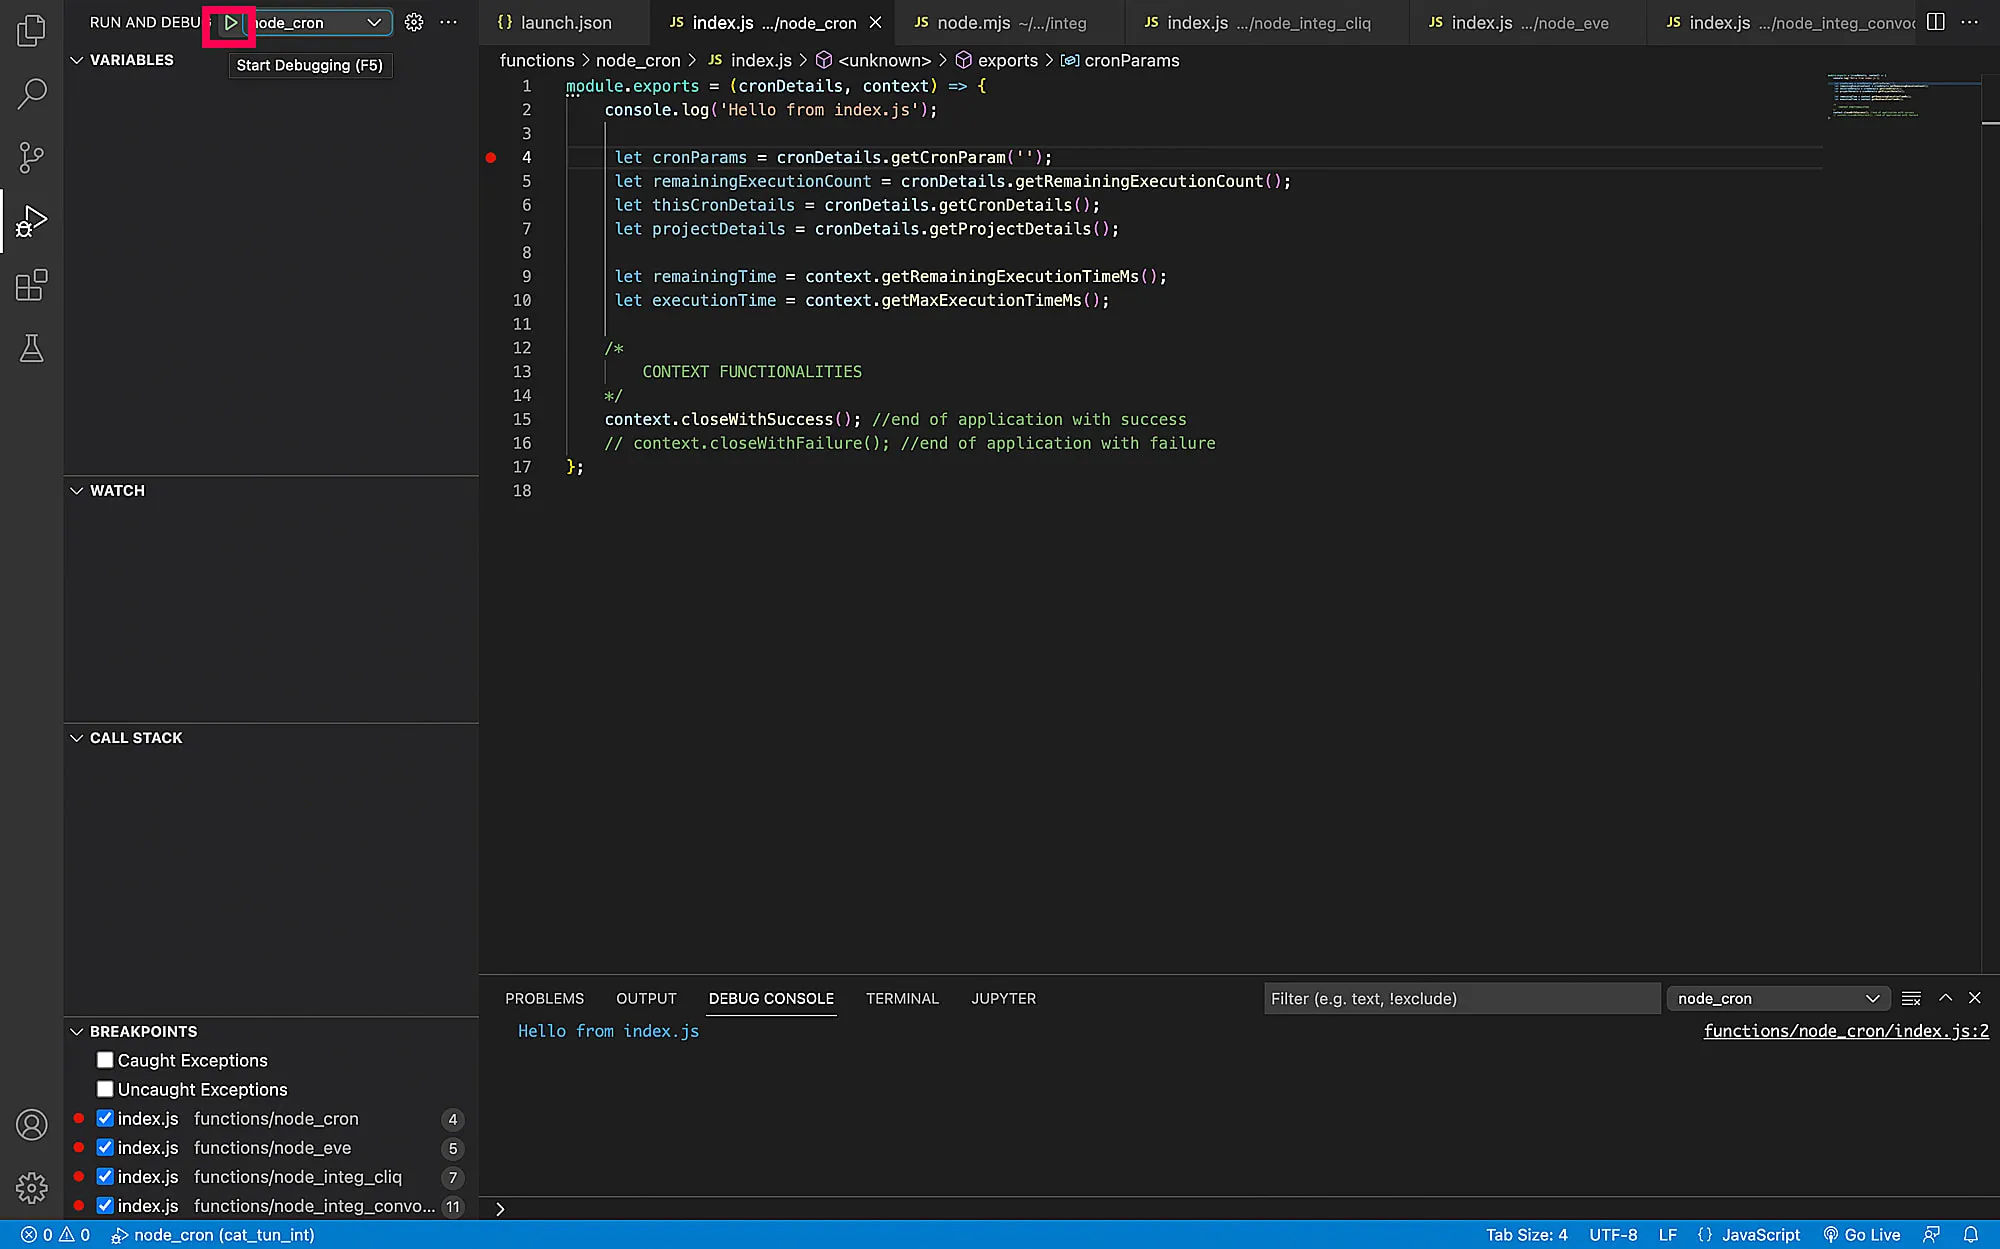
Click the Play button.
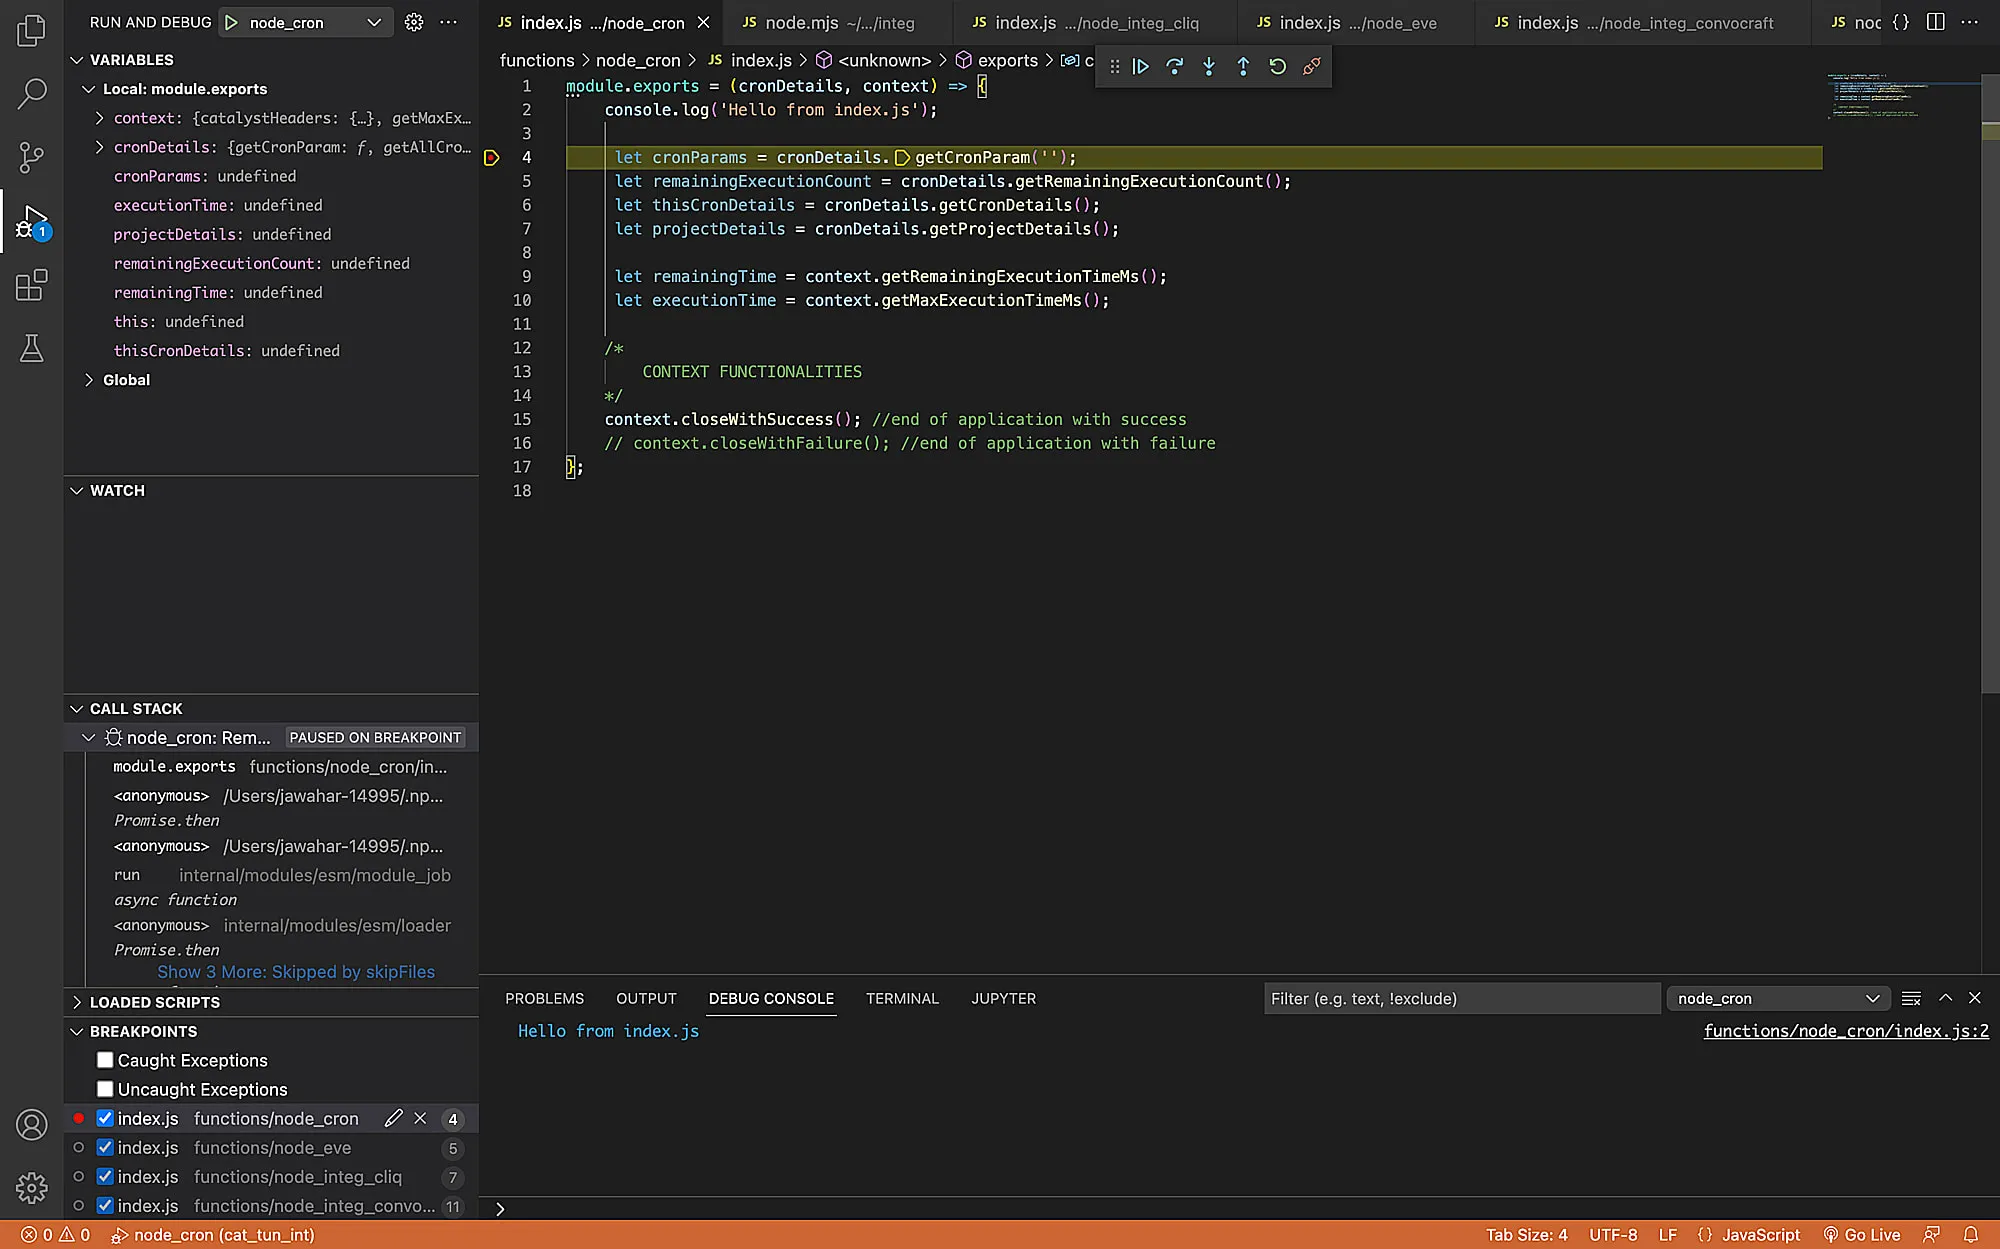
You can now easily debug your non-HTTPS and Integration functions.
Last Updated 2025-08-28 12:01:44 +0530 IST
Yes
No
Send your feedback to us
Skip
Submit