Architecture
The following diagram illustrates the backend operations involved in debugging the Catalyst non-HTTPS and Integration functions using Catalyst Tunneling:
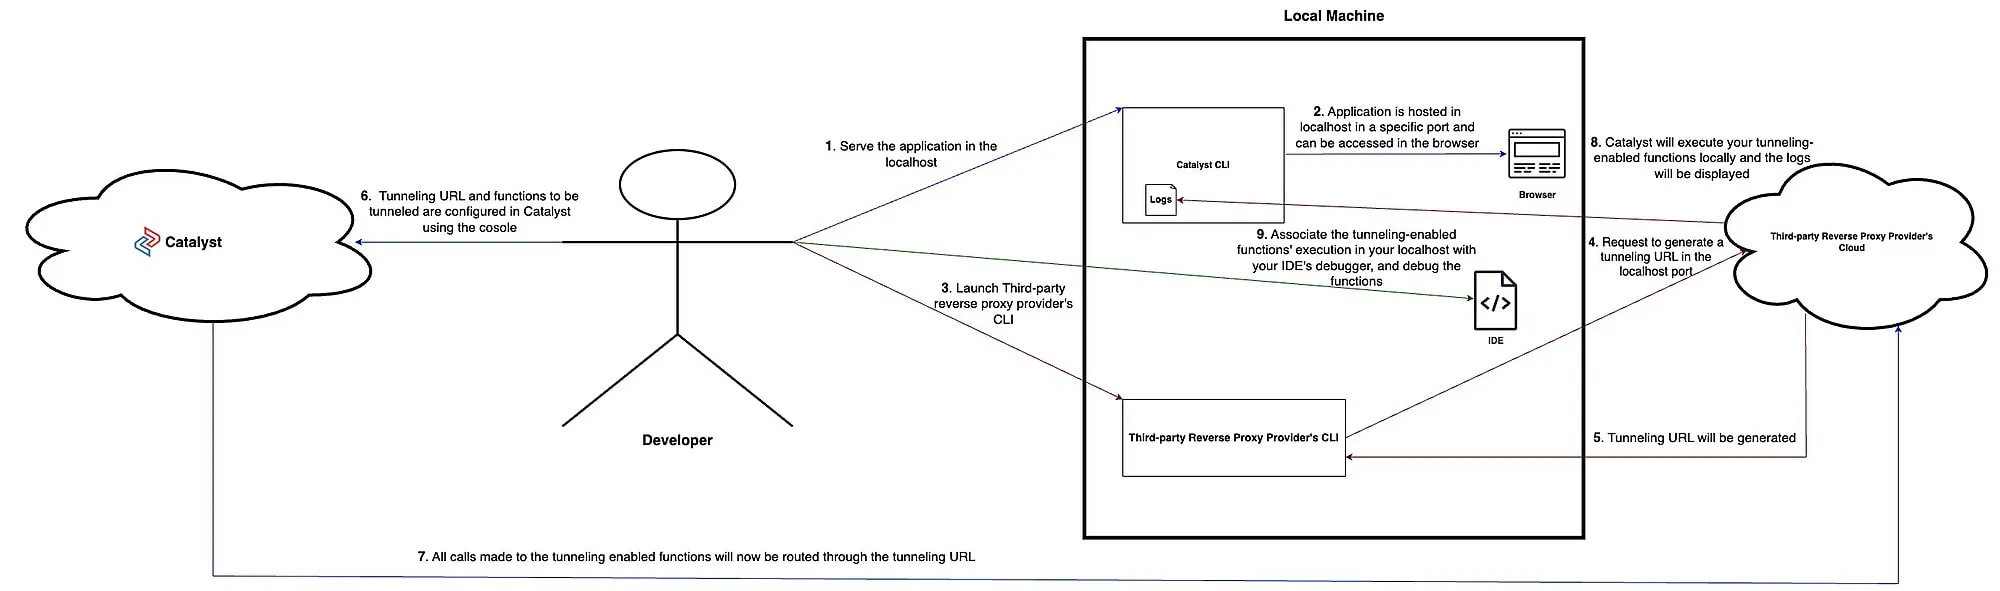
The steps below describe the workflow involved in debugging your non-HTTPS and Integration functions using Catalyst Tunneling:
-
In the Catalyst console, we will select the non-HTTPS or Integration functions for tunneling, and provide the Tunneling URL we generated using a third-party reverse proxy service and enable Tunneling.
-
We will then proceed to launch a function shell and start performing debugging operations using Catalyst Tunneling.
-
Now, every time you trigger the function using the Tunneling URL, the calls made will be routed to your local system and the logs will be present in the Catalyst CLI. Essentially, your local system acts as the server in which the tunneling-enabled functions are being executed.
This allows you to set break points in your code file, and debug your function with ease.
-
After a function is tunneled, the logs of their execution will only be available in the Catalyst CLI, and fundamental information such as when and by whom the tunneling was enabled will be available in the Audit Logs section present in the console.
-
While you can select multiple functions to tunnel, only when the debugging of the first function is completed will you be able to start debugging the next function. As of the current update, only this type of synchronous debugging of functions is possible.
-
Steps to configure the debugger of some of the more popular IDEs, such as Visual Studio Code, IntelliJ, and so on, to debug functions can be found in this section.
Last Updated 2025-08-28 12:01:44 +0530 IST
Yes
No
Send your feedback to us