Dashboard
The Job Scheduling Dashboard can be accessed as a separate component of the Catalyst Job Scheduling service. The dashboard contains the following details:
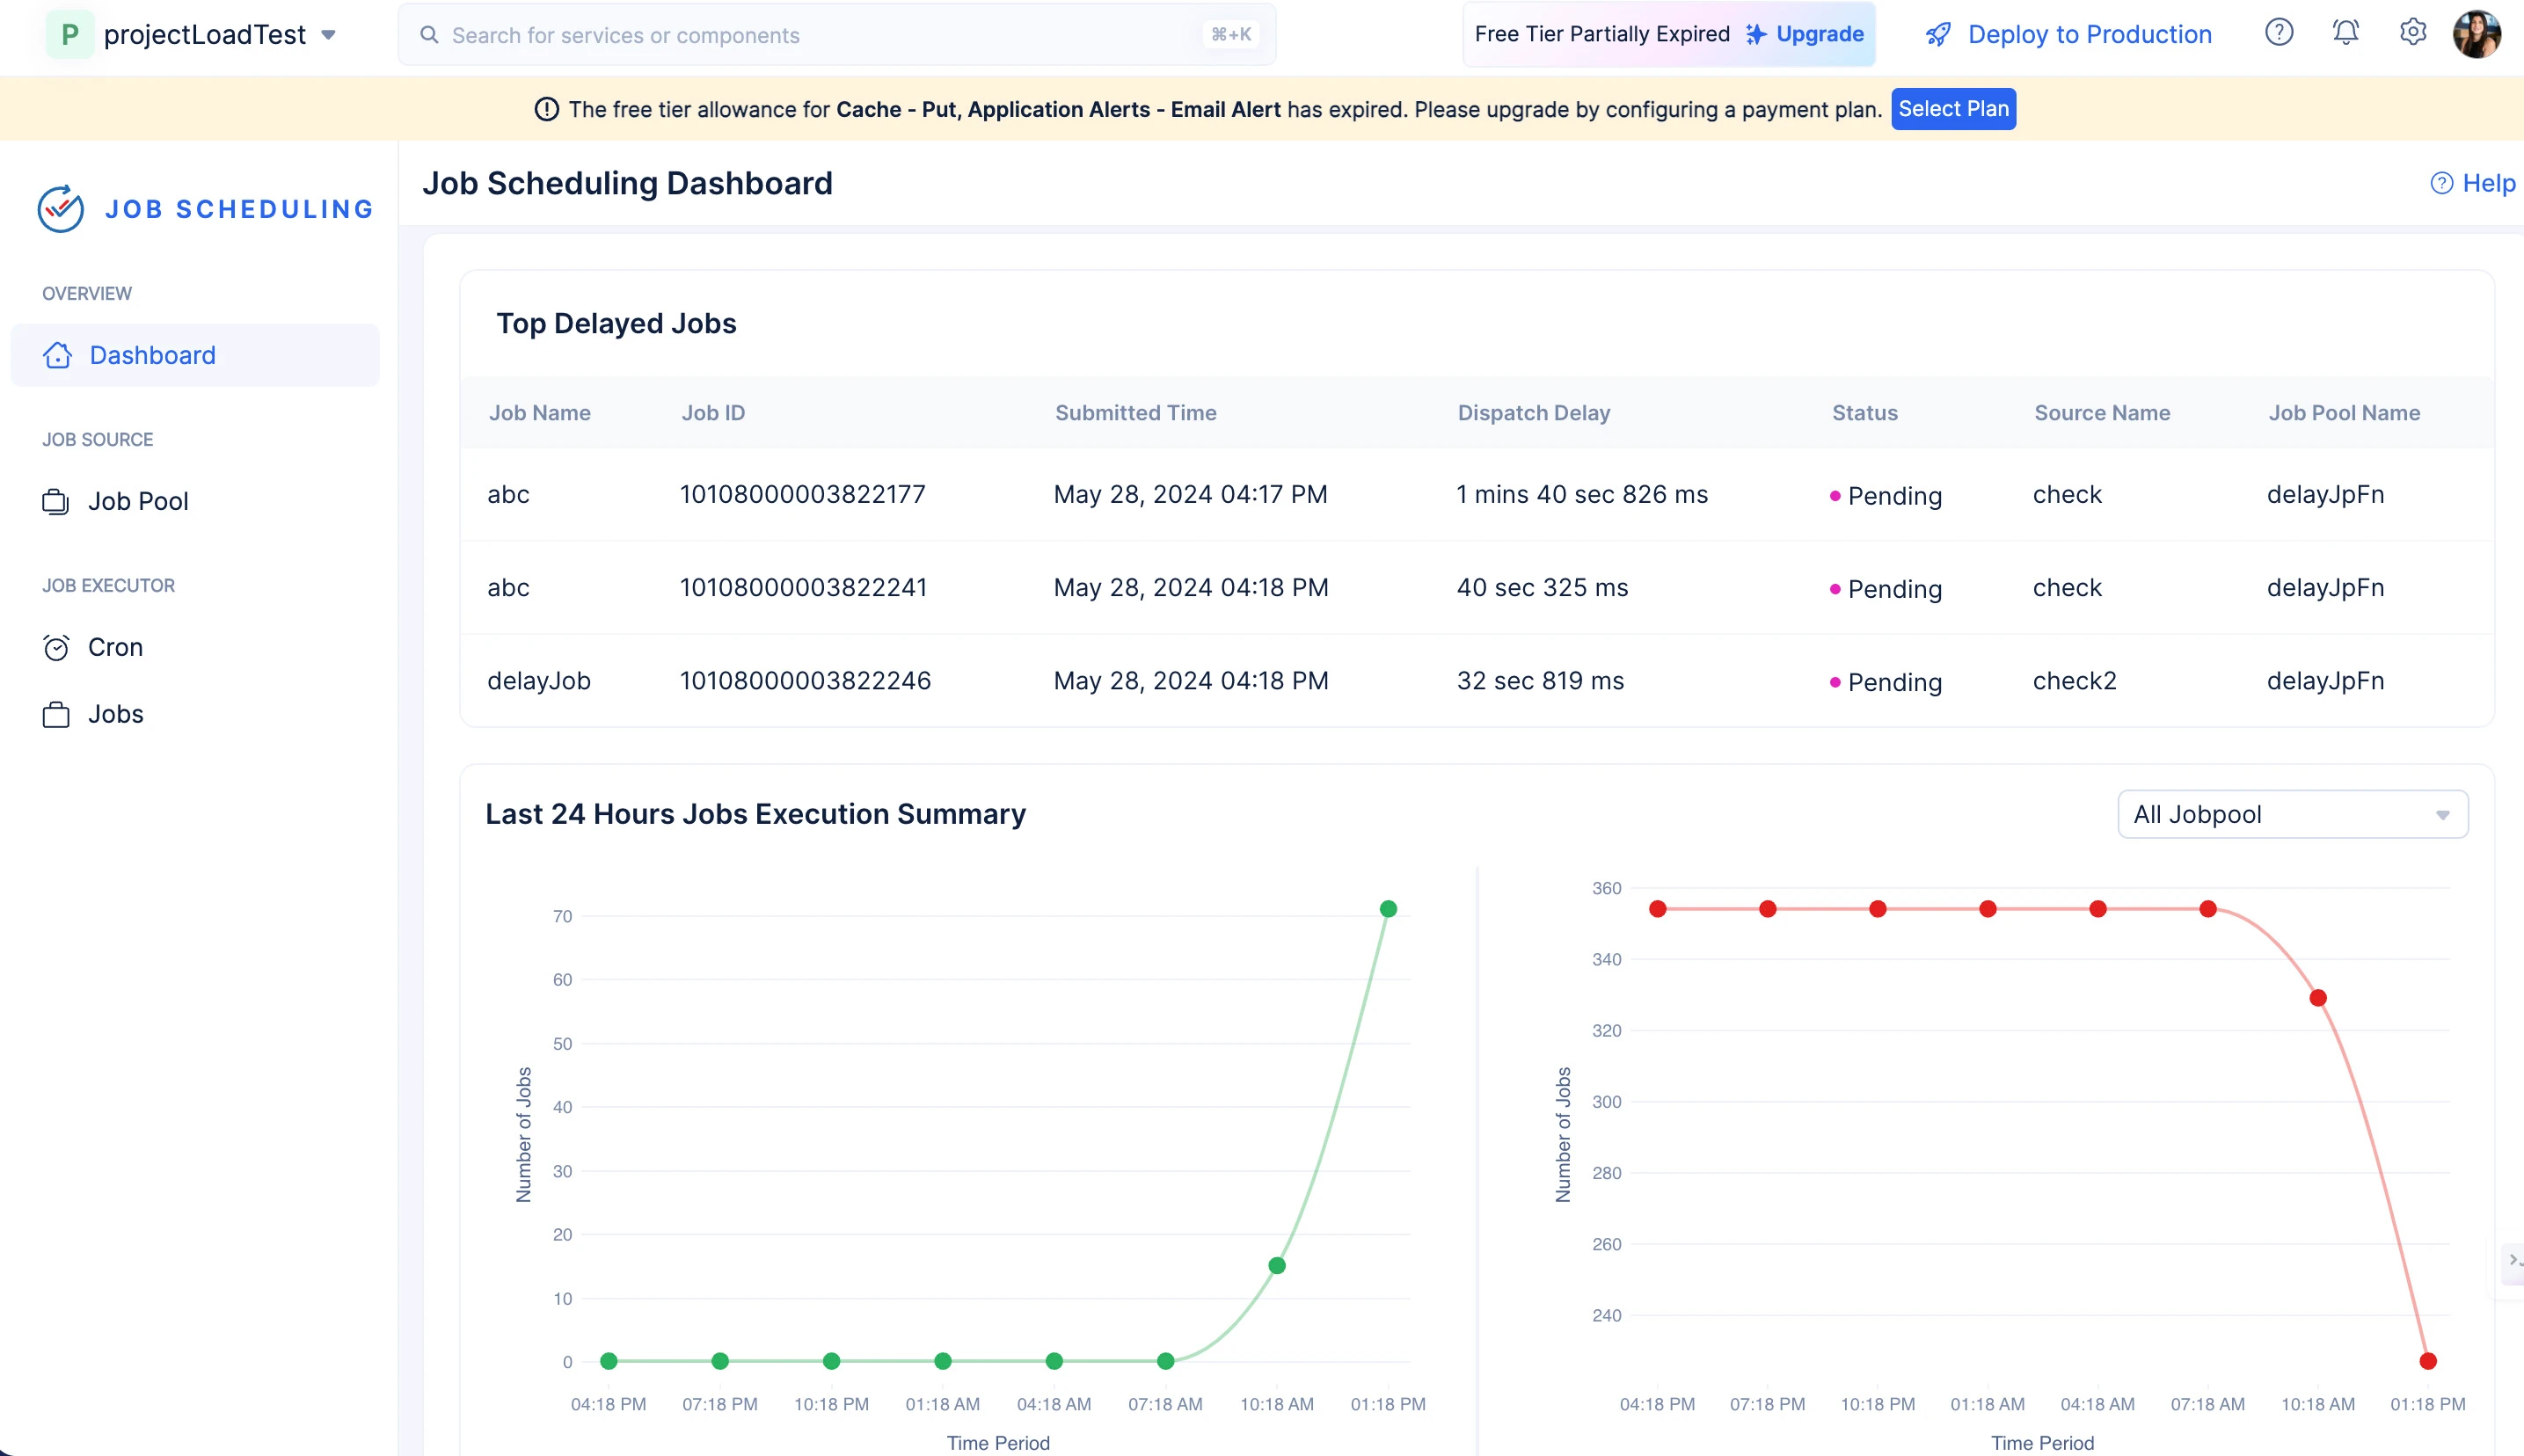
- List of all the top delayed jobs and their details.
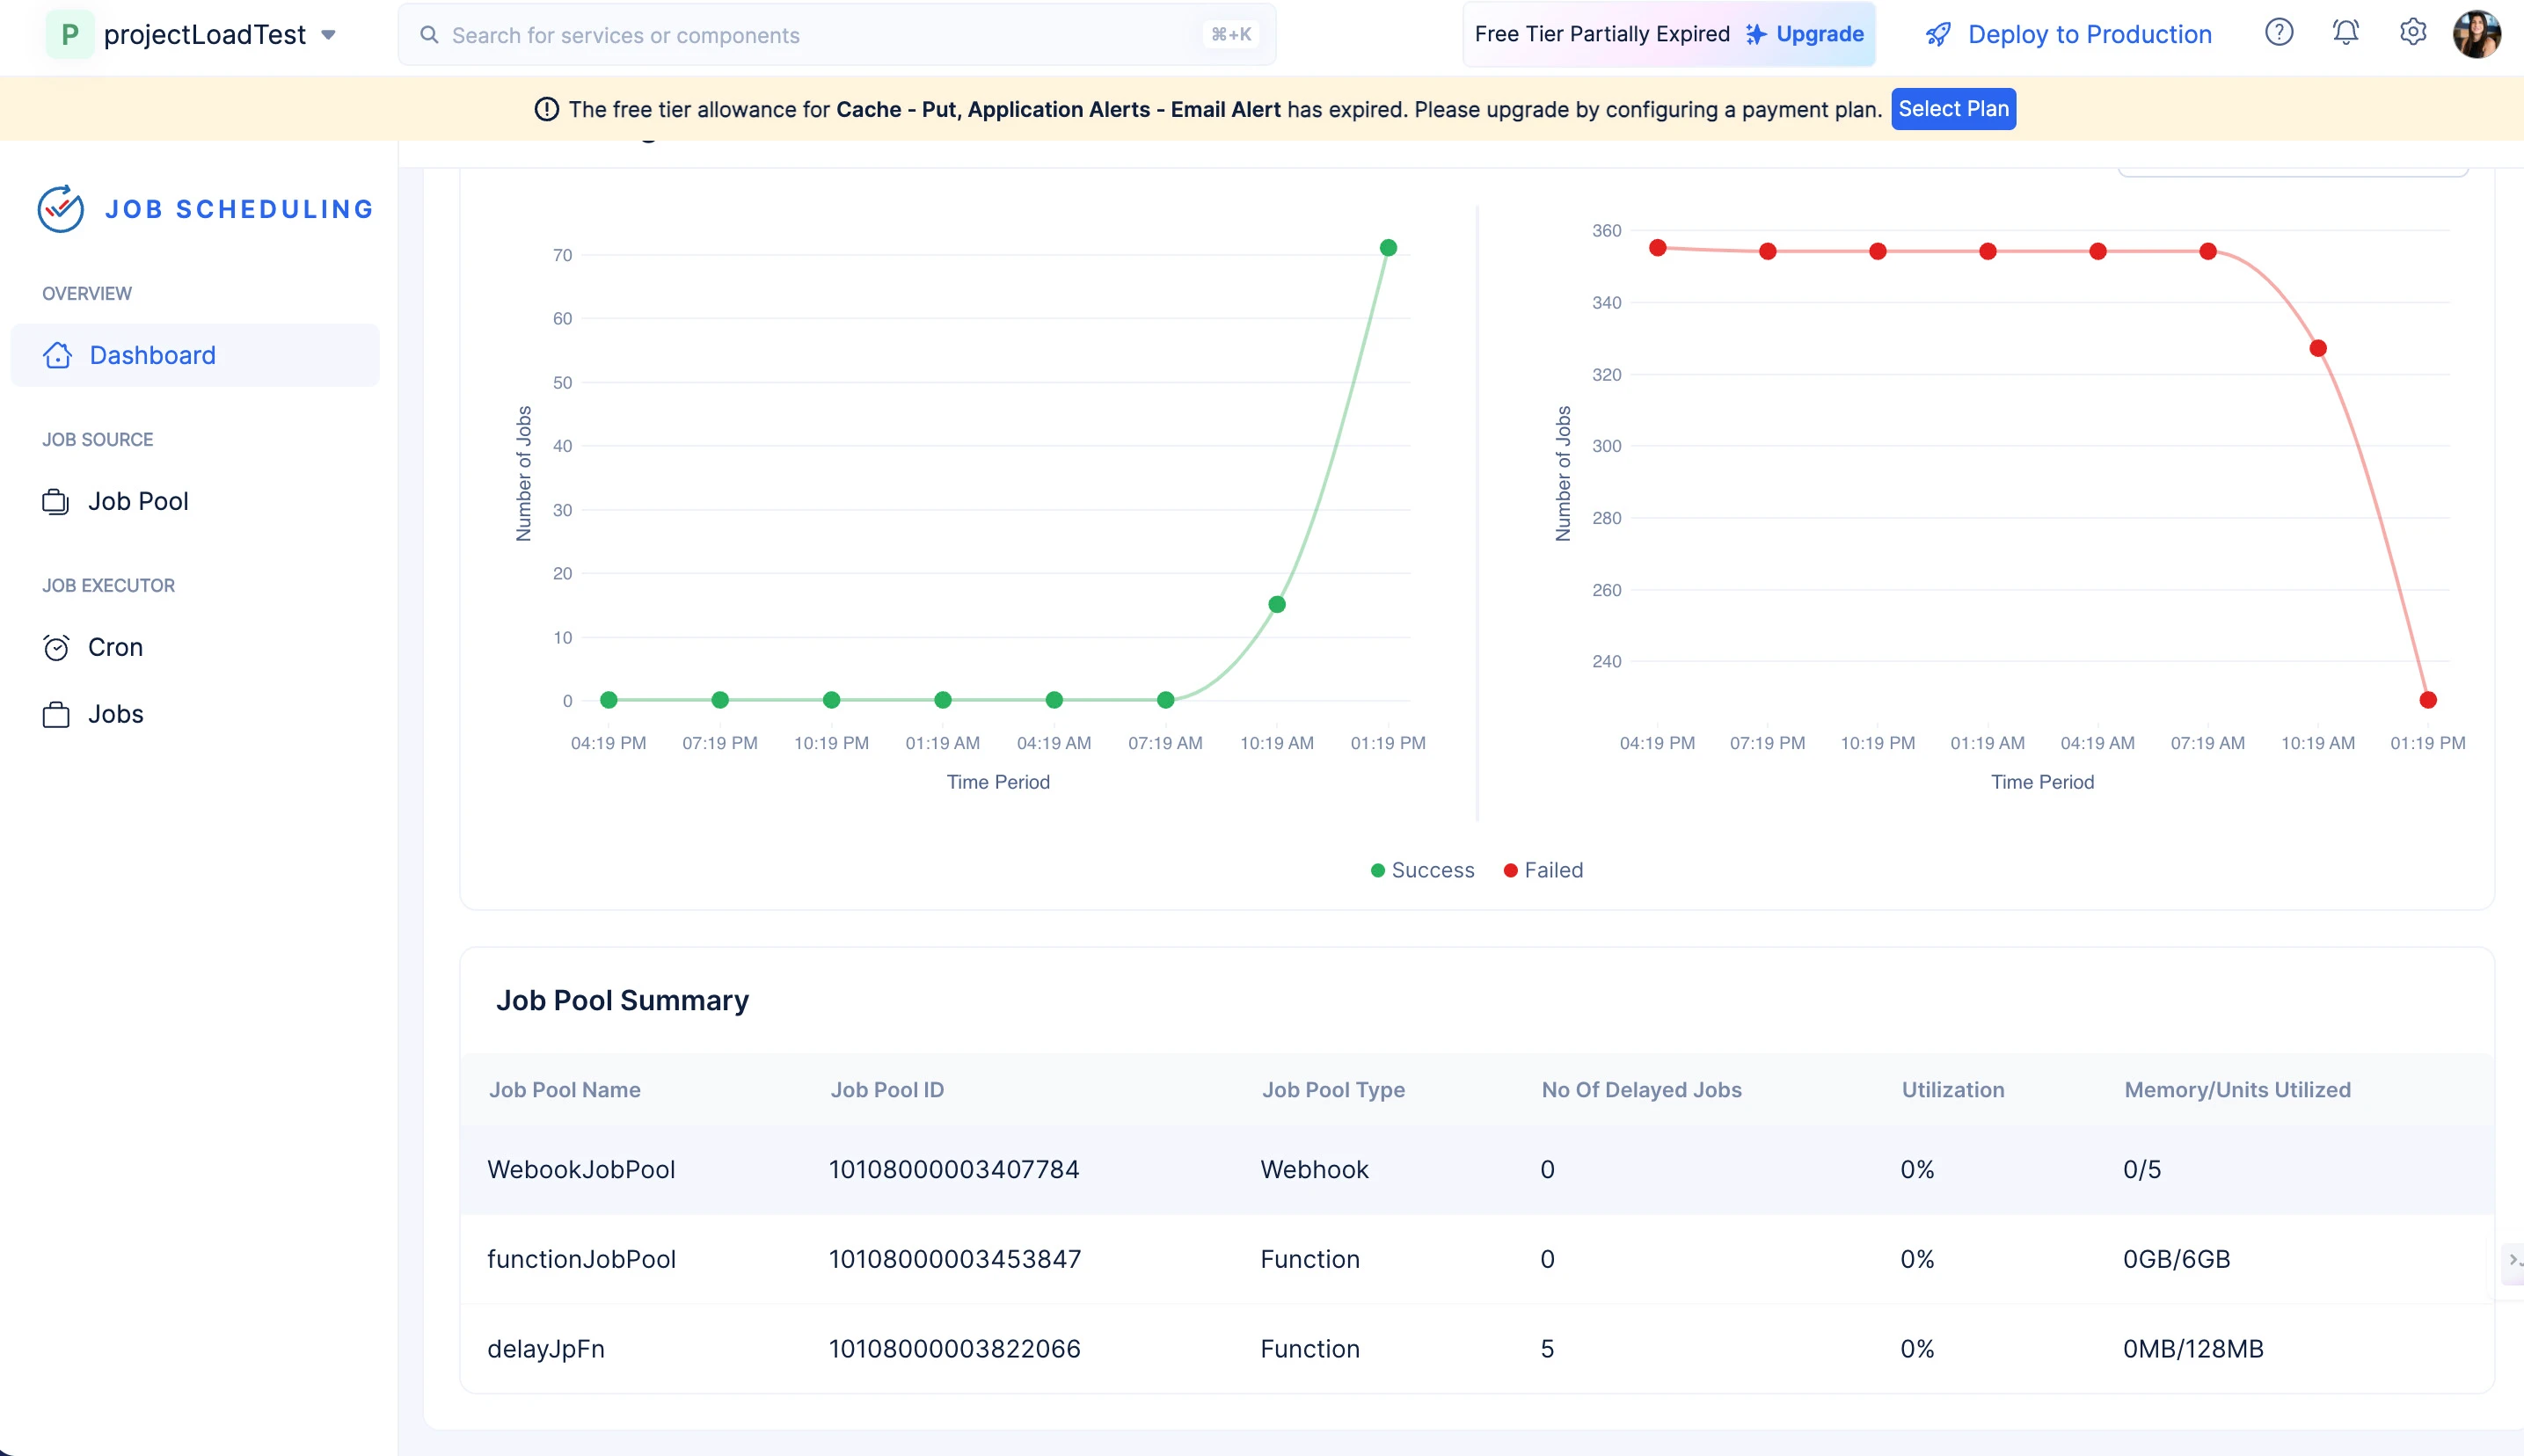
- A complete summary of the jobs that were executed in a 24-hour period is illustrated graphically in real-time.
- A real-time graph depicting the Success/Failure status of the jobs executed in all Job Pools present in the project. You can also filter this graph to illustrate results on individual Job Pool.
- An overview of the statuses of each of the Job Pools and information on the memory/units they have utilized.
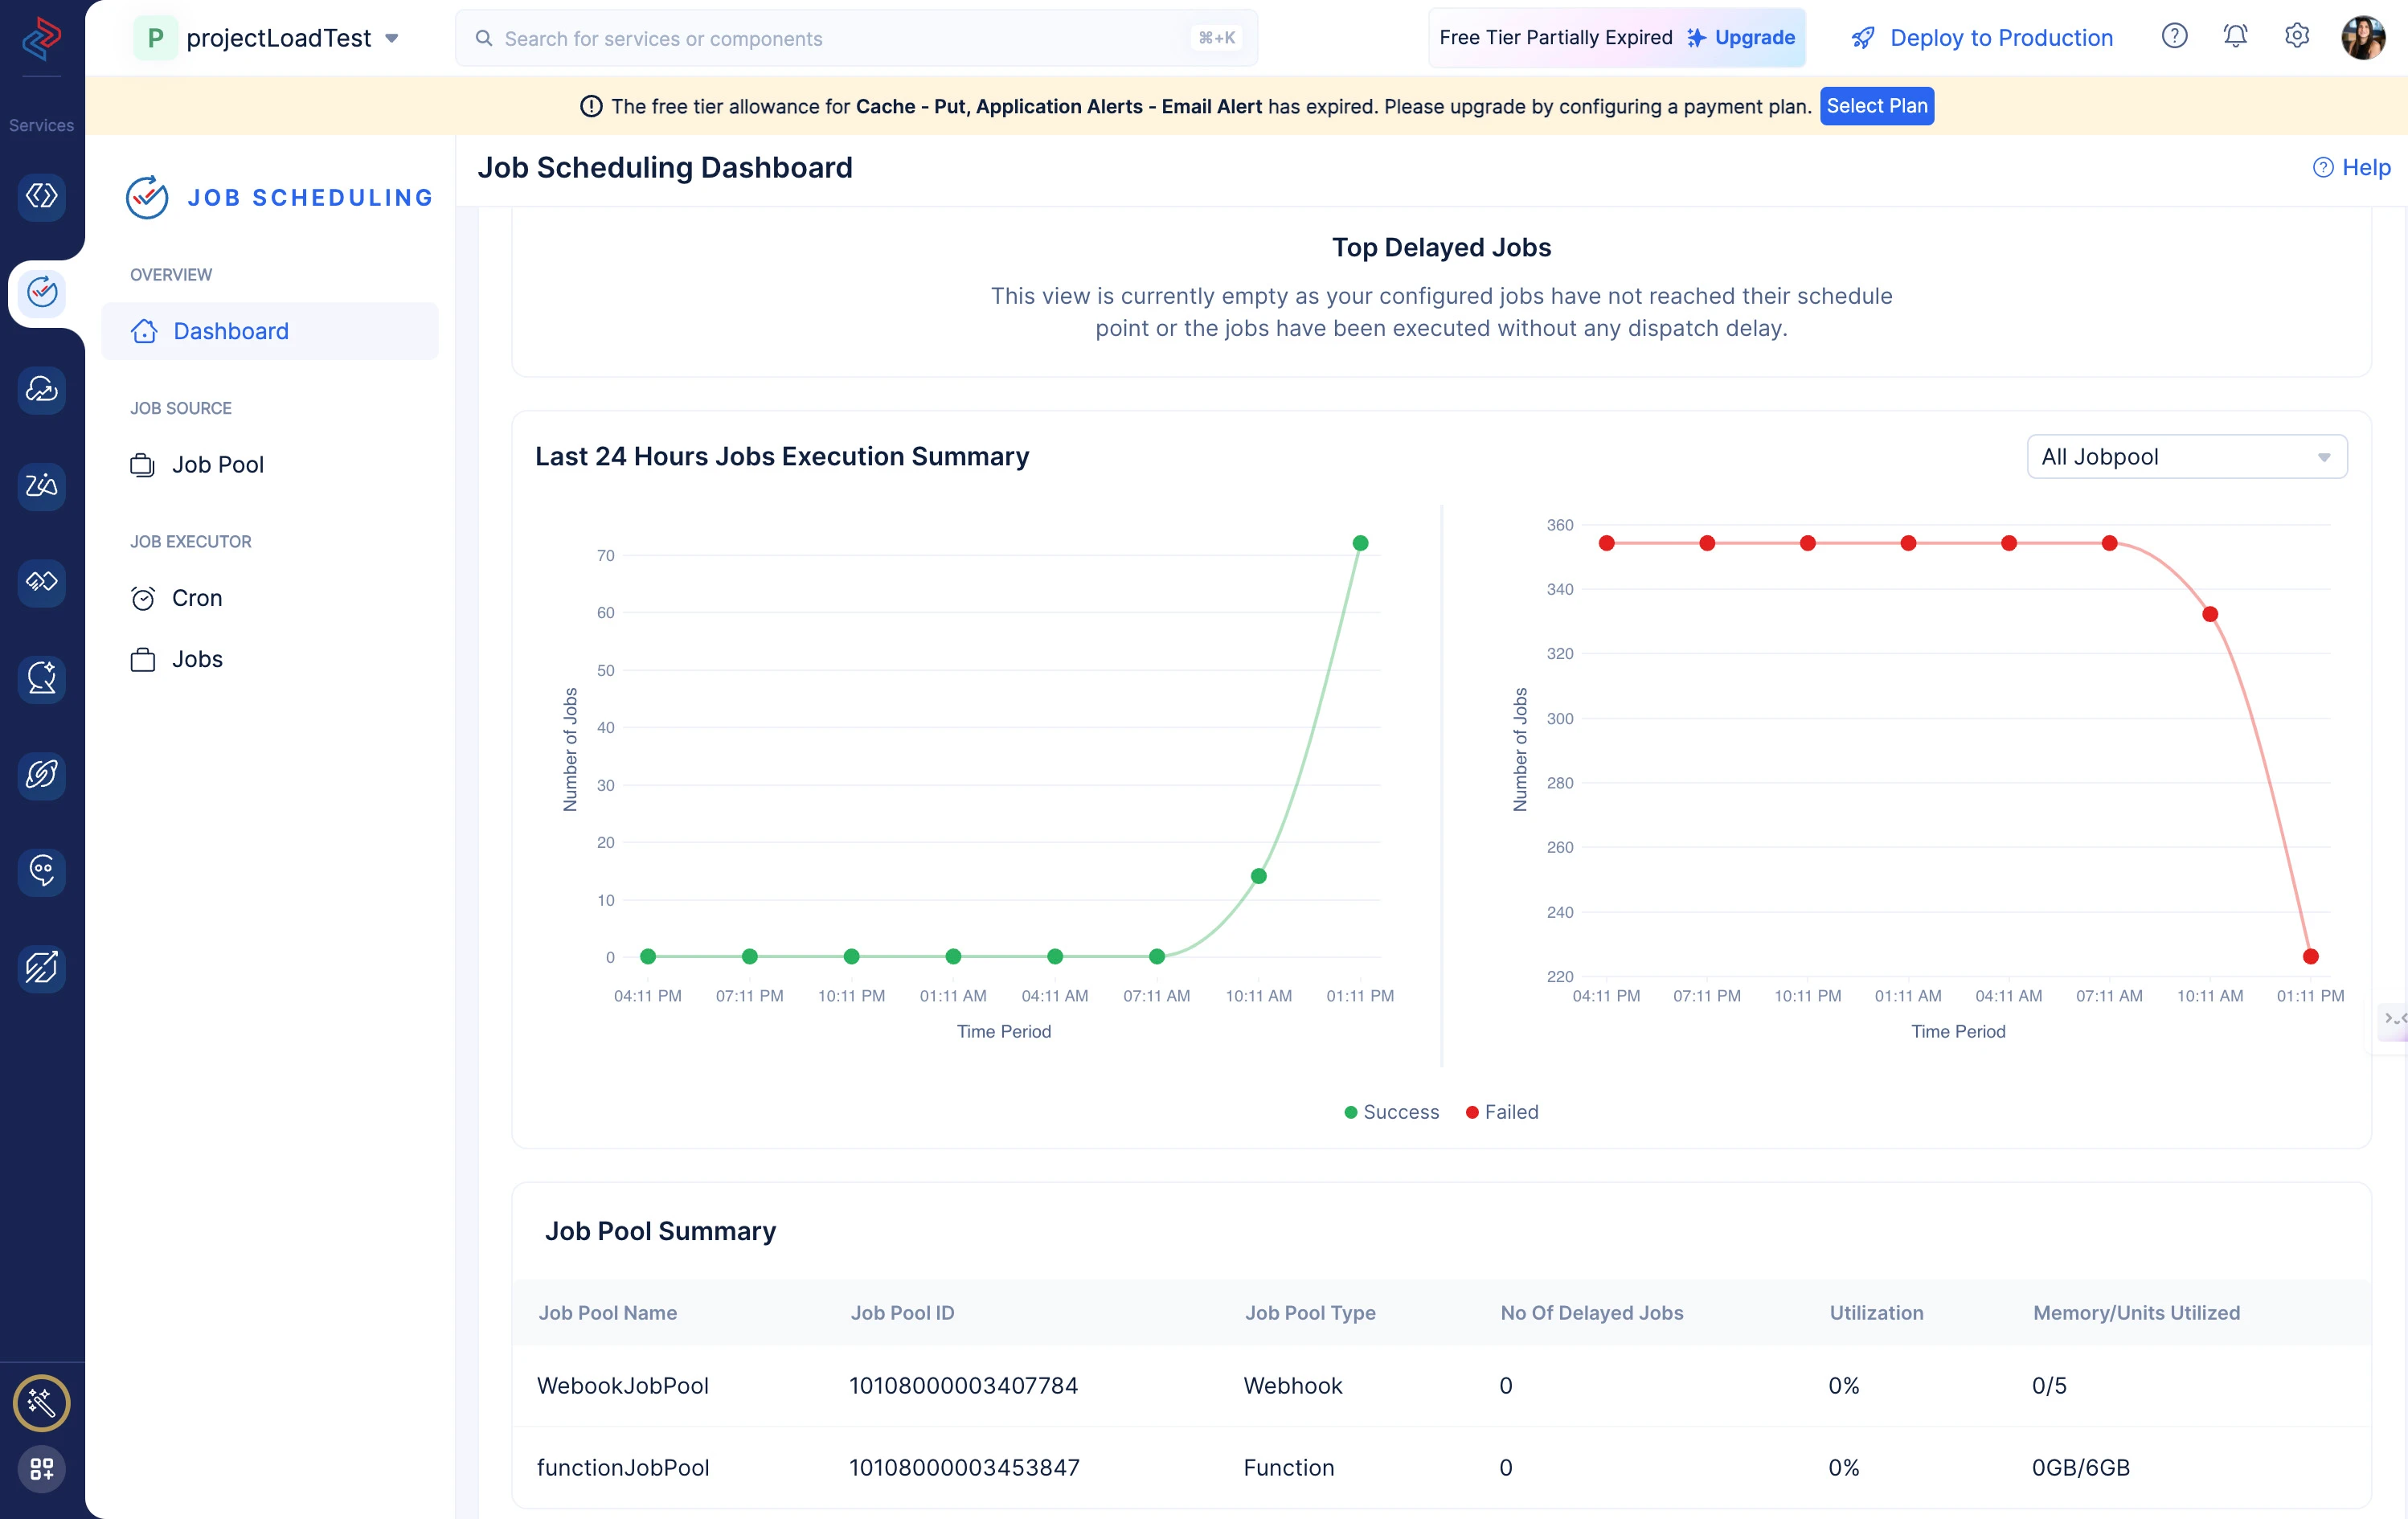
The dashboard allows you to infer the required details, and highlights the delayed jobs to enable you to take the appropriate actions like increasing the memory allocation for a Job Pool or creating a new Job Pool to reduce dispatch delays.
You can also perform the following actions:
-
You can click any of the jobs present in the top delayed jobs section and be directed to the Overview section present in the Jobs component.
-
You can directly access information on all of the Job Pools present in your project from the Job Pool Summary section.
Last Updated 2025-06-03 18:19:55 +0530 IST
Yes
No
Send your feedback to us